32 Carruthers Dr · Jackson, TN
Flood risk 1/10 · Minimal
- FEMA flood zone
- X (unshaded)
- Chance of flooding over 30 yrs
- 0.0%
- Est. flood insurance / yr
- $507 – $1,088
Fire risk 1/10 · Minimal
- Est. fire insurance / yr
- $949 – $1,763
Heat risk 6/10 · Moderate
- Hot days now (above 108°F)
- 7 days/yr
- Hot days in 30 yrs
- 20 days/yr
Wind risk 4/10 · Minor
- Chance of severe wind over 30 yrs
- 14.0%
Air-quality risk 1/10 · Minimal
- Unhealthy air days now
- 0 days/yr
- Unhealthy air days in 30 yrs
- 0 days/yr
Risk factors via First Street. Map © Google.
Why this score? — see what drove the C- grade
The composite is a weighted blend of 9 inputs, each scored 0–100. Each bar is that input's sub-score; the figure is the points it added to the 100-point composite (weight × sub-score).
- Cash flow +23.8/30.0
- DSCR +7.7/10.0
- ARV discount +7.5/15.0
- 1% rule +4.8/10.0
- Rent growth +3.8/5.0
- Livability +3.1/5.0
- Condition / age +2.5/5.0
- Schools +1.2/10.0
- Appreciation +0.0/10.0
$162,900
🖨 Deal sheet 📄 Offer letter ✓ Due diligence
Listing remarks
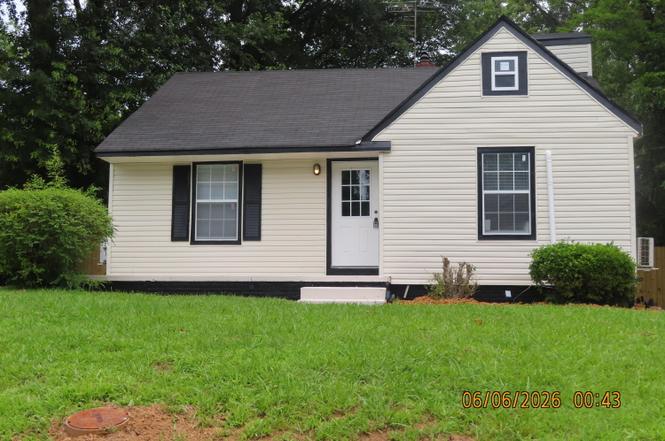
ADORABLE!! This Adorable 3 Bedroom 2 Bath Vinyl Siding Home has been Completely Renovated!! There is Slate Gray Laminate Flooring, New Light Fixtures, Gray Interior Paint, 2 Newly Renovated Bathrooms, New Kitchen Renovation including Cabinets, Sink, Counter tops, Refrigerator and So Much More!! The Exterior features a New Rear Deck, New Shutters, New Wood Fencing, Fresh Paint and Beautiful Landscaping!! Call Us for Your Private Tour !!
Key facts
- New rear deck
- New light fixtures
- Vinyl siding home
Tags
Property features AI
Exterior
- Parking: Open parking with 3 spaces
- Utilities: Public water; Public sewer; 220-volt electric service; Cable available; Electricity connected; Water connected; Sewer connected
- Home design: Single family residence; One and one-half level; 1-story listed; Vinyl siding; Raised permanent foundation; Home warranty included
- Construction: Vinyl siding construction; Composition/shingle roof; Raised permanent foundation
- Exterior features: Deck; Front porch; Privacy wood fencing; Composition/shingle roof; Rolling slope lot; Asphalt road frontage on a public maintained city street; Lot dimensions approximately 60 x 130
Interior
- Kitchen: Refrigerator; Range hood
- Bedrooms: 2 bedrooms on the main level
- Flooring: Laminate flooring
- Bathrooms: 2 full bathrooms (1 on the main level)
- Heating & cooling: Forced air heating; Other heating; Ductless cooling
- Interior features: Eat-in kitchen; Laminate counters; Blinds on windows
- Laundry & utility: Washer hookup; Electric dryer hookup; Electric water heater
Neighborhood map
What this means for you Summary
Snapshot
- This is a 3-bed/1.0-bath single-family listed at $163k.
Deal economics
- At list price, monthly cash flow is $314 ($4k/yr) — positive.
- The deal already cash-flows at list — no discount required.
- To meet the 1% rule (rent ≥ 1% of price), the offer needs to be $160k (1.7% below list).
- Recommended offer: $160k (1.7% below list) — sets the bar for 1% rule.
- Cap rate 8.6% vs local median 3.5% in Jackson — top-decile yield for the area; either an underpriced asset or a hidden risk that comps aren't pricing in. Stress-test before assuming the spread holds.
Location & tenants
- Location reads 62/100 on livability (#216 in TN) — a middle-class / working-renter tenant base. Strengths: cost of living A+, housing A+; Watch: health & safety C-, schools F, crime F.
- Madison County (urban): math 10% / reading 17% proficiency, ranked #131 of 139 in TN (top 94%) — low school quality limits family demand, transient renter base, plan for 1-2y turnover; 68% free/reduced lunch — lower-income household profile, screen leases tightly.
- Market conditions: Rents rising fast (+5.2%/yr); 253 active listings in the ZIP; 1 comparable units currently listed for rent nearby; lower-income renter base — watch delinquency; 247 units permitted in Madison County in 2024 (0 in 5+ unit buildings).
- This rent runs 44% of the median local income ($43k/yr) — at the standard rent-burdened threshold; future hikes will face affordability resistance.
Forward outlook
- Local home prices are declining (-3.0%/yr); year-one equity from $1k of loan paydown is wiped out by about $5k of value loss. Plan a longer hold.
- Madison County population projected at -12% by 2050 — secular population decline; favor cash flow + early exit over multi-decade hold.
- At projected returns (-3.0% appreciation + 5.2% rent growth), your $46k cash investment doubles in ~10 years — after that, you're playing with house money.
Negotiation context
- Only 4 days on market — expect competitive offers; lowballing is unlikely to land.
Risks & watch-outs
- Watch-outs: built in 1952 — expect roof / HVAC / electrical / plumbing capex.
- Climate carrying-cost: extreme-heat days projected 7→20/yr by 2055 (HVAC capex compounding) — expect insurance premiums to compound above CPI over the hold.
Questions for the listing agent
- Built in 1952 — when were the roof, HVAC, electrical panel, plumbing, and water heater last replaced?
- Is there a deadline driving the sale (1031 exchange, divorce, estate, relocation)? That informs how much negotiation room exists.
- Schools are F-rated, which usually means shorter tenancies and higher turnover. Who's the typical renter profile here, and what's been the actual vacancy rate?
- Crime grade is F in this area — have there been break-ins, vandalism, or insurance claims at this property in the last 3 years? What carrier currently insures it and at what premium?
- What's the average days-on-market for RENTAL listings here right now (not sales)? A rising rental-DOM trend means longer vacancies and softer asking-rent achievability than the comps imply.
- What's the recent tenant-quality profile in this submarket — average credit score on applications, eviction rate, late-payment / NSF rate, and stable-employment percentage? A property-management company in the area should have these aggregated.
- How much new for-sale + rental construction is in the pipeline within 1–3 miles? Heavy new supply typically softens prices + rents 12–24 months out; constrained supply supports both.
Investment metrics
- 1% rule
- 0.98% ✗
- Cap rate
- 8.61%
- Cash-on-cash
- 8.27%
- DSCR
- 1.37
- GRM
- 8.5
CMA / ARV
- ARV (on-the-fly)
- $88,580
- Comps found
- 7
Show comp detail 7 sales within ~0.75 mi
| Address | Dist | Beds/Ba | Sqft | Sold | Price | $/sf | Match |
|---|---|---|---|---|---|---|---|
| 115 Neff St | 0.41mi | 2/1.0 (-1) | 875 (+2%) | 2mo | $90,300 | $103 | 71 |
| 100 Logan St | 0.28mi | 2/1.0 (-1) | 880 (+2%) | 11mo | $12,000 | $14 | 69 |
| 344 Phillips St | 0.24mi | 3/1.0 | 963 (+12%) | 1mo | $129,900 | $135 | 68 |
| 543 Berry St | 0.42mi | 2/2.0 (-1) | 864 (+0%) | 20mo | $45,000 | $52 | 54 |
| 66 Labelle St | 0.50mi | 3/1.0 | 960 (+12%) | 11mo | $128,000 | $133 | 48 |
| 47 Cartmell St | 0.65mi | 2/1.0 (-1) | 846 (-2%) | 21mo | $79,000 | $93 | 44 |
| 91 Holland Ave | 0.59mi | 2/2.0 (-1) | 892 (+4%) | 23mo | $190,000 | $213 | 39 |
Match score weights: distance 35% · size 25% · config 20% · recency 20%. Top-matched comps best support the ARV.
Projected returns pro-forma
-3.0% appreciation · 5.19% rent growth · sell at horizon
- IRR
- -1.6%
- Equity multiple
- 0.94×
- Total profit
- $-2,846
- Equity at exit
- $24,289
- IRR
- 10.0%
- Equity multiple
- 1.84×
- Total profit
- $38,452
- Equity at exit
- $14,085
Cash invested: $45,612 (down + closing). Projections, not guarantees.
Landlord ↔ Tenant lean methodology
- Overall (STATE)
- 87 Strongly Landlord-Friendly
- State Tennessee
- 87 Strongly Landlord-Friendly · R+13
- County
- — inherits STATE
- City
- — inherits STATE
ZIP-level market 38301
- Rents YoY
- 5.2%
- Active inventory
- 253
- Price-to-rent
- 8.5×
Monthly cashflow live
- Estimated rent
- $1,602 medium interval (Pro) →
- Mortgage (P&I)
- −$854
- Tax from tax record
- −$29 /mo · $348/yr
- Insurance
- −$68
- HOA
- −$0
- Vacancy / Maint / Mgmt
- −$336
- Net cashflow
- $314
Break-even live
UW: 25.0% down · 7.5% · 30yr · 1.5% tax · 5.0% vac · 8.0% maint · 8.0% mgmt
Financing live
Cash to close
- Down payment
- $40,725
- Closing costs
- $4,887
- Reserves months
- —
- Total cash needed
- —
Loan-product check · same deal, 3 products live
Conventional
25% down · 7.5% · 30yr
- Down + closing
- —
- Monthly P&I
- —
- Monthly cashflow
- —
- DSCR
- —
- Eligible?
- —
Personal DTI + credit; lowest rate.
DSCR
20% down · 8.5% · 30yr
- Down + closing
- —
- Monthly P&I
- —
- Monthly cashflow
- —
- DSCR
- —
- Eligible?
- —
No personal income docs; deal must DSCR.
Hard money
10% down · 12.0% · 12mo
- Down + closing
- —
- Monthly P&I
- —
- Monthly cashflow
- —
- DSCR
- —
- Eligible?
- —
Short-term bridge; refi at stabilization.
Rent comps 1 comps
| Address | Beds | Baths | Sqft | Rent | $/sqft | DOM | Units | Dist |
|---|---|---|---|---|---|---|---|---|
| 102 Jackson Walk Plz Jackson, TN | 1.0–3.0 | 1.0–2.5 | 1082 | $2,600 | $2.40 | 44d | 1 | 1.38mi |
Listing history 5 events
-
2026-06-19days on market $162,900 Active 4 DOM
-
2026-06-18days on market $162,900 Active 3 DOM
-
2026-06-17days on market $162,900 Active 2 DOM
-
2026-06-16remarks 441-char remark
-
2026-06-16$162,900 Active 1 DOM
ⓘ Source: listings_history table (triggers on properties + properties_extension) + one-shot
backfill from property_details.listing_events for pre-trigger history.
Tax reassessment forecast TN · Resets to sale price
- Current annual tax
- $348 · $29/mo
- Projected year-2 tax
- $1,157 · $96/mo
- Expected delta
- +$809/yr (+$67/mo · 232.4%)
ⓘ Screening estimate from a state-policy table — verify with the county assessor before closing.
Climate risk First Street
- Flood 1/10 Low FEMA zone X (unshaded) · 0% chance over 30 yrs
- Wildfire 1/10 Low
- Heat 6/10 Major 7 d/yr ≥108°F today · 20 d/yr by 30 yrs out
- Wind 4/10 Moderate 14% chance of damaging wind over 30 yrs
- Air quality 1/10 Low 0 unhealthy d/yr today · 0 by 30 yrs out
Nearby sold comps map
Loading sold comps map…
Walkable amenities ~0.75 mi
Loading nearby amenities…
Taxation est. · year 1
- Rental income
- $19,224
- − Mortgage interest
- −$9,125
- − Property taxes
- −$348
- − Insurance
- −$814
- − Repairs & maintenance
- −$1,538
- − Management
- −$1,538
- − Depreciation
- −$4,739
- Taxable income
- $1,122
- Est. tax owed @ 24.0%
- −$269
- After-tax cash flow
- $3,504/yr
For passive investors: Depreciation is non-cash, so a rental often shows a tax loss while cash-flowing — sheltering income. Rental losses are passive: they offset passive income freely, and up to $25,000/yr can offset ordinary (W-2) income if you actively participate and your MAGI is under $100k (phasing out to $0 by $150k); unused losses carry forward. On sale, claimed depreciation is recaptured at up to 25%, and gains may owe capital-gains tax (a 1031 exchange can defer both). Figures are a year-1 estimate at your 24.0% rate — not tax advice; consult a CPA.
Schools (NCES district)
- District
- Madison County
- NCES district ID
- 4702580
- Math proficiency
- 10% ▼ -11.00%
- Reading proficiency
- 17% ▼ -4.00%
- Median HH income
- $42,015
- Composite
- 11.74/100
- National rank
- #9687
- State rank
- #131 of 139 in TN
Livability — Jackson
- Score
- 62/100
- State rank
- #216
- US rank
- #16488
Category grades
Schools grade is shown separately in the Schools card above.
Census & demographics
- Census place
- Jackson, TN
- County
- Madison County · 87,024 people
- City population
- 87,024
- Metro
- Jackson, TN
- Population (ZIP)
- 33,536
- Household income
- $43,227
- Rent vs Own
- Severe rent burden
- 1701.0
Population outlook (Madison County) Hauer SSP2
- Today (2025)
- 95,952 people
- By 2030
- 94,264 · -1.8%
- By 2040
- 89,607 · -6.6%
- By 2050
- 84,133 · -12.3%
- By 2075
- 72,215 · -24.7%
- By 2100
- 62,062 · -35.3%
Race, ethnicity, and origin ACS 2023
- Neighborhood character
- Diverse neighborhood (Simpson 0.57)
- Race & ethnicity
- Black 50% White 42% Two or more races 5% Hispanic / Latino 4%
- Common ancestry
- Slovak 1% Serbian 1% Portuguese 1%
- Foreign-born
- 3% · Canada
- Languages at home
- 96% English-only · Spanish 3%
Political lean MEDSL · Madison
- 2024 margin
- R (+18.2) · D 40.3% · R 58.5% · Other 1.2%
- 2008→2024 swing
- +3.4pp toward D · 2008: -21.6pp · 2024: -18.2pp
- All cycles
- 2024: R+18.2 2020: R+12.9 2016: R+15.6 2012: R+8.9 2008: R+21.6
Not yet ingested
- Civics
- —
Market trends
- HPI YoY
- ▼ -112.26%
- Current HPI
- 162.2273
- Rent YoY
- ▲ 5.19%
- Metro
- Jackson, TN
- State GDP YoY
- ▲ 2.78%
- F500 in state
- 22
Industry mix (Fortune 500 HQ in TN)
| Industry | F500 HQs | Revenue |
|---|---|---|
| Healthcare | 3 | $91B |
|
||
| Retail | 3 | $72B |
|
||
| Transportation / Logistics | 1 | $88B |
|
||
| Paper / Packaging | 1 | $19B |
|
||
| Insurance | 1 | $13B |
|
||
| Energy | 1 | $12B |
|
||
Price history
1 event — show timeline
- 2026-06-08 Listed $162,900 CWTAR
Property tax history
+1.7%/yrLatest (2025): $348 · +0.0% YoY. Source: county tax records.
Cash-flow waterfall
monthlySold comps — $/sqft
last 12 mo · ≤1 miLoading sold comps…