1804 E 34th St · Indianapolis city (balance), IN
Flood risk 1/10 · Minimal
- FEMA flood zone
- X (unshaded)
- Chance of flooding over 30 yrs
- 0.0%
- Est. flood insurance / yr
- $507 – $1,088
Fire risk 1/10 · Minimal
- Est. fire insurance / yr
- $717 – $1,331
Heat risk 4/10 · Minor
- Hot days now (above 102°F)
- 7 days/yr
- Hot days in 30 yrs
- 18 days/yr
Wind risk 2/10 · Minimal
- Chance of severe wind over 30 yrs
- 1.0%
Air-quality risk 4/10 · Minor
- Unhealthy air days now
- 5 days/yr
- Unhealthy air days in 30 yrs
- 7 days/yr
Risk factors via First Street. Map © Google.
Why this score? — see what drove the B- grade
The composite is a weighted blend of 9 inputs, each scored 0–100. Each bar is that input's sub-score; the figure is the points it added to the 100-point composite (weight × sub-score).
- Cash flow +25.5/30.0
- ARV discount +15.0/15.0
- DSCR +8.5/10.0
- 1% rule +7.5/10.0
- Rent growth +2.7/5.0
- Livability +2.5/5.0
- Condition / age +2.5/5.0
- Schools +1.4/10.0
- Appreciation +0.0/10.0
$119,900
🖨 Deal sheet 📄 Offer letter ✓ Due diligence
Listing remarks MLS
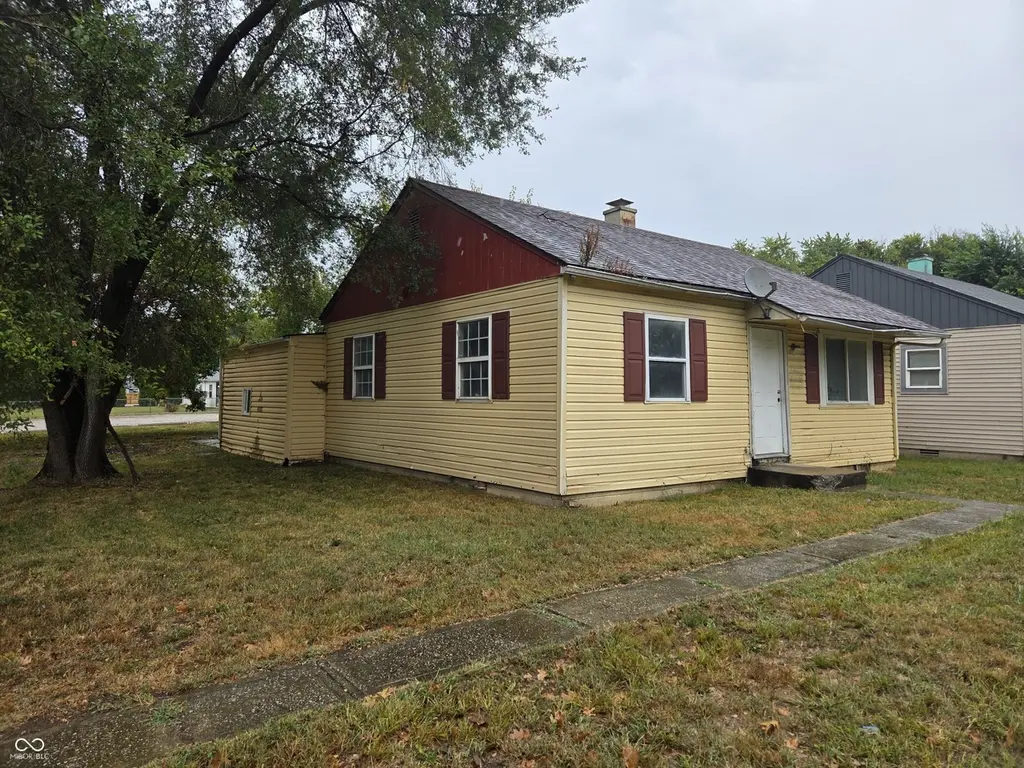
Potential investment property or house hack. This single family home has been converted into a front and back duplex. The front unit is comprised of 2 bedrooms, family room, kitchen/utility room, and full bathroom. The rear unit has 3 bedrooms, large family room, kitchen, full bathroom, and utility room. Property is in need of repairs. Roof looks newer and some vinyl windows also appear newer. Convert this back to a single family residence, or refresh both units and keep as a cash flowing double. Multiple options for an investor looking to add another property to their existing portfolio. Only cash offers will be considered, no wholesalers, assignments of contract, or seller financing. Sight unseen offers will not be considered.
Key facts
- Vinyl windows
- Newer roof
- 6,011 sq ft lot
Tags
Neighborhood map
What this means for you Summary
Snapshot
- This is a 2-bed/1.0-bath single-family listed at $120k.
Deal economics
- At list price, monthly cash flow is $280 ($3k/yr) — positive.
- The deal already cash-flows at list — no discount required.
- Meets the 1% rule at list price ($2k rent vs $120k).
- Recommended offer: $106k (12.0% below list) — sets the bar for market timing.
- Cap rate 9.1% vs local median 4.4% in Indianapolis city (balance) — top-decile yield for the area; either an underpriced asset or a hidden risk that comps aren't pricing in. Stress-test before assuming the spread holds.
Location & tenants
- Location reads: area grade B — affects rentability + tenant quality, not the cash-flow math above.
- Indianapolis Public Schools (urban): math 14% / reading 20% proficiency, ranked #286 of 301 in IN (top 95%) — low school quality limits family demand, transient renter base, plan for 1-2y turnover; 77% free/reduced lunch — lower-income household profile, screen leases tightly.
- Market conditions: Rents flat; 334 active listings in the ZIP; 40 comparable units currently listed for rent nearby; rentals at typical pace (median 24d on market — plan ~3-4 weeks tenant-placement turnaround); 40% of comp listings sitting > 30 days — soft ceiling on asking rent; lower-income renter base — watch delinquency; 1,906 units permitted in Marion County in 2024 (621 in 5+ unit buildings).
- At $1,500/mo this rent would consume 47% of the median local household income ($38k/yr) (locally 2340% of renters already pay >50% of income on rent) — very limited rent-growth headroom before tenants either downsize or default.
Forward outlook
- Local home prices are declining (-3.0%/yr); year-one equity from $829 of loan paydown is wiped out by about $4k of value loss. Plan a longer hold.
- Marion County population projected at +18% by 2050 — long-run rental-demand tailwind backs the buy-and-hold thesis.
Negotiation context
- It's been on market 269 days — a 12% lower offer ($106k) is reasonable based on typical stale-listing flexibility.
- 13 sale attempts since 23y ago; this cycle's ask has dropped $30k (20%) from the opening price — seller is motivated, your offer sets the floor, not the list.
- Current owner paid $80k; 50% above their basis — modest negotiation headroom, anchor on the comps not their cost.
Risks & watch-outs
- Watch-outs: built in 1951 — expect roof / HVAC / electrical / plumbing capex.
Questions for the listing agent
- It's been on market 269 days. Have you received any prior offers? Is the seller open to a 12% concession, seller financing, or rate buy-down credit?
- Built in 1951 — when were the roof, HVAC, electrical panel, plumbing, and water heater last replaced?
- Why hasn't it sold? Are there any deal-killer items the seller is aware of (foundation, flood, title, zoning, code violations)?
- Is there a deadline driving the sale (1031 exchange, divorce, estate, relocation)? That informs how much negotiation room exists.
- What's the average days-on-market for RENTAL listings here right now (not sales)? A rising rental-DOM trend means longer vacancies and softer asking-rent achievability than the comps imply.
- What's the recent tenant-quality profile in this submarket — average credit score on applications, eviction rate, late-payment / NSF rate, and stable-employment percentage? A property-management company in the area should have these aggregated.
- How much new for-sale + rental construction is in the pipeline within 1–3 miles? Heavy new supply typically softens prices + rents 12–24 months out; constrained supply supports both.
Investment metrics
- 1% rule
- 1.25% ✓
- Cap rate
- 9.10%
- Cash-on-cash
- 10.02%
- DSCR
- 1.45
- GRM
- 6.7
CMA / ARV
- ARV (median comp)
- $181,072
- List price
- $119,900
- Delta
- -33.78%
- Verdict
- UNDERPRICED
- Comps
- 20 within 1.0 mi
Show comp detail 12 sales within ~0.75 mi
| Address | Dist | Beds/Ba | Sqft | Sold | Price | $/sf | Match |
|---|---|---|---|---|---|---|---|
| 3458 Orchard Ave | 0.11mi | 3/1.0 (+1) | 1,728 (-6%) | 4mo | $68,150 | $39 | 78 |
| 3425 Hillside Ave | 0.31mi | 3/1.5 (+1) | 1,816 (-1%) | 1mo | $117,700 | $65 | 77 |
| 3533 Orchard Ave | 0.20mi | 3/1.0 (+1) | 1,728 (-6%) | 6mo | $98,000 | $57 | 72 |
| 3432 Ralston Ave | 0.12mi | 3/1.0 (+1) | 2,000 (+9%) | 3mo | $130,000 | $65 | 71 |
| 3028 Hovey St | 0.50mi | 2/1.0 | 1,810 (-1%) | 7mo | $85,000 | $47 | 69 |
| 3437 Caroline Ave | 0.22mi | 2/1.0 | 1,568 (-14%) | 1mo | $40,000 | $26 | 66 |
| 3350 N Arsenal Ave | 0.27mi | 2/1.0 | 1,632 (-11%) | 5mo | $90,000 | $55 | 65 |
| 3512 N Keystone Ave | 0.42mi | 3/2.0 (+1) | 1,768 (-3%) | 2mo | $190,000 | $107 | 64 |
| 3731 Caroline Ave | 0.45mi | 3/1.0 (+1) | 1,898 (+4%) | 6mo | $145,000 | $76 | 63 |
| 3645 Birchwood Ave | 0.62mi | 3/1.5 (+1) | 1,800 (-2%) | 6mo | $251,500 | $140 | 57 |
| 3640 N Temple Ave | 0.66mi | 2/1.0 | 2,080 (+14%) | 0mo | $126,000 | $61 | 46 |
| 3066 N Temple Ave | 0.65mi | 2/1.0 | 1,610 (-12%) | 6mo | $60,000 | $37 | 45 |
Match score weights: distance 35% · size 25% · config 20% · recency 20%. Top-matched comps best support the ARV.
Projected returns pro-forma
-3.0% appreciation · 0.81% rent growth · sell at horizon
- IRR
- -3.9%
- Equity multiple
- 0.86×
- Total profit
- $-4,739
- Equity at exit
- $17,877
- IRR
- 3.0%
- Equity multiple
- 1.19×
- Total profit
- $6,444
- Equity at exit
- $10,367
Cash invested: $33,572 (down + closing). Projections, not guarantees.
Landlord ↔ Tenant lean methodology
- Overall (STATE)
- 90 Strongly Landlord-Friendly
- State Indiana
- 90 Strongly Landlord-Friendly · R+11
- County
- — inherits STATE
- City
- — inherits STATE
ZIP-level market 46218
- Home prices YoY
- -17.1%
- Rents YoY
- 0.8%
- Active inventory
- 334
- Price-to-rent
- 6.7×
Monthly cashflow live
- Estimated rent
- $1,500 high interval (Pro) →
- Mortgage (P&I)
- −$629
- Tax from tax record
- −$226 /mo · $2,712/yr
- Insurance
- −$50
- HOA
- −$0
- Vacancy / Maint / Mgmt
- −$315
- Net cashflow
- $280
Break-even live
UW: 25.0% down · 7.5% · 30yr · 1.5% tax · 5.0% vac · 8.0% maint · 8.0% mgmt
Financing live
Cash to close
- Down payment
- $29,975
- Closing costs
- $3,597
- Reserves months
- —
- Total cash needed
- —
Loan-product check · same deal, 3 products live
Conventional
25% down · 7.5% · 30yr
- Down + closing
- —
- Monthly P&I
- —
- Monthly cashflow
- —
- DSCR
- —
- Eligible?
- —
Personal DTI + credit; lowest rate.
DSCR
20% down · 8.5% · 30yr
- Down + closing
- —
- Monthly P&I
- —
- Monthly cashflow
- —
- DSCR
- —
- Eligible?
- —
No personal income docs; deal must DSCR.
Hard money
10% down · 12.0% · 12mo
- Down + closing
- —
- Monthly P&I
- —
- Monthly cashflow
- —
- DSCR
- —
- Eligible?
- —
Short-term bridge; refi at stabilization.
Rent comps 40 comps
| Address | Beds | Baths | Sqft | Rent | $/sqft | DOM | Units | Dist |
|---|---|---|---|---|---|---|---|---|
| 3121 Baltimore Ave Indianapolis, IN | 3.0 | 1.0 | 1232 | $7,865 | $6.38 | 7d | 1 | 0.38mi |
| 3736 Kinnear Ave Indianapolis, IN | 3.0 | 2.0 | 2180 | $1,450 | $0.67 | 43d | 1 | 0.44mi |
| 2221 E 38th St Indianapolis, IN | 2.0 | 1.0 | 1728 | $999 | $0.58 | 14d | 1 | 0.56mi |
| 3476 Birchwood Ave Indianapolis, IN | 3.0 | 1.5 | 1420 | $1,625 | $1.14 | 23d | 1 | 0.60mi |
| 3541 Birchwood Ave Indianapolis, IN | 3.0 | 1.0 | 1400 | $1,549 | $1.11 | 11d | 1 | 0.61mi |
| 3208 Guilford Ave Indianapolis, IN | 3.0 | 3.0 | 1800 | $1,700 | $0.94 | 12d | 1 | 0.66mi |
| 3509 Guilford Ave Indianapolis, IN | 3.0 | 1.5 | 1351 | $1,445 | $1.07 | 14d | 1 | 0.71mi |
| 3110 Guilford Ave Indianapolis, IN | 3.0 | 1.5 | 1250 | $1,295 | $1.04 | 23d | 1 | 0.72mi |
| 728 E 34th St Indianapolis, IN | 3.0 | 1.0 | 1491 | $1,400 | $0.94 | 19d | 1 | 0.79mi |
| 728 E 34th St Indianapolis, IN | 3.0 | 1.0 | 1491 | $1,400 | $0.94 | 4d | 1 | 0.79mi |
| 3359 N College Ave Indianapolis, IN | 2.0 | 1.5 | 1450 | $1,795 | $1.24 | 10d | 1 | 0.83mi |
| 2757 Columbia Ave Unit 2757-B Indianapolis, IN | 3.0 | 2.0 | 1350 | $1,525 | $1.13 | 43d | 1 | 0.86mi |
| 3370 N College Ave Indianapolis, IN | 3.0 | 1.0 | 1680 | $1,275 | $0.76 | 1d | 1 | 0.87mi |
| 3365 Broadway St Indianapolis, IN | 3.0 | 2.0 | 1300 | $1,700 | $1.31 | 43d | 1 | 0.90mi |
| 3106 N College Ave Indianapolis, IN | 3.0 | 1.5 | 1400 | $1,700 | $1.21 | 7d | 1 | 0.95mi |
| 2553 Columbia Ave Unit 2553-B Indianapolis, IN | 3.0 | 2.0 | 1350 | $1,525 | $1.13 | 43d | 1 | 0.99mi |
| 2751 Guilford Ave Unit Aunit Indianapolis, IN | 3.0 | 2.0 | 1250 | $1,750 | $1.40 | 43d | 1 | 1.01mi |
| 2751 Guilford Ave Unit B Indianapolis, IN | 3.0 | 2.0 | 1250 | $1,750 | $1.40 | 13d | 1 | 1.01mi |
| 3141 N Park Ave Indianapolis, IN | 3.0 | 1.0 | 1390 | $1,000 | $0.72 | 43d | 1 | 1.01mi |
| 3851 Broadway St Indianapolis, IN | 3.0 | 1.0 | 1513 | $1,950 | $1.29 | 17d | 1 | 1.07mi |
| 2711 Guilford Ave Indianapolis, IN | 3.0 | 2.0 | 1250 | $1,695 | $1.36 | 23d | 1 | 1.08mi |
| 2960 N Park Ave Indianapolis, IN | 3.0 | 1.5 | 1400 | $1,550 | $1.11 | 23d | 1 | 1.12mi |
| 2960 N Park Ave Indianapolis, IN | 3.0 | 2.0 | 1400 | $1,595 | $1.14 | 43d | 1 | 1.12mi |
| 2958 N Park Ave Unit 2958 Indianapolis, IN | 3.0 | 1.5 | 1350 | $1,450 | $1.07 | 2d | 1 | 1.12mi |
| 4301 Crittenden Ave Indianapolis, IN | 2.0 | 1.0 | 1376 | $1,350 | $0.98 | 43d | 1 | 1.17mi |
| 4040 N College Ave Indianapolis, IN | 3.0 | 1.5 | 1280 | $1,900 | $1.48 | 7d | 1 | 1.18mi |
| 2707 N College Ave Indianapolis, IN | 3.0 | 2.0 | 1500 | $2,200 | $1.47 | 17d | 1 | 1.18mi |
| 2709 N College Ave Indianapolis, IN | 3.0 | 2.0 | 1500 | $2,200 | $1.47 | 23d | 1 | 1.18mi |
| 2950 Ruckle St Indianapolis, IN | 3.0 | 1.0 | 1450 | $1,300 | $0.90 | 43d | 1 | 1.19mi |
| 4071 N College Ave Indianapolis, IN | 2.0 | 2.5 | 2000 | $2,200 | $1.10 | 4d | 1 | 1.19mi |
| 717 E 27th St Indianapolis, IN | 1.0 | 1.5 | 1322 | $2,600 | $1.97 | 43d | 1 | 1.19mi |
| 2830 Lasalle St Unit 28 Indianapolis, IN | 2.0 | 1.0 | 1400 | $1,100 | $0.79 | 43d | 1 | 1.19mi |
| 4073 N College Ave Indianapolis, IN | 2.0 | 2.5 | 2000 | $2,500 | $1.25 | 43d | 1 | 1.19mi |
| 2830 N Park Ave Indianapolis, IN | 2.0 | 3.0 | 1500 | $1,600 | $1.07 | 43d | 1 | 1.20mi |
| 2920 Ruckle St Indianapolis, IN | 3.0 | 1.5 | 1272 | $1,700 | $1.34 | 7d | 1 | 1.22mi |
| 321 E 31st St Indianapolis, IN | 3.0 | 1.0 | 1390 | $1,400 | $1.01 | 43d | 1 | 1.26mi |
| 3554 Washington Blvd Indianapolis, IN | 1.0 | 1.0 | 1714 | $750 | $0.44 | 23d | 1 | 1.27mi |
| 2340 Columbia Ave Unit 2340-B Indianapolis, IN | 3.0 | 2.0 | 1350 | $1,650 | $1.22 | 43d | 1 | 1.27mi |
| 2519 N College Ave Unit 1 Indianapolis, IN | 3.0 | 2.5 | 1416 | $1,850 | $1.31 | 43d | 1 | 1.29mi |
| 4022 Central Ave Indianapolis, IN | 3.0 | 1.0 | 1288 | $1,500 | $1.16 | 21d | 1 | 1.37mi |
Listing history 45 events
-
2026-06-18days on market $119,900 Active 269 DOM
-
2026-06-17days on market $119,900 Active 268 DOM
-
2026-06-16days on market $119,900 Active 267 DOM
-
2026-06-15days on market $119,900 Active 266 DOM
-
2026-06-13days on market $119,900 Active 264 DOM
-
2026-06-13days on market $119,900 Active 263 DOM
-
2026-06-09days on market $119,900 Active 260 DOM
-
2026-06-08days on market $119,900 Active 259 DOM
-
2026-06-07days on market $119,900 Active 258 DOM
-
2026-06-03pricedays on market $119,900 Active 254 DOM
-
2026-06-02days on market $124,900 Active 253 DOM
-
2026-06-01days on market $124,900 Active 252 DOM
-
2026-05-31days on market $124,900 Active 251 DOM
-
2026-05-01price $124,900 738-char remark
Show marketing remark (738 chars)
Potential investment property or house hack. This single family home has been converted into a front and back duplex. The front unit is comprised of 2 bedrooms, family room, kitchen/utility room, and full bathroom. The rear unit has 3 bedrooms, large family room, kitchen, full bathroom, and utility room. Property is in need of repairs. Roof looks newer and some vinyl windows also appear newer. Convert this back to a single family residence, or refresh both units and keep as a cash flowing double. Multiple options for an investor looking to add another property to their existing portfolio. Only cash offers will be considered, no wholesalers, assignments of contract, or seller financing. Sight unseen offers will not be considered.
-
2026-03-31price $129,900 738-char remark
Show marketing remark (738 chars)
Potential investment property or house hack. This single family home has been converted into a front and back duplex. The front unit is comprised of 2 bedrooms, family room, kitchen/utility room, and full bathroom. The rear unit has 3 bedrooms, large family room, kitchen, full bathroom, and utility room. Property is in need of repairs. Roof looks newer and some vinyl windows also appear newer. Convert this back to a single family residence, or refresh both units and keep as a cash flowing double. Multiple options for an investor looking to add another property to their existing portfolio. Only cash offers will be considered, no wholesalers, assignments of contract, or seller financing. Sight unseen offers will not be considered.
-
2026-02-12price $134,900 738-char remark
Show marketing remark (738 chars)
Potential investment property or house hack. This single family home has been converted into a front and back duplex. The front unit is comprised of 2 bedrooms, family room, kitchen/utility room, and full bathroom. The rear unit has 3 bedrooms, large family room, kitchen, full bathroom, and utility room. Property is in need of repairs. Roof looks newer and some vinyl windows also appear newer. Convert this back to a single family residence, or refresh both units and keep as a cash flowing double. Multiple options for an investor looking to add another property to their existing portfolio. Only cash offers will be considered, no wholesalers, assignments of contract, or seller financing. Sight unseen offers will not be considered.
-
2026-01-05price $139,900 738-char remark
Show marketing remark (738 chars)
Potential investment property or house hack. This single family home has been converted into a front and back duplex. The front unit is comprised of 2 bedrooms, family room, kitchen/utility room, and full bathroom. The rear unit has 3 bedrooms, large family room, kitchen, full bathroom, and utility room. Property is in need of repairs. Roof looks newer and some vinyl windows also appear newer. Convert this back to a single family residence, or refresh both units and keep as a cash flowing double. Multiple options for an investor looking to add another property to their existing portfolio. Only cash offers will be considered, no wholesalers, assignments of contract, or seller financing. Sight unseen offers will not be considered.
-
2025-12-01price $144,900 738-char remark
Show marketing remark (738 chars)
Potential investment property or house hack. This single family home has been converted into a front and back duplex. The front unit is comprised of 2 bedrooms, family room, kitchen/utility room, and full bathroom. The rear unit has 3 bedrooms, large family room, kitchen, full bathroom, and utility room. Property is in need of repairs. Roof looks newer and some vinyl windows also appear newer. Convert this back to a single family residence, or refresh both units and keep as a cash flowing double. Multiple options for an investor looking to add another property to their existing portfolio. Only cash offers will be considered, no wholesalers, assignments of contract, or seller financing. Sight unseen offers will not be considered.
-
2025-10-28price $147,400 738-char remark
Show marketing remark (738 chars)
Potential investment property or house hack. This single family home has been converted into a front and back duplex. The front unit is comprised of 2 bedrooms, family room, kitchen/utility room, and full bathroom. The rear unit has 3 bedrooms, large family room, kitchen, full bathroom, and utility room. Property is in need of repairs. Roof looks newer and some vinyl windows also appear newer. Convert this back to a single family residence, or refresh both units and keep as a cash flowing double. Multiple options for an investor looking to add another property to their existing portfolio. Only cash offers will be considered, no wholesalers, assignments of contract, or seller financing. Sight unseen offers will not be considered.
-
2025-09-22$149,900 Active 738-char remark
Show marketing remark (738 chars)
Potential investment property or house hack. This single family home has been converted into a front and back duplex. The front unit is comprised of 2 bedrooms, family room, kitchen/utility room, and full bathroom. The rear unit has 3 bedrooms, large family room, kitchen, full bathroom, and utility room. Property is in need of repairs. Roof looks newer and some vinyl windows also appear newer. Convert this back to a single family residence, or refresh both units and keep as a cash flowing double. Multiple options for an investor looking to add another property to their existing portfolio. Only cash offers will be considered, no wholesalers, assignments of contract, or seller financing. Sight unseen offers will not be considered.
-
2023-02-20historical
-
2023-01-26status Active
-
2022-12-05status Pending
-
2022-08-23$159,900 Active
-
2022-06-10soldstatus $80,000 Closed
-
2022-05-23status Pending
-
2022-05-19$85,000 Active
-
2022-03-19status Active
-
2021-12-18status Pending
-
2021-11-23status Active
-
2021-11-16status Pending
-
2021-11-08price $99,000
-
2021-11-08status Active
-
2021-10-29status Pending
-
2021-10-21$120,000 Active
-
2008-07-29soldstatus $10,000
-
2008-05-12$11,150
-
2004-07-07soldstatus $13,086
-
2004-05-27$12,900
-
2004-04-26historical
-
2004-04-26historical
-
2004-03-17$14,000
-
2004-03-15historical
-
2004-03-04$16,000
-
2003-12-02$16,500
ⓘ Source: listings_history table (triggers on properties + properties_extension) + one-shot
backfill from property_details.listing_events for pre-trigger history.
Tax reassessment forecast IN · Partial reset (capped growth)
- Current annual tax
- $2,712 · $226/mo
- Projected year-2 tax
- $2,712 · $226/mo
- Expected delta
- $0/yr ($0/mo · 0.0%)
ⓘ Screening estimate from a state-policy table — verify with the county assessor before closing.
Climate risk First Street
- Flood 1/10 Low FEMA zone X (unshaded) · 0% chance over 30 yrs
- Wildfire 1/10 Low
- Heat 4/10 Moderate 7 d/yr ≥102°F today · 18 d/yr by 30 yrs out
- Wind 2/10 Low 100% chance of damaging wind over 30 yrs
- Air quality 4/10 Moderate 5 unhealthy d/yr today · 7 by 30 yrs out
Nearby sold comps map
Loading sold comps map…
Walkable amenities ~0.75 mi
Loading nearby amenities…
Taxation est. · year 1
- Rental income
- $18,002
- − Mortgage interest
- −$6,716
- − Property taxes
- −$2,712
- − Insurance
- −$600
- − Repairs & maintenance
- −$1,440
- − Management
- −$1,440
- − Depreciation
- −$3,488
- Taxable income
- $1,605
- Est. tax owed @ 24.0%
- −$385
- After-tax cash flow
- $2,979/yr
For passive investors: Depreciation is non-cash, so a rental often shows a tax loss while cash-flowing — sheltering income. Rental losses are passive: they offset passive income freely, and up to $25,000/yr can offset ordinary (W-2) income if you actively participate and your MAGI is under $100k (phasing out to $0 by $150k); unused losses carry forward. On sale, claimed depreciation is recaptured at up to 25%, and gains may owe capital-gains tax (a 1031 exchange can defer both). Figures are a year-1 estimate at your 24.0% rate — not tax advice; consult a CPA.
Schools (NCES district)
- District
- Indianapolis Public Schools
- NCES district ID
- 1804770
- Math proficiency
- 14% ▼ -7.00%
- Reading proficiency
- 20% ▼ -3.00%
- Median HH income
- $32,034
- Composite
- 13.69/100
- National rank
- #9499
- State rank
- #286 of 301 in IN
Livability — Indianapolis city (balance)
No livability data for this city. (Only ~50 U.S. cities are tracked.)
Census & demographics
- Census place
- Indianapolis city (balance), IN
- County
- Marion County · 998,460 people
- City population
- 881,119
- Metro
- Indianapolis-Carmel-Anderson, IN
- Population (ZIP)
- 29,360
- Household income
- $38,063
- Rent vs Own
- Severe rent burden
- 2340.0
Population outlook (Marion County) Hauer SSP2
- Today (2025)
- 1,025,572 people
- By 2030
- 1,065,727 · +3.9%
- By 2040
- 1,141,577 · +11.3%
- By 2050
- 1,208,920 · +17.9%
- By 2075
- 1,367,288 · +33.3%
- By 2100
- 1,438,201 · +40.2%
Race, ethnicity, and origin ACS 2023
- Neighborhood character
- Predominantly Black (68%)
- Race & ethnicity
- Black 68% White 18% Hispanic / Latino 9% Two or more races 6%
- Hispanic origin (detail)
- Mexican 6%
- Common ancestry
- Romanian 1%
- Foreign-born
- 5% · Canada, Philippines
- Languages at home
- 92% English-only · Spanish 7%
Political lean MEDSL · Marion
- 2024 margin
- Strong D (+27.7) · D 63.0% · R 35.3% · Other 1.7%
- 2008→2024 swing
- -0.7pp no change · 2008: 28.4pp · 2024: 27.7pp
- All cycles
- 2024: D+27.7 2020: D+29.1 2016: D+22.8 2012: D+22.2 2008: D+28.4
Not yet ingested
- Civics
- —
Market trends
- HPI YoY
- ▼ -81.57%
- Current HPI
- 395.7071
- Rent YoY
- ▲ 0.81%
- Metro
- Indianapolis-Carmel-Anderson, IN
- State GDP YoY
- ▲ 2.90%
- F500 in state
- 18
Industry mix (Fortune 500 HQ in IN)
| Industry | F500 HQs | Revenue |
|---|---|---|
| Industrial Machinery | 2 | $37B |
|
||
| Healthcare | 1 | $177B |
|
||
| Pharmaceuticals | 1 | $45B |
|
||
| Metals / Steel | 1 | $18B |
|
||
| Agriculture | 1 | $17B |
|
||
| Packaging | 1 | $12B |
|
||
Price history
+657.0% since first listed32 events — show timeline
- 2026-05-01 Price Changed $124,900 MIBOR as Distributed by MLS Grid
- 2026-03-31 Price Changed $129,900 MIBOR as Distributed by MLS Grid
- 2026-02-12 Price Changed $134,900 MIBOR as Distributed by MLS Grid
- 2026-01-05 Price Changed $139,900 MIBOR as Distributed by MLS Grid
- 2025-12-01 Price Changed $144,900 MIBOR as Distributed by MLS Grid
- 2025-10-28 Price Changed $147,400 MIBOR as Distributed by MLS Grid
- 2025-09-22 Listed $149,900 MIBOR as Distributed by MLS Grid
- 2023-02-20 Listing Removed — MIBOR as Distributed by MLS Grid
- 2023-01-26 Relisted — MIBOR as Distributed by MLS Grid
- 2022-12-05 Pending — MIBOR as Distributed by MLS Grid
- 2022-08-23 Listed $159,900 MIBOR as Distributed by MLS Grid
- 2022-06-10 Sold (MLS) $80,000 MIBOR as Distributed by MLS Grid
- 2022-05-23 Pending — MIBOR as Distributed by MLS Grid
- 2022-05-19 Listed $85,000 MIBOR as Distributed by MLS Grid
- 2022-03-19 Relisted — MIBOR as Distributed by MLS Grid
- 2021-12-18 Pending — MIBOR as Distributed by MLS Grid
- 2021-11-23 Relisted — MIBOR as Distributed by MLS Grid
- 2021-11-16 Pending — MIBOR as Distributed by MLS Grid
- 2021-11-08 Price Changed $99,000 MIBOR as Distributed by MLS Grid
- 2021-11-08 Relisted — MIBOR as Distributed by MLS Grid
- 2021-10-29 Pending — MIBOR as Distributed by MLS Grid
- 2021-10-21 Listed $120,000 MIBOR as Distributed by MLS Grid
- 2008-07-29 Sold (MLS) $10,000 MIBOR as Distributed by MLS Grid
- 2008-05-12 Listed $11,150 MIBOR as Distributed by MLS Grid
- 2004-07-07 Sold (MLS) $13,086 MIBOR as Distributed by MLS Grid
- 2004-05-27 Listed $12,900 MIBOR as Distributed by MLS Grid
- 2004-04-26 Listing Removed — MIBOR as Distributed by MLS Grid
- 2004-04-26 Listing Removed — MIBOR as Distributed by MLS Grid
- 2004-03-17 Listed $14,000 MIBOR as Distributed by MLS Grid
- 2004-03-15 Listing Removed — MIBOR as Distributed by MLS Grid
- 2004-03-04 Listed $16,000 MIBOR as Distributed by MLS Grid
- 2003-12-02 Listed $16,500 MIBOR as Distributed by MLS Grid
Property tax history
+31.0%/yrLatest (2025): $2,712 · +20.9% YoY. Source: county tax records.
Cash-flow waterfall
monthlySold comps — $/sqft
last 12 mo · ≤1 miLoading sold comps…