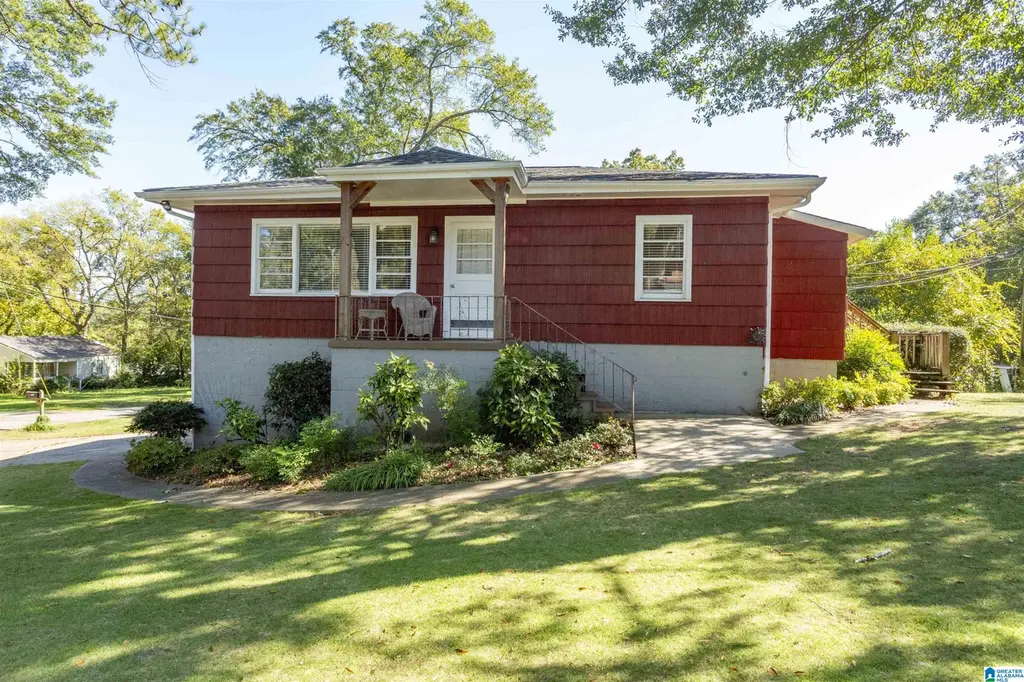
1817 1/2 29th Ave · Hueytown, AL
Flood risk 1/10 · Minimal
- FEMA flood zone
- X (unshaded)
- Chance of flooding over 30 yrs
- 0.0%
- Est. flood insurance / yr
- $507 – $1,088
Fire risk 3/10 · Minor
- Est. fire insurance / yr
- $916 – $1,700
Heat risk 6/10 · Moderate
- Hot days now (above 109°F)
- 7 days/yr
- Hot days in 30 yrs
- 19 days/yr
Wind risk 6/10 · Moderate
- Chance of severe wind over 30 yrs
- 44.0%
Air-quality risk 3/10 · Minor
- Unhealthy air days now
- 2 days/yr
- Unhealthy air days in 30 yrs
- 5 days/yr
Risk factors via First Street. Map © Google.
Why this score? — see what drove the B grade
The composite is a weighted blend of 9 inputs, each scored 0–100. Each bar is that input's sub-score; the figure is the points it added to the 100-point composite (weight × sub-score).
- Cash flow +30.0/30.0
- 1% rule +10.0/10.0
- DSCR +10.0/10.0
- ARV discount +7.5/15.0
- Appreciation +4.7/10.0
- Rent growth +2.9/5.0
- Livability +2.9/5.0
- Condition / age +2.5/5.0
- Schools +1.8/10.0
$60,000
🖨 Deal sheet 📄 Offer letter ✓ Due diligence
Listing remarks MLS
Discover timeless elegance in this stunning two-story brick home offering over 3,000 sq. ft. of historic charm paired with modern comforts. This spacious 4-bedroom, 2-bath residence welcomes you with beautifully preserved original hardwood floors, classic architectural details, and generous room sizes throughout. The thoughtfully updated kitchen features contemporary finishes and ample workspace, while both bathrooms have been tastefully renovated to blend style and functionality. A full basement provides excellent storage, hobby space, or potential for future expansion. Warm, inviting, and rich with character, this exceptional property brings together the best of old-world craftsmanship and modern living—perfect for those seeking a truly special place to call home.
Key facts
- 4,791 sq ft lot
- 2 garage spots
- Built 1958
Property features AI
Finance
- Financial info: Quarterly garbage fee ($70)
Exterior
- Parking: Side entry; Basement parking plus driveway parking; Two total garage spaces (both in basement)
- Utilities: Public water; Connected sewer; Gas water heater; Internet service available
- Home design: Existing single-family property; Main-level living, kitchen, laundry, and bedrooms
- Construction: Concrete block construction with shingle roof; Basement foundation
- Exterior features: No pool, patio, deck, or garden/patio; Not waterfront; Located on a 0.11-acre lot; Not in flood plain
Interior
- Kitchen: Laminate countertops; Electric oven
- Bedrooms: Two bedrooms on main level
- Flooring: Hardwood; Vinyl
- Bathrooms: One full bathroom with tub/shower combo
- Heating & cooling: Gas heating; Electric cooling
- Interior features: Hardwood and vinyl floors; Ceilings: other (see remarks); Full unfinished basement (concrete block)
- Laundry & utility: Main-level laundry room; Washer hookup and electric dryer hookup
Neighborhood map
What this means for you Summary
Snapshot
- This is a 3-bed/2.0-bath single-family listed at $60k.
Deal economics
- At list price, monthly cash flow is $693 ($8k/yr) — positive.
- The deal already cash-flows at list — no discount required.
- Meets the 1% rule at list price ($1k rent vs $60k).
- Cap rate 20.2% vs local median 5.9% in Hueytown — top-decile yield for the area; either an underpriced asset or a hidden risk that comps aren't pricing in. Stress-test before assuming the spread holds.
Location & tenants
- Location reads 57/100 on livability (#378 in AL) — a working-class tenant base; expect higher turnover. Strengths: cost of living A+, housing A+; Watch: employment D, crime F, amenities F.
- Jefferson County (suburban): math 9% / reading 32% proficiency, ranked #104 of 129 in AL (top 81%) — low school quality limits family demand, transient renter base, plan for 1-2y turnover.
- Zoned schools: Hueytown Primary School (653 students, 64% FRL); Hueytown High School (math 7% / reading 20%, grade F, #235 of 305 statewide, top 77%, 1,210 students, 79% FRL) — zoned schools average 72% FRL vs 49% district-wide (23 pts higher); higher-poverty schools than district average — tighter screening recommended.
- Market conditions: Rents rising (+1.6%/yr); 250 active listings in the ZIP; 19 comparable units currently listed for rent nearby; rentals at typical pace (median 15d on market — plan ~3-4 weeks tenant-placement turnaround); 2,114 units permitted in Jefferson County in 2024 (556 in 5+ unit buildings).
Forward outlook
- In year one you build about $55 of equity ($415 loan paydown + $-360 appreciation (-0.6% local appreciation)).
- Jefferson County population projected to shrink 4% by 2050 — rents likely to lag national; underwrite the cash flow, not the appreciation.
- At projected returns (-0.6% appreciation + 1.6% rent growth), your $17k cash investment doubles in ~2 years — after that, you're playing with house money.
Negotiation context
- Only 2 days on market — expect competitive offers; lowballing is unlikely to land.
- 2 sale attempts with the ask held roughly flat each time — persistent listings suggest the price (not the market) is what's stuck; bring a comps-based counter.
Risks & watch-outs
- Watch-outs: built in 1958 — expect roof / HVAC / electrical / plumbing capex.
- Climate carrying-cost: major wind risk, 44% chance of damaging wind over 30y; extreme-heat days projected 7→19/yr by 2055 (HVAC capex compounding) — expect insurance premiums to compound above CPI over the hold.
Questions for the listing agent
- Built in 1958 — when were the roof, HVAC, electrical panel, plumbing, and water heater last replaced?
- Is there a deadline driving the sale (1031 exchange, divorce, estate, relocation)? That informs how much negotiation room exists.
- Schools are F-rated, which usually means shorter tenancies and higher turnover. Who's the typical renter profile here, and what's been the actual vacancy rate?
- Crime grade is F in this area — have there been break-ins, vandalism, or insurance claims at this property in the last 3 years? What carrier currently insures it and at what premium?
- What's the average days-on-market for RENTAL listings here right now (not sales)? A rising rental-DOM trend means longer vacancies and softer asking-rent achievability than the comps imply.
- What's the recent tenant-quality profile in this submarket — average credit score on applications, eviction rate, late-payment / NSF rate, and stable-employment percentage? A property-management company in the area should have these aggregated.
- How much new for-sale + rental construction is in the pipeline within 1–3 miles? Heavy new supply typically softens prices + rents 12–24 months out; constrained supply supports both.
Investment metrics
- 1% rule
- 2.43% ✓
- Cap rate
- 20.15%
- Cash-on-cash
- 49.50%
- DSCR
- 3.20
- GRM
- 3.4
CMA / ARV
- ARV (on-the-fly)
- $193,401
- Comps found
- 12
Show comp detail 12 sales within ~0.75 mi
| Address | Dist | Beds/Ba | Sqft | Sold | Price | $/sf | Match |
|---|---|---|---|---|---|---|---|
| 2805 20th St | 0.24mi | 3/1.0 | 1,530 (-7%) | 3mo | $80,000 | $52 | 70 |
| 1733 Faircrest Dr | 0.32mi | 3/2.0 | 1,528 (-8%) | 4mo | $110,000 | $72 | 69 |
| 1605 27th Ave N | 0.32mi | 4/2.0 (+1) | 1,532 (-7%) | 1mo | $175,000 | $114 | 68 |
| 3034 Devon Rd | 0.22mi | 3/2.0 | 1,862 (+13%) | 2mo | $195,000 | $105 | 67 |
| 3353 Crescent Dr | 0.62mi | 3/2.0 | 1,700 (+3%) | 4mo | $215,000 | $126 | 63 |
| 1220 26th Ave N | 0.66mi | 4/2.0 (+1) | 1,665 (+1%) | 2mo | $195,000 | $117 | 61 |
| 3056 Shady Ln | 0.47mi | 3/1.0 | 1,500 (-9%) | 1mo | $92,500 | $62 | 58 |
| 2707 Novel Dr | 0.61mi | 3/2.0 | 1,750 (+6%) | 7mo | $235,000 | $134 | 56 |
| 2731 Novel Dr | 0.67mi | 3/1.5 | 1,736 (+5%) | 8mo | $194,900 | $112 | 52 |
| 2807 Cope Ln | 0.75mi | 3/2.5 | 1,592 (-4%) | 6mo | $215,000 | $135 | 52 |
| 2700 Daffodil Ave | 0.74mi | 4/1.5 (+1) | 1,525 (-8%) | 4mo | $190,000 | $125 | 42 |
| 2901 Teresa Ave | 0.69mi | 4/2.0 (+1) | 1,872 (+13%) | 2mo | $225,000 | $120 | 39 |
Match score weights: distance 35% · size 25% · config 20% · recency 20%. Top-matched comps best support the ARV.
Projected returns pro-forma
-0.6% appreciation · 1.6% rent growth · sell at horizon
- IRR
- 48.7%
- Equity multiple
- 3.31×
- Total profit
- $38,731
- Equity at exit
- $15,644
- IRR
- 51.3%
- Equity multiple
- 6.28×
- Total profit
- $88,705
- Equity at exit
- $17,438
Cash invested: $16,800 (down + closing). Projections, not guarantees.
Landlord ↔ Tenant lean methodology
- Overall (STATE)
- 90 Strongly Landlord-Friendly
- State Alabama
- 90 Strongly Landlord-Friendly · R+15
- County
- — inherits STATE
- City
- — inherits STATE
ZIP-level market 35023
- Home prices YoY
- -0.1%
- Rents YoY
- 1.6%
- Active inventory
- 250
- Price-to-rent
- 3.4×
Monthly cashflow live
- Estimated rent
- $1,460 high interval (Pro) →
- Mortgage (P&I)
- −$315
- Tax from tax record
- −$120 /mo · $1,446/yr
- Insurance
- −$25
- HOA
- −$0
- Vacancy / Maint / Mgmt
- −$307
- Net cashflow
- $693
Break-even live
UW: 25.0% down · 7.5% · 30yr · 1.5% tax · 5.0% vac · 8.0% maint · 8.0% mgmt
Financing live
Cash to close
- Down payment
- $15,000
- Closing costs
- $1,800
- Reserves months
- —
- Total cash needed
- —
Loan-product check · same deal, 3 products live
Conventional
25% down · 7.5% · 30yr
- Down + closing
- —
- Monthly P&I
- —
- Monthly cashflow
- —
- DSCR
- —
- Eligible?
- —
Personal DTI + credit; lowest rate.
DSCR
20% down · 8.5% · 30yr
- Down + closing
- —
- Monthly P&I
- —
- Monthly cashflow
- —
- DSCR
- —
- Eligible?
- —
No personal income docs; deal must DSCR.
Hard money
10% down · 12.0% · 12mo
- Down + closing
- —
- Monthly P&I
- —
- Monthly cashflow
- —
- DSCR
- —
- Eligible?
- —
Short-term bridge; refi at stabilization.
Rent comps 19 comps
| Address | Beds | Baths | Sqft | Rent | $/sqft | DOM | Units | Dist |
|---|---|---|---|---|---|---|---|---|
| 2825 19th St N Bessemer, AL | 3.0 | 1.5 | 1991 | $1,395 | $0.70 | 43d | 1 | 0.13mi |
| 2109 29th Ave N Bessemer, AL | 4.0 | 2.0 | 1217 | $1,323 | $1.09 | 2d | 1 | 0.37mi |
| 3201 Circle Dr Bessemer, AL | 3.0 | 2.0 | 1531 | $1,750 | $1.14 | 1d | 1 | 0.39mi |
| 116 Avalon Ave Bessemer, AL | 4.0 | 1.0 | 1207 | $1,200 | $0.99 | 43d | 1 | 0.57mi |
| 2234 19th St N Bessemer, AL | 2.0 | 1.0 | 1106 | $975 | $0.88 | 43d | 1 | 0.62mi |
| 1036 Rose Hill Cir Bessemer, AL | 3.0 | 2.0 | 1277 | $1,300 | $1.02 | 21d | 1 | 0.79mi |
| 2832 Clyburne St Bessemer, AL | 3.0 | 2.0 | 1295 | $1,650 | $1.27 | 1d | 1 | 0.80mi |
| 1032 26th Ave N Bessemer, AL | 3.0 | 1.0 | 1724 | $1,175 | $0.68 | 2d | 1 | 0.97mi |
| 1929 15th St N Bessemer, AL | 3.0 | 2.0 | 1140 | $1,250 | $1.10 | 19d | 1 | 0.99mi |
| 216 Meadowood Ave Bessemer, AL | 3.0 | 1.0 | 1430 | $1,250 | $0.87 | 2d | 1 | 1.00mi |
| 428 Willow Ln Bessemer, AL | 4.0 | 2.0 | 1375 | $1,620 | $1.18 | 14d | 1 | 1.03mi |
| 1013 25th Ave N Bessemer, AL | 3.0 | 2.0 | 1144 | $1,546 | $1.35 | 15d | 1 | 1.03mi |
| 2129 13th St N Bessemer, AL | 4.0 | 1.0 | 1378 | $1,445 | $1.05 | 14d | 1 | 1.11mi |
| 309 Sunrise Blvd Bessemer, AL | 2.0 | 1.0 | 1105 | $1,160 | $1.05 | 11d | 1 | 1.14mi |
| 905 26th Ave N Bessemer, AL | 4.0 | 2.0 | 1218 | $1,200 | $0.99 | 1d | 1 | 1.15mi |
| 2028 13th St N Bessemer, AL | 3.0 | 2.0 | 1372 | $1,073 | $0.78 | 23d | 1 | 1.17mi |
| 208 Kentwood Ave Bessemer, AL | 3.0 | 1.0 | 1177 | $1,075 | $0.91 | 43d | 1 | 1.17mi |
| 3447 Jeanne Ln Bessemer, AL | 3.0 | 2.0 | 1460 | $1,850 | $1.27 | 1d | 1 | 1.17mi |
| 531 Tinker St Bessemer, AL | 3.0 | 2.0 | 1766 | $2,450 | $1.39 | 10d | 1 | 1.21mi |
Listing history 3 events
-
2026-06-07statusdays on market $60,000 Pending 2 DOM
-
2026-06-03remarks 42-char remark
-
2026-06-03$60,000 Active 1 DOM
ⓘ Source: listings_history table (triggers on properties + properties_extension) + one-shot
backfill from property_details.listing_events for pre-trigger history.
Tax reassessment forecast AL · Resets to sale price
- Current annual tax
- $1,446 · $120/mo
- Projected year-2 tax
- $1,446 · $120/mo
- Expected delta
- $0/yr ($0/mo · 0.0%)
ⓘ Screening estimate from a state-policy table — verify with the county assessor before closing.
Climate risk First Street
- Flood 1/10 Low FEMA zone X (unshaded) · 0% chance over 30 yrs
- Wildfire 3/10 Moderate
- Heat 6/10 Major 7 d/yr ≥109°F today · 19 d/yr by 30 yrs out
- Wind 6/10 Major 44% chance of damaging wind over 30 yrs
- Air quality 3/10 Moderate 2 unhealthy d/yr today · 5 by 30 yrs out
Nearby sold comps map
Loading sold comps map…
Walkable amenities ~0.75 mi
Loading nearby amenities…
Taxation est. · year 1
- Rental income
- $17,516
- − Mortgage interest
- −$3,361
- − Property taxes
- −$1,446
- − Insurance
- −$300
- − Repairs & maintenance
- −$1,401
- − Management
- −$1,401
- − Depreciation
- −$1,745
- Taxable income
- $7,861
- Est. tax owed @ 24.0%
- −$1,887
- After-tax cash flow
- $6,429/yr
For passive investors: Depreciation is non-cash, so a rental often shows a tax loss while cash-flowing — sheltering income. Rental losses are passive: they offset passive income freely, and up to $25,000/yr can offset ordinary (W-2) income if you actively participate and your MAGI is under $100k (phasing out to $0 by $150k); unused losses carry forward. On sale, claimed depreciation is recaptured at up to 25%, and gains may owe capital-gains tax (a 1031 exchange can defer both). Figures are a year-1 estimate at your 24.0% rate — not tax advice; consult a CPA.
Schools (NCES district)
- District
- Jefferson County
- NCES district ID
- 0101920
- Math proficiency
- 9% ▼ -24.00%
- Reading proficiency
- 32% ▼ -5.00%
- Median HH income
- $51,712
- Composite
- 18.4/100
- National rank
- #8937
- State rank
- #104 of 129 in AL
Livability — Hueytown
- Score
- 57/100
- State rank
- #378
- US rank
- #21611
Category grades
Schools grade is shown separately in the Schools card above.
Census & demographics
- Census place
- Hueytown, AL
- County
- Jefferson County · 527,445 people
- Metro
- Birmingham-Hoover, AL
- Population (ZIP)
- 25,533
- Household income
- $69,863
- Rent vs Own
- Severe rent burden
- 247.0
Population outlook (Jefferson County) Hauer SSP2
- Today (2025)
- 669,185 people
- By 2030
- 669,694 · +0.1%
- By 2040
- 661,388 · -1.2%
- By 2050
- 643,086 · -3.9%
- By 2075
- 577,267 · -13.7%
- By 2100
- 474,758 · -29.1%
Race, ethnicity, and origin ACS 2023
- Neighborhood character
- Diverse neighborhood (Simpson 0.56)
- Race & ethnicity
- White 58% Black 30% Hispanic / Latino 7% Two or more races 3%
- Hispanic origin (detail)
- Mexican 5%
- Common ancestry
- Slovak 1% Lithuanian 1% Serbian 1%
- Foreign-born
- 4% · Canada
- Languages at home
- 93% English-only · Spanish 7%
Political lean MEDSL · Jefferson
- 2024 margin
- D (+10.4) · D 54.6% · R 44.2% · Other 1.2%
- 2008→2024 swing
- +5.4pp toward D · 2008: 5.1pp · 2024: 10.4pp
- All cycles
- 2024: D+10.4 2020: D+13.2 2016: D+7.2 2012: D+6.0 2008: D+5.1
Not yet ingested
- Civics
- —
Market trends
- HPI YoY
- ▼ -0.60%
- Current HPI
- 389.38
- Rent YoY
- ▲ 1.60%
- Metro
- Birmingham-Hoover, AL
- State GDP YoY
- ▲ 2.94%
- F500 in state
- 4
Industry mix (Fortune 500 HQ in AL)
| Industry | F500 HQs | Revenue |
|---|---|---|
| Financial Services | 1 | $8B |
|
||
| Healthcare | 1 | $5B |
|
||
Price history
-84.2% since first listed9 events — show timeline
- 2026-06-02 Listed $60,000 Greater Alabama MLS
- 2026-05-05 Sold (Public Records) $265,000 Public Records
- 2026-05-04 Sold (MLS) $265,000 Greater Alabama MLS
- 2026-03-16 Contingent — Greater Alabama MLS
- 2025-10-03 Price Changed $265,000 Greater Alabama MLS
- 2025-08-23 Price Changed $275,000 Greater Alabama MLS
- 2025-07-20 Listed $285,000 Greater Alabama MLS
- 2025-07-16 Coming Soon $285,000 Greater Alabama MLS
- 2025-01-06 Price Changed $379,900 Greater Alabama MLS
Property tax history
+2.3%/yrLatest (2025): $1,446 · +0.0% YoY. Source: county tax records.
Cash-flow waterfall
monthlySold comps — $/sqft
last 12 mo · ≤1 miLoading sold comps…