12329 71st St NE · Otsego, MN
Flood risk 1/10 · Minimal
- FEMA flood zone
- —
- Chance of flooding over 30 yrs
- 0.0%
- Est. flood insurance / yr
- —
Fire risk 1/10 · Minimal
- Est. fire insurance / yr
- $888 – $1,650
Heat risk 2/10 · Minimal
- Hot days now (above 98°F)
- 7 days/yr
- Hot days in 30 yrs
- 14 days/yr
Wind risk 2/10 · Minimal
- Chance of severe wind over 30 yrs
- —
Air-quality risk 2/10 · Minimal
- Unhealthy air days now
- 2 days/yr
- Unhealthy air days in 30 yrs
- 2 days/yr
Risk factors via First Street. Map © Google.
Why this score? — see what drove the D- grade
The composite is a weighted blend of 9 inputs, each scored 0–100. Each bar is that input's sub-score; the figure is the points it added to the 100-point composite (weight × sub-score).
- Cash flow +11.4/30.0
- ARV discount +7.5/15.0
- Schools +5.2/10.0
- Livability +3.5/5.0
- DSCR +3.3/10.0
- Rent growth +2.5/5.0
- Condition / age +2.5/5.0
- 1% rule +2.0/10.0
- Appreciation +0.0/10.0
$425,000
🖨 Deal sheet 📄 Offer letter ✓ Due diligence
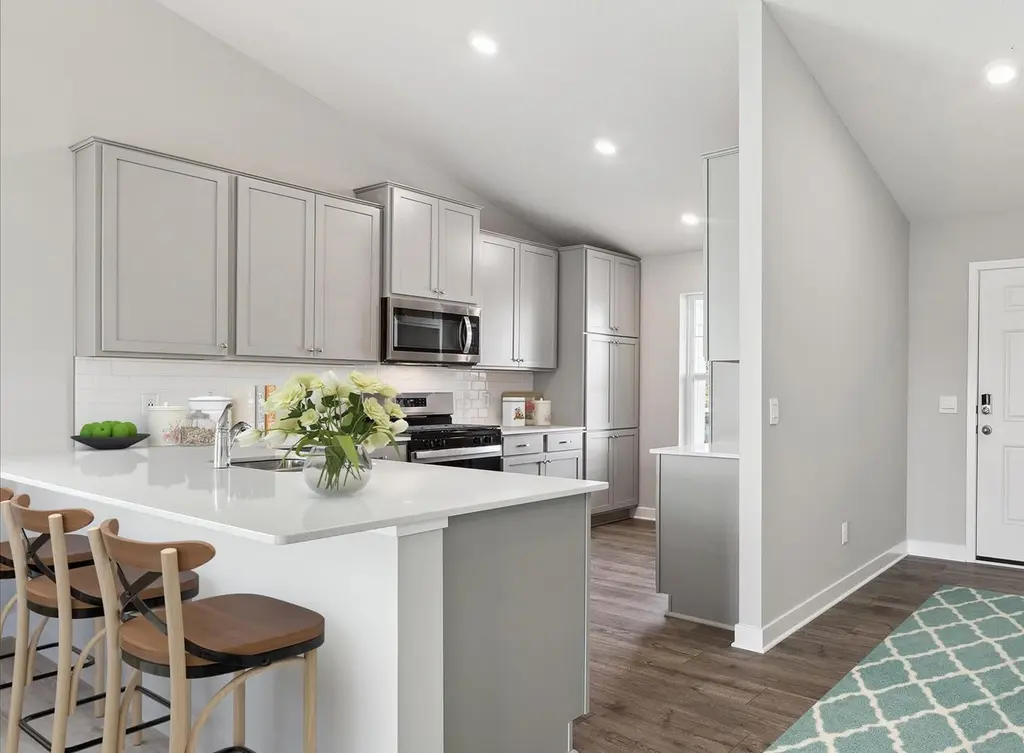
Listing remarks
The Rushmore floor plan is super functional and is sitting on a great homesite you'll be pleased with. The home features 4 bedrooms, 3 bathrooms, 3 car garage and a finished lookout lower level with a spacious family room, bedroom and full bathroom! You'll be amazed with the vaulted family room, spacious kitchen, designer White color cabinets, stainless steel appliances and quartz counter tops. Minutes from I94 for easy commuting, minutes from Albertville Premium Outlet Malls for easy shopping and minutes from a variety of entertainment and dining. COSTCO coming soon just minutes down the road! No neighborhood HOA. Come check it out!
Key facts
- 9,583 sq ft lot
- 3 garage spots
- Built 2026
Property features AI
Finance
- Other: Lot approximately 0.22 acres (dimensions 68 x 138 x 68 x 147); Lot features include sod and light tree coverage; Road frontage on city street
- HOA & community: Builders Association of the Twin Cities (builder association); No association fee
Exterior
- Parking: Attached garage; 3-car garage; Garage door opener; Asphalt driveway; Garage door approximately 7' high and 16' wide
- Utilities: City water (connected); City sewer (connected); Natural gas; 200+ amp electric service
- Home design: Residential property; Three-level split; New construction; Pitched asphalt roof (age 8 years or less); Entry level includes main level living areas; Northstar listing — model located near corner of 80th and Marquette (directional info available)
- Construction: Built by D.R. Horton; Poured concrete foundation; Foundation area 1,463; Above-grade finished area and main level finished area present; Below-grade finished area present
- Exterior features: Stone and vinyl exterior; Sod included in price; Light tree coverage; City street with curbs and paved streets; Public maintained road
Interior
- Kitchen: Kitchen with window; Dishwasher; Range; Microwave; Disposal; Stainless steel appliances; Exhaust fan
- Bedrooms: 4 bedrooms; Primary suite with private bath and walk-in closet; Three bedrooms on upper level (including 2 similar-sized bedrooms and one larger bedroom); One bedroom on lower level
- Bathrooms: 2 full bathrooms; 1 three-quarter bathroom (primary); Main floor half bath
- Heating & cooling: Forced air heating; Central air conditioning
- Interior features: Vaulted ceilings; Paneled doors; In-ground sprinkler; Air-to-air exchanger; Humidifier; Tankless water heater; Finished basement; Sump pump; Drain tiled basement; Walkout basement; Crawl space; Has fireplace (electric) serving family room and living room
- Laundry & utility: Washer hookup; Electric dryer hookup; Laundry located in basement
Neighborhood map
What this means for you Summary
Snapshot
- This is a 4-bed/3.0-bath other listed at $425k.
Deal economics
- At list price, monthly cash flow is $-145 ($-2k/yr) — negative.
- To cash-flow at today's rent, offer at most $399k (6.0% below list).
- To meet the 1% rule (rent ≥ 1% of price), the offer needs to be $298k (29.9% below list).
- Recommended offer: $298k (29.9% below list) — sets the bar for 1% rule.
- Cap rate 5.9% vs local median 4.0% in Otsego — top-decile yield for the area; either an underpriced asset or a hidden risk that comps aren't pricing in. Stress-test before assuming the spread holds.
Location & tenants
- Location reads 69/100 on livability (#367 in MN) — a middle-class / working-renter tenant base. Strengths: employment A+, housing A+, crime A-; Watch: cost of living C-, amenities F, commute F.
- Independent School District 728 (suburban): math 56% / reading 60% proficiency, ranked #37 of 301 in MN (top 12%) — acceptable for families but not a draw, mixed tenant base, ~2y average lease; only 14% free/reduced lunch — higher-income household profile.
- Market conditions: 453 active listings in the ZIP; 2 comparable units currently listed for rent nearby; high-income renter base; 1,260 units permitted in Wright County in 2024 (180 in 5+ unit buildings).
- This rent runs 31% of the median local income ($116k/yr) — at the standard rent-burdened threshold; future hikes will face affordability resistance.
Forward outlook
- Local home prices are declining (-3.0%/yr); year-one equity from $3k of loan paydown is wiped out by about $13k of value loss. Plan a longer hold.
- Wright County population projected at +9% by 2050 — modest demand growth; plan on rents tracking national, not racing it.
Negotiation context
- Only 10 days on market — expect competitive offers; lowballing is unlikely to land.
Questions for the listing agent
- What do current leases actually rent for vs. the listed asking? Can we see a recent rent roll and the last 12 months of T-12 income?
- Is there a deadline driving the sale (1031 exchange, divorce, estate, relocation)? That informs how much negotiation room exists.
- Schools are B-rated — typically a magnet for longer-tenancy family renters. What's the average tenant stay here, and is there a school-zone premium baked into asking?
- The area grade is low — what's the realistic commute time and amenity access for the typical tenant pool here? Any planned neighborhood developments (good or bad) we should know about?
- What's the average days-on-market for RENTAL listings here right now (not sales)? A rising rental-DOM trend means longer vacancies and softer asking-rent achievability than the comps imply.
- What's the recent tenant-quality profile in this submarket — average credit score on applications, eviction rate, late-payment / NSF rate, and stable-employment percentage? A property-management company in the area should have these aggregated.
- How much new for-sale + rental construction is in the pipeline within 1–3 miles? Heavy new supply typically softens prices + rents 12–24 months out; constrained supply supports both.
Investment metrics
- 1% rule
- 0.70% ✗
- Cap rate
- 5.88%
- Cash-on-cash
- -1.47%
- DSCR
- 0.93
- GRM
- 11.9
CMA / ARV
No comps found within radius.
Projected returns pro-forma
-3.0% appreciation · 3.0% rent growth · sell at horizon
- IRR
- -18.8%
- Equity multiple
- 0.34×
- Total profit
- $-78,346
- Equity at exit
- $63,369
- IRR
- -11.4%
- Equity multiple
- 0.32×
- Total profit
- $-81,048
- Equity at exit
- $36,746
Cash invested: $119,000 (down + closing). Projections, not guarantees.
Landlord ↔ Tenant lean methodology
- Overall (STATE)
- 46 Balanced
- State Minnesota
- 46 Balanced · D+2
- County
- — inherits STATE
- City
- — inherits STATE
ZIP-level market 55330
- Active inventory
- 453
- Price-to-rent
- 11.9×
Monthly cashflow live
- Estimated rent
- $2,980 medium interval (Pro) →
- Mortgage (P&I)
- −$2,229
- Tax from tax record
- −$93 /mo · $1,120/yr
- Insurance
- −$177
- HOA
- −$0
- Vacancy / Maint / Mgmt
- −$626
- Net cashflow
- $-145
Break-even live
UW: 25.0% down · 7.5% · 30yr · 1.5% tax · 5.0% vac · 8.0% maint · 8.0% mgmt
Financing live
Cash to close
- Down payment
- $106,250
- Closing costs
- $12,750
- Reserves months
- —
- Total cash needed
- —
Loan-product check · same deal, 3 products live
Conventional
25% down · 7.5% · 30yr
- Down + closing
- —
- Monthly P&I
- —
- Monthly cashflow
- —
- DSCR
- —
- Eligible?
- —
Personal DTI + credit; lowest rate.
DSCR
20% down · 8.5% · 30yr
- Down + closing
- —
- Monthly P&I
- —
- Monthly cashflow
- —
- DSCR
- —
- Eligible?
- —
No personal income docs; deal must DSCR.
Hard money
10% down · 12.0% · 12mo
- Down + closing
- —
- Monthly P&I
- —
- Monthly cashflow
- —
- DSCR
- —
- Eligible?
- —
Short-term bridge; refi at stabilization.
Rent comps 2 comps
| Address | Beds | Baths | Sqft | Rent | $/sqft | DOM | Units | Dist |
|---|---|---|---|---|---|---|---|---|
| 7535 Lannon Ave NE Albertville, MN | 5.0 | 3.0 | 2209 | $3,179 | $1.44 | 1d | 1 | 0.88mi |
| 7712 Lachman Ave NE Albertville, MN | 3.0 | 2.0 | 1525 | $2,259 | $1.48 | 1d | 1 | 1.44mi |
Listing history 8 events
-
2026-06-18days on market $425,000 Active 10 DOM
-
2026-06-17days on market $425,000 Active 9 DOM
-
2026-06-16days on market $425,000 Active 8 DOM
-
2026-06-15days on market $425,000 Active 7 DOM
-
2026-06-13days on market $425,000 Active 5 DOM
-
2026-06-13days on market $425,000 Active 4 DOM
-
2026-06-08remarks 641-char remark
-
2026-06-08$425,000 Active 1 DOM
ⓘ Source: listings_history table (triggers on properties + properties_extension) + one-shot
backfill from property_details.listing_events for pre-trigger history.
Tax reassessment forecast MN · Partial reset (capped growth)
- Current annual tax
- $1,120 · $93/mo
- Projected year-2 tax
- $2,940 · $245/mo
- Expected delta
- +$1,820/yr (+$152/mo · 162.5%)
ⓘ Screening estimate from a state-policy table — verify with the county assessor before closing.
Climate risk First Street
- Flood 1/10 Low 0% chance over 30 yrs
- Wildfire 1/10 Low
- Heat 2/10 Low 7 d/yr ≥98°F today · 14 d/yr by 30 yrs out
- Wind 2/10 Low
- Air quality 2/10 Low 2 unhealthy d/yr today · 2 by 30 yrs out
Nearby sold comps map
Loading sold comps map…
Walkable amenities ~0.75 mi
Loading nearby amenities…
Taxation est. · year 1
- Rental income
- $35,755
- − Mortgage interest
- −$23,807
- − Property taxes
- −$1,120
- − Insurance
- −$2,125
- − Repairs & maintenance
- −$2,860
- − Management
- −$2,860
- − Depreciation
- −$12,364
- Taxable loss
- −$9,381
- Est. tax savings @ 24.0%
- +$2,251
- After-tax cash flow
- $508/yr
For passive investors: Depreciation is non-cash, so a rental often shows a tax loss while cash-flowing — sheltering income. Rental losses are passive: they offset passive income freely, and up to $25,000/yr can offset ordinary (W-2) income if you actively participate and your MAGI is under $100k (phasing out to $0 by $150k); unused losses carry forward. On sale, claimed depreciation is recaptured at up to 25%, and gains may owe capital-gains tax (a 1031 exchange can defer both). Figures are a year-1 estimate at your 24.0% rate — not tax advice; consult a CPA.
Schools (NCES district)
- District
- Independent School District 728
- NCES district ID
- 2711370
- Math proficiency
- 56% ▼ -15.00%
- Reading proficiency
- 60% ▼ -10.00%
- Median HH income
- $82,336
- Composite
- 52.5/100
- National rank
- #1567
- State rank
- #37 of 301 in MN
Livability — Otsego
- Score
- 69/100
- State rank
- #367
- US rank
- #8641
Category grades
Schools grade is shown separately in the Schools card above.
Census & demographics
- Census place
- Otsego, MN
- County
- Sherburne County · 120,363 people
- Metro
- Minneapolis-St. Paul-Bloomington, MN-WI
- Population (ZIP)
- 45,721
- Household income
- $115,761
- Rent vs Own
- Severe rent burden
- 285.0
Population outlook (Wright County) Hauer SSP2
- Today (2025)
- 142,526 people
- By 2030
- 146,915 · +3.1%
- By 2040
- 153,625 · +7.8%
- By 2050
- 155,416 · +9.0%
- By 2075
- 150,352 · +5.5%
- By 2100
- 130,631 · -8.3%
Race, ethnicity, and origin ACS 2023
- Neighborhood character
- Predominantly White (85%)
- Race & ethnicity
- White 85% Two or more races 6% Black 4% Hispanic / Latino 3% Asian 1%
- Common ancestry
- Portuguese 13% Romanian 6% Lithuanian 3%
- Foreign-born
- 5% · Canada, South Korea
- Languages at home
- 94% English-only · Spanish 2% Russian/Polish/Slavic 1% Other Asian/Pacific 1%
Political lean MEDSL · Wright
- 2024 margin
- Strong R (+29.4) · D 34.4% · R 63.8% · Other 1.8%
- 2008→2024 swing
- -11.9pp toward R · 2008: -17.4pp · 2024: -29.4pp
- All cycles
- 2024: R+29.4 2020: R+28.6 2016: R+33.2 2012: R+21.4 2008: R+17.4
Not yet ingested
- Civics
- —
Market trends
- HPI YoY
- ▼ -173.46%
- Current HPI
- 241.3028
- Rent YoY
- —
- Metro
- Minneapolis-St. Paul-Bloomington, MN-WI
- State GDP YoY
- ▲ 2.41%
- F500 in state
- 34
Industry mix (Fortune 500 HQ in MN)
| Industry | F500 HQs | Revenue |
|---|---|---|
| Healthcare | 2 | $407B |
|
||
| Retail | 2 | $150B |
|
||
| Consumer Goods | 2 | $32B |
|
||
| Industrial Machinery | 2 | $6B |
|
||
| Agriculture | 1 | $40B |
|
||
| Healthcare / Medical Devices | 1 | $32B |
|
||
Price history
-79.8% since first listed2 events — show timeline
- 2026-06-08 Listed $425,000 NORTHSTARMLS as Distributed by MLS Grid
- 2022-07-22 Sold (Public Records) $2,100,000 Public Records
Property tax history
+122.3%/yrLatest (2025): $1,120 · +23.6% YoY. Source: county tax records.
Cash-flow waterfall
monthlySold comps — $/sqft
last 12 mo · ≤1 miLoading sold comps…