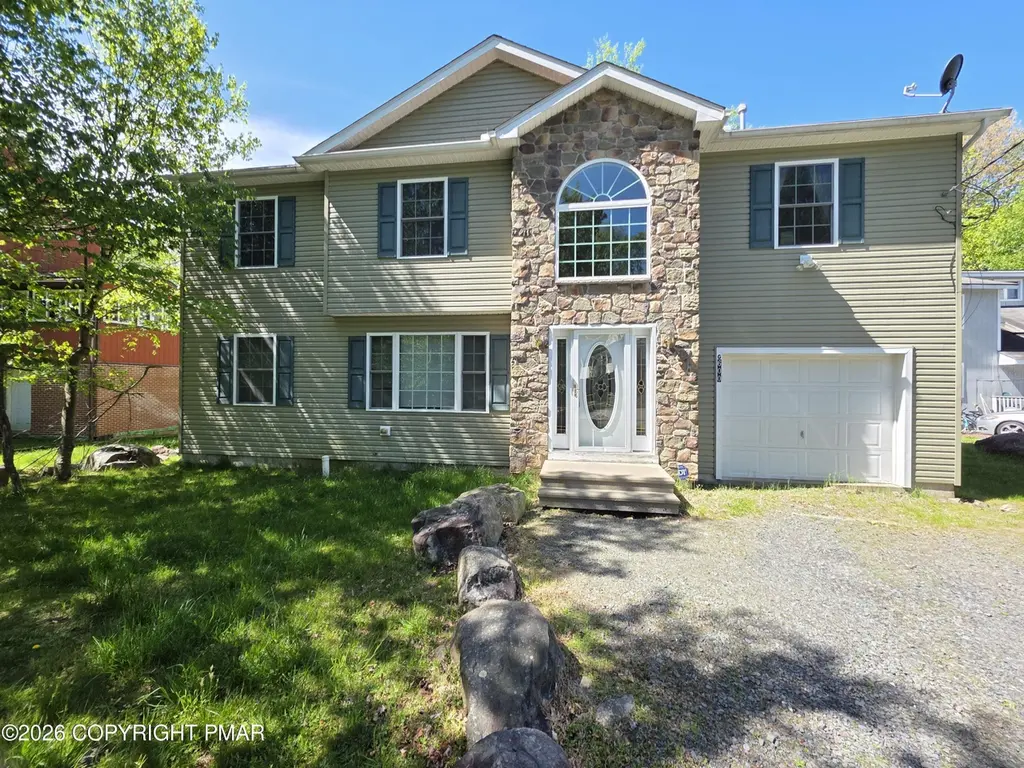
7470 Leila Ct · Gouldsboro, PA
Flood risk 1/10 · Minimal
- FEMA flood zone
- X (unshaded)
- Chance of flooding over 30 yrs
- 0.0%
- Est. flood insurance / yr
- $507 – $1,088
Fire risk 1/10 · Minimal
- Est. fire insurance / yr
- $511 – $949
Heat risk 2/10 · Minimal
- Hot days now (above 89°F)
- 7 days/yr
- Hot days in 30 yrs
- 16 days/yr
Wind risk 3/10 · Minor
- Chance of severe wind over 30 yrs
- 6.0%
Air-quality risk 2/10 · Minimal
- Unhealthy air days now
- 1 days/yr
- Unhealthy air days in 30 yrs
- 2 days/yr
Risk factors via First Street. Map © Google.
Why this score? — see what drove the D+ grade
The composite is a weighted blend of 9 inputs, each scored 0–100. Each bar is that input's sub-score; the figure is the points it added to the 100-point composite (weight × sub-score).
- ARV discount +12.9/15.0
- Cash flow +8.1/30.0
- Appreciation +6.2/10.0
- Schools +4.0/10.0
- 1% rule +3.4/10.0
- Livability +3.4/5.0
- Rent growth +2.5/5.0
- Condition / age +2.5/5.0
- DSCR +2.1/10.0
$290,000
🖨 Deal sheet (PDF) 📄 Offer letter ✓ Due diligence
Listing remarks
Come See This Beautifully Maintained Colonial Home Featuring 4 Bedrooms, 3 Bathrooms, Central AC For Those Hot Summer Days, And A Charming Gas Stone-Faced Fireplace For Those Chilly Winter Nights. Natural Lighting Throughout. Great Space With Plenty Of Storage. The Primary Suite Boasts A Jetted Tub For The Perfect Spot To Unwind. Attached Garage With Door Leading To Outside For Easy In And Out Access. Schedule Appointment Today!
Key facts
- Central ac
- Natural lighting
- Attached garage
Tags
Property features AI
Finance
- HOA & community: Homeowners association with annual fee (maintenance of grounds included); Community amenities: Security, gated entry, clubhouse, playground, recreation facilities, tennis courts, basketball court, pool
Exterior
- Parking: Attached garage (1 car); Driveway with gravel
- Utilities: Public water; Public sewer; 200+ amp electric service
- Home design: House-style condominium; Two stories
- Construction: Structure type: House
- Exterior features: Deck
Interior
- Kitchen: Electric cooktop; Refrigerator; Microwave; Pantry
- Flooring: Hardwood; Laminate; Tile; Vinyl
- Bathrooms: Two full bathrooms; One half bathroom
- Heating & cooling: Forced air heating; Central air conditioning; Ceiling fans
- Interior features: Pantry; Cathedral ceilings and high ceilings; Walk-in closets; Ceiling fans; Storage space; Living room propane fireplace
- Laundry & utility: Laundry on main level in laundry closet
Neighborhood map
What this means for you Summary
Snapshot
- This is a 4-bed/2.5-bath single-family listed at $290k.
Deal economics
- At list price, monthly cash flow is $-285 ($-3k/yr) — negative.
- To cash-flow at today's rent, offer at most $240k (17.4% below list).
- To meet the 1% rule (rent ≥ 1% of price), the offer needs to be $243k (16.1% below list).
- Recommended offer: $240k (17.4% below list) — sets the bar for cash-flow.
Location & tenants
- Location reads 68/100 on livability (#903 in PA) — a middle-class / working-renter tenant base. Strengths: cost of living A+, housing A+, employment B+; Watch: schools D-, amenities F, commute F.
- Pocono Mountain SD (rural): math 37% / reading 55% proficiency, ranked #245 of 539 in PA (top 46%) — families likely to look elsewhere, expect single-tenant / working-renter base with shorter leases.
- Market conditions: 355 active listings in the ZIP; 9 comparable units currently listed for rent nearby; rentals lingering (median 44d on market — plan ~5-8 weeks vacancy on turnover, expect pricing pressure); 67% of comp listings sitting > 30 days — soft ceiling on asking rent; 278 units permitted in Monroe County in 2024 (52 in 5+ unit buildings).
Forward outlook
- In year one you build about $9k of equity ($2k loan paydown + $7k appreciation (2.4% local appreciation)).
- Monroe County population projected at -11% by 2050 — secular population decline; favor cash flow + early exit over multi-decade hold.
- By year 4, paydown + projected appreciation supports a ~$30k cash-out refi (75% LTV) — recoverable capital for the next deal without selling this one.
Negotiation context
- It's been on market 20 days — a 2% lower offer ($286k) is reasonable based on typical stale-listing flexibility.
- Current owner paid $190k; list at $290k implies a 53% gain — meaningful room to come down on a strong offer.
Questions for the listing agent
- What do current leases actually rent for vs. the listed asking? Can we see a recent rent roll and the last 12 months of T-12 income?
- What does the HOA fee cover, when was the last increase, and are there any pending special assessments or reserve-fund shortfalls?
- Is there a deadline driving the sale (1031 exchange, divorce, estate, relocation)? That informs how much negotiation room exists.
- Schools are D-rated, which usually means shorter tenancies and higher turnover. Who's the typical renter profile here, and what's been the actual vacancy rate?
- The area grade is low — what's the realistic commute time and amenity access for the typical tenant pool here? Any planned neighborhood developments (good or bad) we should know about?
- What's the average days-on-market for RENTAL listings here right now (not sales)? A rising rental-DOM trend means longer vacancies and softer asking-rent achievability than the comps imply.
- What's the recent tenant-quality profile in this submarket — average credit score on applications, eviction rate, late-payment / NSF rate, and stable-employment percentage? A property-management company in the area should have these aggregated.
- How much new for-sale + rental construction is in the pipeline within 1–3 miles? Heavy new supply typically softens prices + rents 12–24 months out; constrained supply supports both.
Investment metrics
- 1% rule
- 0.84% ✗
- Cap rate
- 5.11%
- Cash-on-cash
- -4.22%
- DSCR
- 0.81
- GRM
- 9.9
CMA / ARV
- ARV (on-the-fly)
- $329,130
- Comps found
- 12
Show comp detail 12 sales within ~0.75 mi
| Address | Dist | Beds/Ba | Sqft | Sold | Price | $/sf | Match |
|---|---|---|---|---|---|---|---|
| 7261 Long Pine Dr | 0.42mi | 4/2.0 | 2,000 (-3%) | 4mo | $299,000 | $150 | 70 |
| 6000 Boardwalk Dr | 0.40mi | 4/2.5 | 2,198 (+6%) | 5mo | $355,000 | $162 | 67 |
| 8192 Elk Ct | 0.20mi | 4/3.0 | 1,822 (-12%) | 5mo | $210,000 | $115 | 64 |
| 6098 Boardwalk Dr | 0.66mi | 4/3.0 | 2,080 (+0%) | 5mo | $299,000 | $144 | 62 |
| 539 Country Place Dr | 0.48mi | 3/2.0 (-1) | 2,000 (-3%) | 4mo | $345,000 | $173 | 62 |
| 6224 Park Pl | 0.55mi | 4/3.0 | 2,000 (-3%) | 6mo | $330,000 | $165 | 61 |
| 7086 Boulder Ct | 0.60mi | 4/2.0 | 1,984 (-4%) | 4mo | $315,500 | $159 | 60 |
| 7500 Crestview Dr | 0.46mi | 4/2.5 | 2,278 (+10%) | 6mo | $339,000 | $149 | 57 |
| 8567 Hillcrest Dr | 0.46mi | 3/2.5 (-1) | 1,900 (-8%) | 4mo | $265,000 | $139 | 57 |
| 6323 Ventnor Dr | 0.47mi | 3/2.0 (-1) | 1,848 (-11%) | 3mo | $305,000 | $165 | 51 |
| 7021 Vista Dr | 0.48mi | 5/2.0 (+1) | 1,860 (-10%) | 4mo | $370,000 | $199 | 50 |
| 6084 Boardwalk Dr | 0.63mi | 3/2.5 (-1) | 1,808 (-13%) | 6mo | $250,000 | $138 | 40 |
Match score weights: distance 35% · size 25% · config 20% · recency 20%. Top-matched comps best support the ARV.
Projected returns pro-forma
2.36% appreciation · 3.0% rent growth · sell at horizon
- IRR
- 1.6%
- Equity multiple
- 1.09×
- Total profit
- $7,173
- Equity at exit
- $120,022
- IRR
- 5.5%
- Equity multiple
- 1.78×
- Total profit
- $63,726
- Equity at exit
- $177,274
Cash invested: $81,200 (down + closing). Projections, not guarantees.
Landlord ↔ Tenant lean methodology
- Overall (STATE)
- 62 Landlord-Friendly
- State Pennsylvania
- 62 Landlord-Friendly · EVEN
- County
- — inherits STATE
- City
- — inherits STATE
ZIP-level market 18466
- Home prices YoY
- 1.2%
- Active inventory
- 355
- Price-to-rent
- 9.9×
Monthly cashflow live
- Estimated rent
- $2,435 high interval (Pro) →
- Mortgage (P&I)
- −$1,521
- Tax from tax record
- −$424 /mo · $5,088/yr
- Insurance
- −$121
- HOA
- −$143
- Vacancy / Maint / Mgmt
- −$511
- Net cashflow
- $-285
Break-even live
Sensitivity live
| Price | -10% $-121 | -5% $-203 | +0% $-285 | +5% $-367 | +10% $-449 |
|---|---|---|---|---|---|
| Rent | -10% $-478 | -5% $-381 | +0% $-285 | +5% $-189 | +10% $-93 |
| Rate | -1.0pp $-139 | -0.5pp $-212 | base $-285 | +0.5pp $-360 | +1.0pp $-437 |
UW: 25.0% down · 7.5% · 30yr · 1.5% tax · 5.0% vac · 8.0% maint · 8.0% mgmt
Financing live
Cash to close
- Down payment
- $72,500
- Closing costs
- $8,700
- Reserves months
- —
- Total cash needed
- —
Loan-product check · same deal, 3 products live
Conventional
25% down · 7.5% · 30yr
- Down + closing
- —
- Monthly P&I
- —
- Monthly cashflow
- —
- DSCR
- —
- Eligible?
- —
Personal DTI + credit; lowest rate.
DSCR
20% down · 8.5% · 30yr
- Down + closing
- —
- Monthly P&I
- —
- Monthly cashflow
- —
- DSCR
- —
- Eligible?
- —
No personal income docs; deal must DSCR.
Hard money
10% down · 12.0% · 12mo
- Down + closing
- —
- Monthly P&I
- —
- Monthly cashflow
- —
- DSCR
- —
- Eligible?
- —
Short-term bridge; refi at stabilization.
Rent comps 9 comps
| Address | Beds | Baths | Sqft | Rent | $/sqft | DOM | Units | Dist |
|---|---|---|---|---|---|---|---|---|
| 126 Feather Ln Tobyhanna, PA | 4.0 | 2.0 | 2068 | $2,900 | $1.40 | 44d | 1 | 0.12mi |
| 655 Country Place Dr Tobyhanna, PA | 4.0 | 2.0 | 1914 | $2,200 | $1.15 | 44d | 1 | 0.18mi |
| 776 Country Place Dr Tobyhanna, PA | 4.0 | 3.0 | 1870 | $2,100 | $1.12 | 44d | 1 | 0.25mi |
| 7067 Vista Dr Tobyhanna, PA | 3.0 | 2.0 | 1436 | $2,250 | $1.57 | 44d | 1 | 0.29mi |
| 8136 Pecan Ter Tobyhanna, PA | 5.0 | 2.0 | 2200 | $2,450 | $1.11 | 44d | 1 | 0.33mi |
| 8446 Bear Trail Dr Tobyhanna, PA | 3.0 | 2.0 | 1902 | $2,100 | $1.10 | 44d | 1 | 0.48mi |
| 1002 Knollwood Dr Tobyhanna, PA | 4.0 | 1.5 | 2088 | $2,300 | $1.10 | 13d | 1 | 1.42mi |
| 9149 Brandywine Dr Tobyhanna, PA | 4.0 | 3.0 | 1870 | $2,100 | $1.12 | 21d | 1 | 1.49mi |
| 9294 Bluebird Ct Tobyhanna, PA | 3.0 | 2.5 | 2107 | $2,150 | $1.02 | 13d | 1 | 1.49mi |
HOA detail
- Monthly dues
- $143 · $1,716/yr
- Likely covers
- gas
Listing history 14 events
-
2026-06-15status $290,000 Pending 20 DOM
-
2026-06-15days on market $290,000 Active 20 DOM
-
2026-06-14days on market $290,000 Active 18 DOM
-
2026-06-13days on market $290,000 Active 17 DOM
-
2026-06-10days on market $290,000 Active 15 DOM
-
2026-06-09days on market $290,000 Active 14 DOM
-
2026-06-08days on market $290,000 Active 13 DOM
-
2026-06-07days on market $290,000 Active 12 DOM
-
2026-06-02days on market $290,000 Active 7 DOM
-
2026-06-01days on market $290,000 Active 6 DOM
-
2026-05-31days on market $290,000 Active 5 DOM
-
2026-05-30days on market $290,000 Active 4 DOM
-
2026-05-26$290,000 Active
-
2010-08-06soldstatus $190,000
ⓘ Source: listings_history table (triggers on properties + properties_extension) + one-shot
backfill from property_details.listing_events for pre-trigger history.
Tax reassessment forecast PA · Partial reset (capped growth)
- Current annual tax
- $5,088 · $424/mo
- Projected year-2 tax
- $5,088 · $424/mo
- Expected delta
- $0/yr ($0/mo · 0.0%)
ⓘ Screening estimate from a state-policy table — verify with the county assessor before closing.
Climate risk First Street
- Flood 1/10 Low FEMA zone X (unshaded) · 0% chance over 30 yrs
- Wildfire 1/10 Low
- Heat 2/10 Low 7 d/yr ≥89°F today · 16 d/yr by 30 yrs out
- Wind 3/10 Moderate 6% chance of damaging wind over 30 yrs
- Air quality 2/10 Low 1 unhealthy d/yr today · 2 by 30 yrs out
Nearby sold comps map
Loading sold comps map…
Walkable amenities ~0.75 mi
Loading nearby amenities…
Taxation est. · year 1
- Rental income
- $29,214
- − Mortgage interest
- −$16,245
- − Property taxes
- −$5,088
- − Insurance
- −$1,450
- − Repairs & maintenance
- −$2,337
- − Management
- −$2,337
- − HOA
- −$1,716
- − Depreciation
- −$8,436
- Taxable loss
- −$8,394
- Est. tax savings @ 24.0%
- +$2,015
- After-tax cash flow
- $-1,409/yr
For passive investors: Depreciation is non-cash, so a rental often shows a tax loss while cash-flowing — sheltering income. Rental losses are passive: they offset passive income freely, and up to $25,000/yr can offset ordinary (W-2) income if you actively participate and your MAGI is under $100k (phasing out to $0 by $150k); unused losses carry forward. On sale, claimed depreciation is recaptured at up to 25%, and gains may owe capital-gains tax (a 1031 exchange can defer both). Figures are a year-1 estimate at your 24.0% rate — not tax advice; consult a CPA.
Schools (NCES district)
- District
- Pocono Mountain SD
- NCES district ID
- 4219500
- Math proficiency
- 37% ▼ -5.00%
- Reading proficiency
- 55% ▲ 1.00%
- Median HH income
- $55,317
- Composite
- 39.91/100
- National rank
- #3856
- State rank
- #245 of 539 in PA
Livability — Gouldsboro
- Score
- 68/100
- State rank
- #903
- US rank
- #9638
Category grades
Schools grade is shown separately in the Schools card above.
Census & demographics
- Population (ZIP)
- 17,997
Population outlook (Monroe County) Hauer SSP2
- Today (2025)
- 164,099 people
- By 2030
- 161,412 · -1.6%
- By 2040
- 154,616 · -5.8%
- By 2050
- 146,710 · -10.6%
- By 2075
- 140,830 · -14.2%
- By 2100
- 138,472 · -15.6%
Race, ethnicity, and origin ACS 2023
- Neighborhood character
- Highly diverse neighborhood (Simpson 0.72)
- Race & ethnicity
- White 38% Hispanic / Latino 27% Black 24% Two or more races 17% Asian 4%
- Hispanic origin (detail)
- Puerto Rican 12% Dominican 6%
- Common ancestry
- Romanian 2% Portuguese 1% German 1%
- Foreign-born
- 16% · Canada
- Languages at home
- 77% English-only · Spanish 17% Other Indo-European 2% Russian/Polish/Slavic 1%
Political lean MEDSL · Monroe
- 2024 margin
- Toss-up / Even · D 49.1% · R 49.9%
- 2008→2024 swing
- -17.1pp toward R · 2008: 16.3pp · 2024: -0.8pp
- All cycles
- 2024: R+0.8 2020: D+6.4 2016: D+0.3 2012: D+14.0 2008: D+16.3
Not yet ingested
- Civics
- —
Market trends
- HPI YoY
- ▲ 2.36%
- Current HPI
- 202.4134
- Rent YoY
- —
- Metro
- —
- State GDP YoY
- ▲ 1.68%
- F500 in state
- 34
Industry mix (Fortune 500 HQ in PA)
| Industry | F500 HQs | Revenue |
|---|---|---|
| Healthcare | 2 | $309B |
|
||
| Insurance | 2 | $27B |
|
||
| Telecommunications / Media | 1 | $124B |
|
||
| Industrial Distribution | 1 | $22B |
|
||
| Financial Services | 1 | $20B |
|
||
| Chemicals / Materials | 1 | $18B |
|
||
Price history
+52.6% since first listed2 events — show timeline
- 2026-05-26 Listed $290,000 PMAR
- 2010-08-06 Sold (Public Records) $190,000 Public Records
Property tax history
-1.4%/yrLatest (2026): $5,088 · +3.2% YoY. Source: county tax records.
Cash-flow waterfall
monthlySold comps — $/sqft
last 12 mo · ≤1 miLoading sold comps…