69 Parade Ground Cemetery Rd · Warner, NH
Flood risk 1/10 · Minimal
- FEMA flood zone
- X (unshaded)
- Chance of flooding over 30 yrs
- 0.0%
- Est. flood insurance / yr
- $507 – $1,088
Fire risk 3/10 · Minor
- Est. fire insurance / yr
- $507 – $941
Heat risk 2/10 · Minimal
- Hot days now (above 93°F)
- 7 days/yr
- Hot days in 30 yrs
- 16 days/yr
Wind risk 4/10 · Minor
- Chance of severe wind over 30 yrs
- 10.0%
Air-quality risk 1/10 · Minimal
- Unhealthy air days now
- 0 days/yr
- Unhealthy air days in 30 yrs
- 0 days/yr
Risk factors via First Street. Map © Google.
Why this score? — see what drove the D- grade
The composite is a weighted blend of 9 inputs, each scored 0–100. Each bar is that input's sub-score; the figure is the points it added to the 100-point composite (weight × sub-score).
- Appreciation +8.8/10.0
- Cash flow +7.2/30.0
- ARV discount +5.7/15.0
- Schools +4.6/10.0
- Livability +3.1/5.0
- Rent growth +2.5/5.0
- Condition / age +2.5/5.0
- 1% rule +2.3/10.0
- DSCR +1.4/10.0
$225,000
🖨 Deal sheet 📄 Offer letter ✓ Due diligence
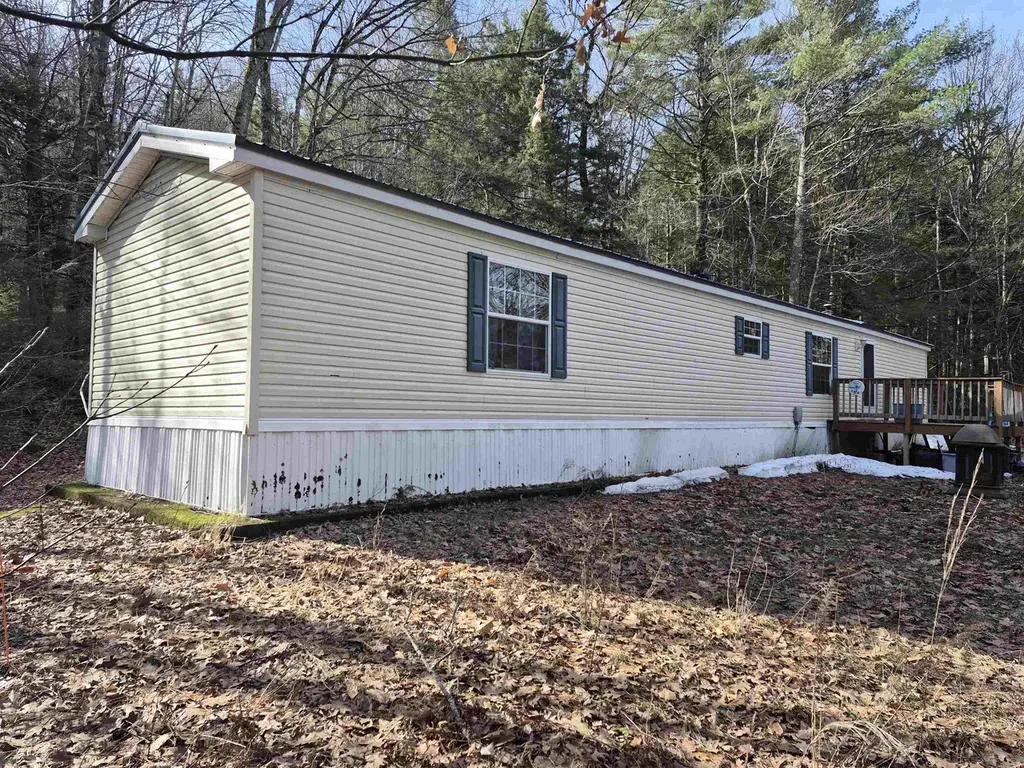
Listing remarks
Looking for Land? This 2 bedroom 2 bath mobile home on just over 10 acres of private wooded land is ready for you to fix it up and make it home! Located a minute off exit 8 of rt 89. 25 minutes away from Mt Sunapee and Pats Peak! A great opportunity and a great price! Call today for a private viewing. Offer deadline has been set for 4/17/26 at Noon.
Key facts
- Private wooded land
- 10.2 acre lot
- Built 1980
Tags
Property features AI
Exterior
- Utilities: Private well water; Private sewer; Circuit breaker electrical service; Cable internet available
- Home design: Manufactured/Mobile home; Existing construction
- Construction: Vinyl siding; Metal roof; Built in 1980
- Exterior features: Wooded lot; Paved driveway; Dirt road frontage (approximately 299 feet)
Interior
- Bathrooms: 2 full bathrooms
- Heating & cooling: Oil heating
- Interior features: Four total rooms; Two full bathrooms
Neighborhood map
What this means for you Summary
Snapshot
- This is a 2-bed/1.0-bath manufactured listed at $225k.
Deal economics
- At list price, monthly cash flow is $-307 ($-4k/yr) — negative.
- To cash-flow at today's rent, offer at most $171k (24.1% below list).
- To meet the 1% rule (rent ≥ 1% of price), the offer needs to be $163k (27.5% below list).
- Recommended offer: $163k (27.5% below list) — sets the bar for 1% rule.
Location & tenants
- Location reads 61/100 on livability (#88 in NH) — a middle-class / working-renter tenant base. Strengths: crime A+, cost of living A; Watch: health & safety C-, housing D, amenities F.
- Kearsarge Regional School District (rural): math 44% / reading 60% proficiency, ranked #30 of 98 in NH (top 31%) — acceptable for families but not a draw, mixed tenant base, ~2y average lease; only 15% free/reduced lunch — higher-income household profile.
- Market conditions: 12 active listings in the ZIP; 380 units permitted in Merrimack County in 2024 (28 in 5+ unit buildings).
Forward outlook
- In year one you build about $19k of equity ($2k loan paydown + $17k appreciation (7.6% local appreciation)).
- Merrimack County population projected to shrink 5% by 2050 — rents likely to lag national; underwrite the cash flow, not the appreciation.
- By year 3, paydown + projected appreciation supports a ~$47k cash-out refi (75% LTV) — recoverable capital for the next deal without selling this one.
Negotiation context
- Only 8 days on market — expect competitive offers; lowballing is unlikely to land.
- 2 sale attempts with the ask held roughly flat each time — persistent listings suggest the price (not the market) is what's stuck; bring a comps-based counter.
Questions for the listing agent
- What do current leases actually rent for vs. the listed asking? Can we see a recent rent roll and the last 12 months of T-12 income?
- Is there a deadline driving the sale (1031 exchange, divorce, estate, relocation)? That informs how much negotiation room exists.
- The area grade is low — what's the realistic commute time and amenity access for the typical tenant pool here? Any planned neighborhood developments (good or bad) we should know about?
- What's the average days-on-market for RENTAL listings here right now (not sales)? A rising rental-DOM trend means longer vacancies and softer asking-rent achievability than the comps imply.
- What's the recent tenant-quality profile in this submarket — average credit score on applications, eviction rate, late-payment / NSF rate, and stable-employment percentage? A property-management company in the area should have these aggregated.
- How much new for-sale + rental construction is in the pipeline within 1–3 miles? Heavy new supply typically softens prices + rents 12–24 months out; constrained supply supports both.
Investment metrics
- 1% rule
- 0.73% ✗
- Cap rate
- 4.65%
- Cash-on-cash
- -5.85%
- DSCR
- 0.74
- GRM
- 11.5
CMA / ARV
- ARV (on-the-fly)
- $216,310
- Comps found
- 1
Show comp detail 1 sale within ~0.75 mi
| Address | Dist | Beds/Ba | Sqft | Sold | Price | $/sf | Match |
|---|---|---|---|---|---|---|---|
| 69 Parade Ground Cemetery Rd | 0.00mi | 2/2.0 | 1,008 (+4%) | 1mo | $225,000 | $223 | 89 |
Match score weights: distance 35% · size 25% · config 20% · recency 20%. Top-matched comps best support the ARV.
Projected returns pro-forma
7.6% appreciation · 3.0% rent growth · sell at horizon
- IRR
- 14.6%
- Equity multiple
- 2.07×
- Total profit
- $67,452
- Equity at exit
- $164,849
- IRR
- 14.5%
- Equity multiple
- 4.34×
- Total profit
- $210,276
- Equity at exit
- $321,580
Cash invested: $63,000 (down + closing). Projections, not guarantees.
Landlord ↔ Tenant lean methodology
- Overall (STATE)
- 56 Moderately Landlord-Leaning
- State New Hampshire
- 56 Moderately Landlord-Leaning · D+1
- County
- — inherits STATE
- City
- — inherits STATE
ZIP-level market 03278
- Home prices YoY
- 2.3%
- Active inventory
- 12
- Price-to-rent
- 11.5×
Monthly cashflow live
- Estimated rent
- $1,632 medium interval (Pro) →
- Mortgage (P&I)
- −$1,180
- Tax from tax record
- −$323 /mo · $3,871/yr
- Insurance
- −$94
- HOA
- −$0
- Vacancy / Maint / Mgmt
- −$343
- Net cashflow
- $-307
Break-even live
UW: 25.0% down · 7.5% · 30yr · 1.5% tax · 5.0% vac · 8.0% maint · 8.0% mgmt
Financing live
Cash to close
- Down payment
- $56,250
- Closing costs
- $6,750
- Reserves months
- —
- Total cash needed
- —
Loan-product check · same deal, 3 products live
Conventional
25% down · 7.5% · 30yr
- Down + closing
- —
- Monthly P&I
- —
- Monthly cashflow
- —
- DSCR
- —
- Eligible?
- —
Personal DTI + credit; lowest rate.
DSCR
20% down · 8.5% · 30yr
- Down + closing
- —
- Monthly P&I
- —
- Monthly cashflow
- —
- DSCR
- —
- Eligible?
- —
No personal income docs; deal must DSCR.
Hard money
10% down · 12.0% · 12mo
- Down + closing
- —
- Monthly P&I
- —
- Monthly cashflow
- —
- DSCR
- —
- Eligible?
- —
Short-term bridge; refi at stabilization.
Listing history 4 events
-
2026-04-18status Pending
-
2026-04-14status Active
-
2026-04-10status Pending
-
2026-04-06$225,000 Active
ⓘ Source: listings_history table (triggers on properties + properties_extension) + one-shot
backfill from property_details.listing_events for pre-trigger history.
Tax reassessment forecast NH · Partial reset (capped growth)
- Current annual tax
- $3,871 · $323/mo
- Projected year-2 tax
- $4,388 · $366/mo
- Expected delta
- +$517/yr (+$43/mo · 13.4%)
ⓘ Screening estimate from a state-policy table — verify with the county assessor before closing.
Climate risk First Street
- Flood 1/10 Low FEMA zone X (unshaded) · 0% chance over 30 yrs
- Wildfire 3/10 Moderate
- Heat 2/10 Low 7 d/yr ≥93°F today · 16 d/yr by 30 yrs out
- Wind 4/10 Moderate 10% chance of damaging wind over 30 yrs
- Air quality 1/10 Low 0 unhealthy d/yr today · 0 by 30 yrs out
Nearby sold comps map
Loading sold comps map…
Walkable amenities ~0.75 mi
Loading nearby amenities…
Taxation est. · year 1
- Rental income
- $19,582
- − Mortgage interest
- −$12,603
- − Property taxes
- −$3,871
- − Insurance
- −$1,125
- − Repairs & maintenance
- −$1,567
- − Management
- −$1,567
- − Depreciation
- −$6,545
- Taxable loss
- −$7,696
- Est. tax savings @ 24.0%
- +$1,847
- After-tax cash flow
- $-1,838/yr
For passive investors: Depreciation is non-cash, so a rental often shows a tax loss while cash-flowing — sheltering income. Rental losses are passive: they offset passive income freely, and up to $25,000/yr can offset ordinary (W-2) income if you actively participate and your MAGI is under $100k (phasing out to $0 by $150k); unused losses carry forward. On sale, claimed depreciation is recaptured at up to 25%, and gains may owe capital-gains tax (a 1031 exchange can defer both). Figures are a year-1 estimate at your 24.0% rate — not tax advice; consult a CPA.
Schools (NCES district)
- District
- Kearsarge Regional School District
- NCES district ID
- 3304040
- Math proficiency
- 44% ▼ -15.00%
- Reading proficiency
- 60% ▼ -3.00%
- Median HH income
- $70,357
- Composite
- 46.33/100
- National rank
- #2467
- State rank
- #30 of 98 in NH
Livability — Warner
- Score
- 61/100
- State rank
- #88
- US rank
- #17455
Category grades
Schools grade is shown separately in the Schools card above.
Census & demographics
- Population (ZIP)
- 3,024
Population outlook (Merrimack County) Hauer SSP2
- Today (2025)
- 151,287 people
- By 2030
- 151,867 · +0.4%
- By 2040
- 149,927 · -0.9%
- By 2050
- 144,081 · -4.8%
- By 2075
- 132,018 · -12.7%
- By 2100
- 111,733 · -26.1%
Race, ethnicity, and origin ACS 2023
- Neighborhood character
- Predominantly White (90%)
- Race & ethnicity
- White 90% Two or more races 7% Hispanic / Latino 3%
- Common ancestry
- Lithuanian 9% Slovak 6% Romanian 5%
- Foreign-born
- 4% · Canada, Vietnam
- Languages at home
- 97% English-only · French/Haitian/Cajun 1% Russian/Polish/Slavic 1% Spanish 1%
Political lean MEDSL · Merrimack
- 2024 margin
- Lean D (+5.2) · D 52.1% · R 46.9% · Other 1.0%
- 2008→2024 swing
- -8.7pp toward R · 2008: 13.9pp · 2024: 5.2pp
- All cycles
- 2024: D+5.2 2020: D+9.8 2016: D+3.1 2012: D+12.7 2008: D+13.9
Not yet ingested
- Civics
- —
Market trends
- HPI YoY
- ▲ 7.60%
- Current HPI
- 344.5119
- Rent YoY
- —
- Metro
- —
- State GDP YoY
- —
- F500 in state
- 0
Price history
4 events — show timeline
- 2026-04-18 Pending — PrimeMLS
- 2026-04-14 Relisted — PrimeMLS
- 2026-04-10 Pending — PrimeMLS
- 2026-04-06 Listed $225,000 PrimeMLS
Property tax history
+3.4%/yrLatest (2025): $3,871 · +96.4% YoY. Source: county tax records.
Cash-flow waterfall
monthlySold comps — $/sqft
last 12 mo · ≤1 miLoading sold comps…