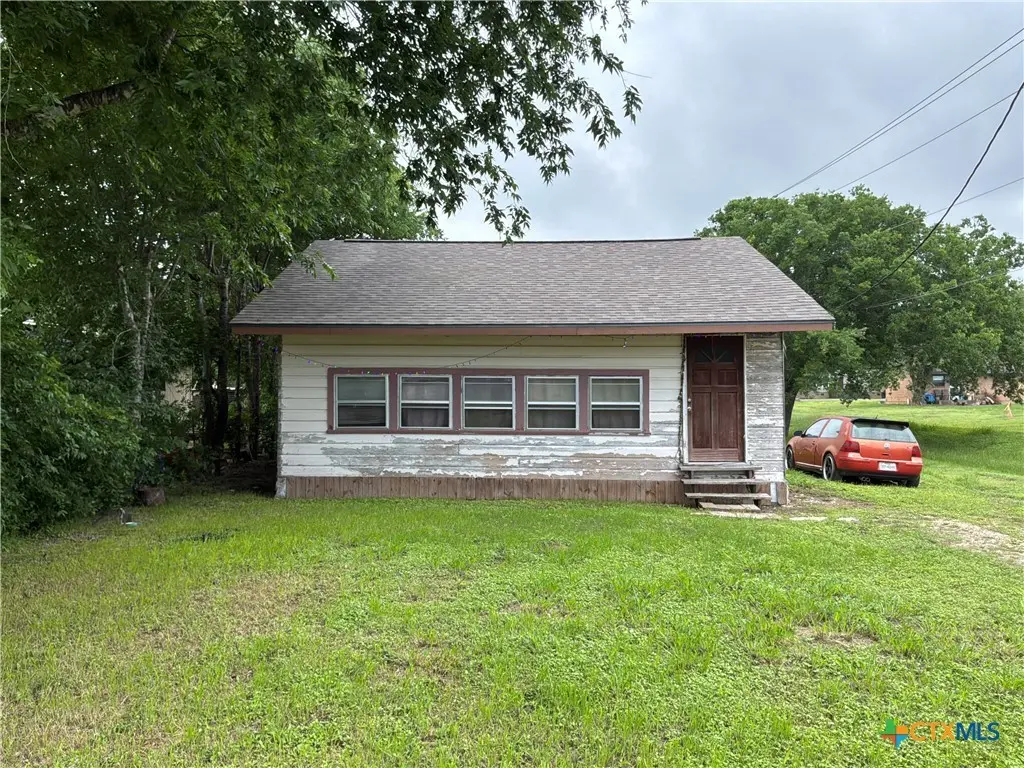
601 E 5th St · Nixon, TX
Flood risk 1/10 · Minimal
- FEMA flood zone
- X (unshaded)
- Chance of flooding over 30 yrs
- 0.0%
- Est. flood insurance / yr
- $507 – $1,088
Fire risk 3/10 · Minor
- Est. fire insurance / yr
- $1,222 – $2,270
Heat risk 8/10 · Major
- Hot days now (above 109°F)
- 7 days/yr
- Hot days in 30 yrs
- 22 days/yr
Wind risk 8/10 · Major
- Chance of severe wind over 30 yrs
- 80.0%
Air-quality risk 1/10 · Minimal
- Unhealthy air days now
- 0 days/yr
- Unhealthy air days in 30 yrs
- 0 days/yr
Risk factors via First Street. Map © Google.
Why this score? — see what drove the A- grade
The composite is a weighted blend of 9 inputs, each scored 0–100. Each bar is that input's sub-score; the figure is the points it added to the 100-point composite (weight × sub-score).
- Cash flow +30.0/30.0
- ARV discount +15.0/15.0
- 1% rule +10.0/10.0
- DSCR +10.0/10.0
- Appreciation +4.9/10.0
- Schools +3.3/10.0
- Livability +3.2/5.0
- Rent growth +2.5/5.0
- Condition / age +2.5/5.0
$55,000
🖨 Deal sheet 📄 Offer letter ✓ Due diligence
Listing remarks
A Diamond in the Rough! Great Income Property! Home needs updating and a little TLC.
Key facts
- 7,000 sq ft lot
- Built 1968
- Listed 4 days
Property features AI
Exterior
- Utilities: Public water; Public sewer
- Home design: Single-story; Resale property
- Construction: Wood siding exterior; Composition/shingle roof; Pillar/post/pier foundation; Year built from assessor
- Exterior features: Chain link fencing; City lot less than a quarter acre; Paved city street frontage
Interior
- Flooring: Carpet; Linoleum
- Bathrooms: 1 full bathroom
- Heating & cooling: Space heater; Wall/window cooling unit(s)
- Interior features: Carpet and linoleum flooring; No additional interior features listed
Neighborhood map
What this means for you Summary
Snapshot
- This is a 2-bed/1.0-bath single-family listed at $55k.
Deal economics
- At list price, monthly cash flow is $346 ($4k/yr) — positive.
- The deal already cash-flows at list — no discount required.
- Meets the 1% rule at list price ($903 rent vs $55k).
Location & tenants
- Location reads 63/100 on livability (#878 in TX) — a middle-class / working-renter tenant base. Strengths: cost of living A+, housing A+; Watch: schools F, amenities F, commute F.
- Nixon-Smiley CISD (rural): math 38% / reading 40% proficiency, ranked #451 of 826 in TX (top 55%) — families likely to look elsewhere, expect single-tenant / working-renter base with shorter leases; 73% free/reduced lunch — lower-income household profile, screen leases tightly.
- Market conditions: 39 active listings in the ZIP; 11 units permitted in Gonzales County in 2024 (0 in 5+ unit buildings).
Forward outlook
- In year one you build about $284 of equity ($380 loan paydown + $-96 appreciation (-0.2% local appreciation)).
- Gonzales County population projected at +17% by 2050 — long-run rental-demand tailwind backs the buy-and-hold thesis.
- At projected returns (-0.2% appreciation + 3.0% rent growth), your $15k cash investment doubles in ~4 years — after that, you're playing with house money.
Negotiation context
- Only 4 days on market — expect competitive offers; lowballing is unlikely to land.
Risks & watch-outs
- Climate carrying-cost: severe wind risk, 80% chance of damaging wind over 30y; extreme-heat days projected 7→22/yr by 2055 (HVAC capex compounding) — expect insurance premiums to compound above CPI over the hold.
Questions for the listing agent
- Built in 1968 — when were the roof, HVAC, electrical panel, plumbing, and water heater last replaced?
- Is there a deadline driving the sale (1031 exchange, divorce, estate, relocation)? That informs how much negotiation room exists.
- Schools are F-rated, which usually means shorter tenancies and higher turnover. Who's the typical renter profile here, and what's been the actual vacancy rate?
- What's the average days-on-market for RENTAL listings here right now (not sales)? A rising rental-DOM trend means longer vacancies and softer asking-rent achievability than the comps imply.
- What's the recent tenant-quality profile in this submarket — average credit score on applications, eviction rate, late-payment / NSF rate, and stable-employment percentage? A property-management company in the area should have these aggregated.
- How much new for-sale + rental construction is in the pipeline within 1–3 miles? Heavy new supply typically softens prices + rents 12–24 months out; constrained supply supports both.
Investment metrics
- 1% rule
- 1.64% ✓
- Cap rate
- 13.84%
- Cash-on-cash
- 26.96%
- DSCR
- 2.20
- GRM
- 5.1
CMA / ARV
- ARV (median comp)
- $92,876
- List price
- $55,000
- Delta
- -40.78%
- Verdict
- UNDERPRICED
- Comps
- 2 within 1.0 mi
Show comp detail 1 sale within ~0.75 mi
| Address | Dist | Beds/Ba | Sqft | Sold | Price | $/sf | Match |
|---|---|---|---|---|---|---|---|
| — | 0.43mi | 2/1.0 | 704 (-7%) | 24mo | $49,900 | $71 | 49 |
Match score weights: distance 35% · size 25% · config 20% · recency 20%. Top-matched comps best support the ARV.
Projected returns pro-forma
-0.17% appreciation · 3.0% rent growth · sell at horizon
- IRR
- 26.9%
- Equity multiple
- 2.30×
- Total profit
- $19,980
- Equity at exit
- $15,491
- IRR
- 30.9%
- Equity multiple
- 4.41×
- Total profit
- $52,504
- Equity at exit
- $18,243
Cash invested: $15,400 (down + closing). Projections, not guarantees.
Landlord ↔ Tenant lean methodology
- Overall (STATE)
- 87 Strongly Landlord-Friendly
- State Texas
- 87 Strongly Landlord-Friendly · R+5
- County
- — inherits STATE
- City
- — inherits STATE
ZIP-level market 78140
- Home prices YoY
- -0.1%
- Active inventory
- 39
- Price-to-rent
- 5.1×
Monthly cashflow live
- Estimated rent
- $903 medium interval (Pro) →
- Mortgage (P&I)
- −$288
- Tax from tax record
- −$56 /mo · $675/yr
- Insurance
- −$23
- HOA
- −$0
- Vacancy / Maint / Mgmt
- −$190
- Net cashflow
- $346
Break-even live
UW: 25.0% down · 7.5% · 30yr · 1.5% tax · 5.0% vac · 8.0% maint · 8.0% mgmt
Financing live
Cash to close
- Down payment
- $13,750
- Closing costs
- $1,650
- Reserves months
- —
- Total cash needed
- —
Loan-product check · same deal, 3 products live
Conventional
25% down · 7.5% · 30yr
- Down + closing
- —
- Monthly P&I
- —
- Monthly cashflow
- —
- DSCR
- —
- Eligible?
- —
Personal DTI + credit; lowest rate.
DSCR
20% down · 8.5% · 30yr
- Down + closing
- —
- Monthly P&I
- —
- Monthly cashflow
- —
- DSCR
- —
- Eligible?
- —
No personal income docs; deal must DSCR.
Hard money
10% down · 12.0% · 12mo
- Down + closing
- —
- Monthly P&I
- —
- Monthly cashflow
- —
- DSCR
- —
- Eligible?
- —
Short-term bridge; refi at stabilization.
Listing history 2 events
-
2026-05-08status Pending 84-char remark
-
2026-05-05$55,000 Active 84-char remark
ⓘ Source: listings_history table (triggers on properties + properties_extension) + one-shot
backfill from property_details.listing_events for pre-trigger history.
Tax reassessment forecast TX · Resets to sale price
- Current annual tax
- $675 · $56/mo
- Projected year-2 tax
- $1,006 · $84/mo
- Expected delta
- +$332/yr (+$28/mo · 49.1%)
ⓘ Screening estimate from a state-policy table — verify with the county assessor before closing.
Climate risk First Street
- Flood 1/10 Low FEMA zone X (unshaded) · 0% chance over 30 yrs
- Wildfire 3/10 Moderate
- Heat 8/10 Severe 7 d/yr ≥109°F today · 22 d/yr by 30 yrs out
- Wind 8/10 Severe 80% chance of damaging wind over 30 yrs
- Air quality 1/10 Low 0 unhealthy d/yr today · 0 by 30 yrs out
Nearby sold comps map
Loading sold comps map…
Walkable amenities ~0.75 mi
Loading nearby amenities…
Taxation est. · year 1
- Rental income
- $10,838
- − Mortgage interest
- −$3,081
- − Property taxes
- −$675
- − Insurance
- −$275
- − Repairs & maintenance
- −$867
- − Management
- −$867
- − Depreciation
- −$1,600
- Taxable income
- $3,473
- Est. tax owed @ 24.0%
- −$834
- After-tax cash flow
- $3,318/yr
For passive investors: Depreciation is non-cash, so a rental often shows a tax loss while cash-flowing — sheltering income. Rental losses are passive: they offset passive income freely, and up to $25,000/yr can offset ordinary (W-2) income if you actively participate and your MAGI is under $100k (phasing out to $0 by $150k); unused losses carry forward. On sale, claimed depreciation is recaptured at up to 25%, and gains may owe capital-gains tax (a 1031 exchange can defer both). Figures are a year-1 estimate at your 24.0% rate — not tax advice; consult a CPA.
Schools (NCES district)
- District
- Nixon-Smiley CISD
- NCES district ID
- 4832740
- Math proficiency
- 38% ▼ -5.00%
- Reading proficiency
- 40% ▬ 0.00%
- Median HH income
- $38,887
- Composite
- 32.6/100
- National rank
- #5674
- State rank
- #451 of 826 in TX
Livability — Nixon
- Score
- 63/100
- State rank
- #878
- US rank
- #15855
Category grades
Schools grade is shown separately in the Schools card above.
Census & demographics
- Census place
- Nixon, TX
- Population (ZIP)
- 3,190
Population outlook (Gonzales County) Hauer SSP2
- Today (2025)
- 22,246 people
- By 2030
- 23,060 · +3.7%
- By 2040
- 24,661 · +10.9%
- By 2050
- 26,046 · +17.1%
- By 2075
- 29,289 · +31.7%
- By 2100
- 30,112 · +35.4%
Race, ethnicity, and origin ACS 2023
- Neighborhood character
- Predominantly Hispanic (70%)
- Race & ethnicity
- Hispanic / Latino 70% White 27% Two or more races 23% Black 1%
- Hispanic origin (detail)
- Mexican 61%
- Common ancestry
- Romanian 2% Lithuanian 2% Slovak 1%
- Foreign-born
- 16% · Canada
- Languages at home
- 56% English-only · Spanish 44%
Political lean MEDSL · Gonzales
- 2024 margin
- Solid R (+54.8) · D 22.3% · R 77.1%
- 2008→2024 swing
- -24.5pp toward R · 2008: -30.4pp · 2024: -54.8pp
- All cycles
- 2024: R+54.8 2020: R+48.1 2016: R+47.8 2012: R+40.4 2008: R+30.4
Not yet ingested
- Civics
- —
Market trends
- HPI YoY
- ▼ -0.17%
- Current HPI
- 151.751
- Rent YoY
- —
- Metro
- —
- State GDP YoY
- ▲ 3.95%
- F500 in state
- 110
Industry mix (Fortune 500 HQ in TX)
| Industry | F500 HQs | Revenue |
|---|---|---|
| Energy | 16 | $1,198B |
|
||
| Technology | 5 | $198B |
|
||
| Engineering / Construction | 4 | $72B |
|
||
| Energy Services | 3 | $60B |
|
||
| Utilities | 3 | $41B |
|
||
| Healthcare | 2 | $330B |
|
||
Price history
2 events — show timeline
- 2026-05-08 Pending — CTXMLS
- 2026-05-05 Listed $55,000 CTXMLS
Property tax history
+5.9%/yrLatest (2025): $675 · +13.0% YoY. Source: county tax records.
Cash-flow waterfall
monthlySold comps — $/sqft
last 12 mo · ≤1 miLoading sold comps…