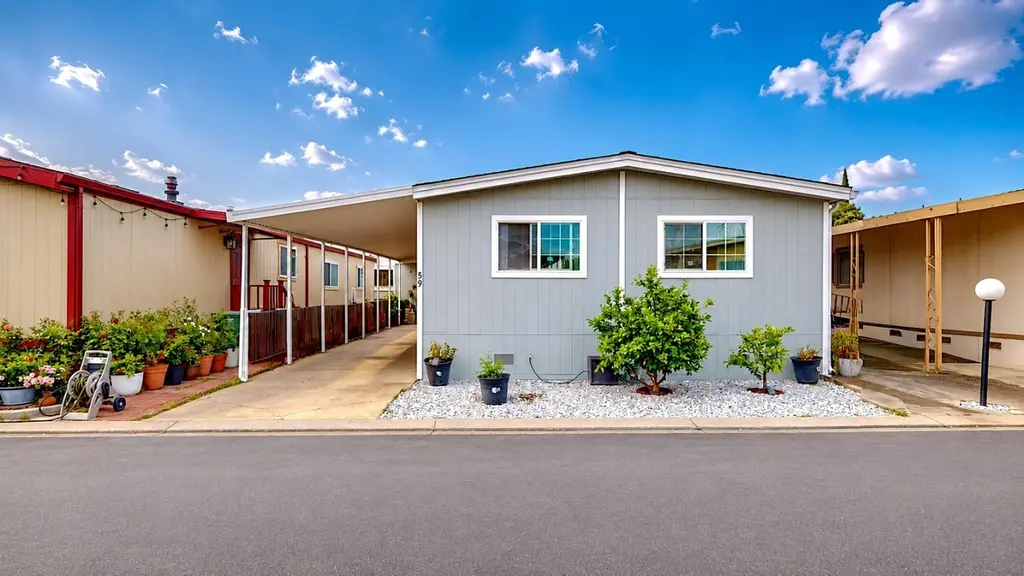
812 W Clover Rd #59 · Tracy, CA
Flood risk 1/10 · Minimal
- FEMA flood zone
- X (unshaded)
- Chance of flooding over 30 yrs
- 0.0%
- Est. flood insurance / yr
- $507 – $1,088
Fire risk 2/10 · Minimal
- Est. fire insurance / yr
- $659 – $1,223
Heat risk 7/10 · Major
- Hot days now (above 103°F)
- 7 days/yr
- Hot days in 30 yrs
- 15 days/yr
Wind risk 1/10 · Minimal
- Chance of severe wind over 30 yrs
- —
Air-quality risk 10/10 · Severe
- Unhealthy air days now
- 25 days/yr
- Unhealthy air days in 30 yrs
- 26 days/yr
Risk factors via First Street. Map © Google.
Why this score? — see what drove the C- grade
The composite is a weighted blend of 9 inputs, each scored 0–100. Each bar is that input's sub-score; the figure is the points it added to the 100-point composite (weight × sub-score).
- Cash flow +25.7/30.0
- DSCR +8.6/10.0
- 1% rule +6.8/10.0
- Condition / age +4.0/5.0
- Rent growth +3.3/5.0
- Livability +3.1/5.0
- Schools +2.8/10.0
- ARV discount +0.0/15.0
- Appreciation +0.0/10.0
$249,950
🖨 Deal sheet (PDF) 📄 Offer letter ✓ Due diligence
Listing remarks
Completely remodeled 4-bedroom, 2-bath home located in the desirable Orchard Estates Mobile Home Community. This move-in ready residence has been extensively updated throughout and offers the look and feel of a traditional site-built home. Recent improvements include a fully renovated kitchen, updated flooring, fresh interior finishes, modern lighting fixtures, updated walls, and numerous additional upgrades. The spacious floor plan provides comfortable living areas, generously sized bedrooms, and ample storage throughout. The primary suite features a private bathroom, while the additional bedrooms offer flexibility for family, guests, or a home office. Outside, you'll find a detached stora
Key facts
- Remodeled home
- Parking
- Built 1983
Tags
Property features AI
Finance
- Financial info: Land lease: No (listed land lease amount present but property shows as not land leased)
- HOA & community: No association; Not a senior community
Exterior
- Parking: Covered parking
- Utilities: Public water; Public sewer; 220V outlet in kitchen
- Home design: Manufactured home located in a park; Double wide; Updated/remodeled; Built in 1983; Canterbury model by Golden West Homes
- Construction: Composition roof
- Exterior features: Close to clubhouse; Storage structure
Interior
- Kitchen: Free standing gas range; Free standing refrigerator; Breakfast area; Stone countertops
- Bedrooms: 4 bedrooms (including master bedroom)
- Flooring: Laminate flooring
- Bathrooms: 2 full bathrooms; Tub with shower over
- Heating & cooling: Central heating; Central air conditioning; Ceiling fans
- Interior features: Updated/remodeled interior; Breakfast nook and dining/living combo; Breakfast area; Stone counters; Living room with additional features
- Laundry & utility: Stacked washer and dryer included; Dedicated laundry area
Neighborhood map
What this means for you Summary
Snapshot
- This is a 4-bed/2.0-bath manufactured listed at $250k. Condition is rated good.
Deal economics
- At list price, monthly cash flow is $598 ($7k/yr) — positive.
- The deal already cash-flows at list — no discount required.
- Meets the 1% rule at list price ($3k rent vs $250k).
- Recommended offer: $246k (1.5% below list) — sets the bar for market timing.
- Cap rate 9.2% vs local median 2.6% in Tracy — top-decile yield for the area; either an underpriced asset or a hidden risk that comps aren't pricing in. Stress-test before assuming the spread holds.
Location & tenants
- Location reads 62/100 on livability (#496 in CA) — a middle-class / working-renter tenant base. Strengths: employment A+, housing A+; Watch: amenities F, commute F, cost of living F.
- Tracy Joint Unified (suburban): math 22% / reading 37% proficiency, ranked #305 of 517 in CA (top 59%) — low school quality limits family demand, transient renter base, plan for 1-2y turnover.
- Zoned schools: Melville S. Jacobson Elementary (math 18% / reading 27%, grade F, #1,168 of 1,571 statewide, top 75%, 583 students, 70% FRL); Monte Vista Middle (math 16% / reading 28%, grade F, #388 of 498 statewide, top 80%, 751 students, 70% FRL); Merrill F. West High (math 24% / reading 54%, grade F, #558 of 1,170 statewide, top 48%, 2,108 students, 54% FRL) — zoned schools average 64% FRL vs 44% district-wide (21 pts higher); higher-poverty schools than district average — tighter screening recommended.
- Market conditions: Rents rising (+3.2%/yr); 166 active listings in the ZIP; 8 comparable units currently listed for rent nearby; rentals leasing fast (median 5d on market — plan ~1-2 weeks tenant-placement turnaround); solid renter incomes; 3,779 units permitted in San Joaquin County in 2024 (0 in 5+ unit buildings).
- This rent runs 34% of the median local income ($103k/yr) — at the standard rent-burdened threshold; future hikes will face affordability resistance.
Forward outlook
- Local home prices are declining (-3.0%/yr); year-one equity from $2k of loan paydown is wiped out by about $7k of value loss. Plan a longer hold.
- San Joaquin County population projected at +17% by 2050 — long-run rental-demand tailwind backs the buy-and-hold thesis.
Negotiation context
- It's been on market 19 days — a 2% lower offer ($246k) is reasonable based on typical stale-listing flexibility.
Risks & watch-outs
- Climate carrying-cost: extreme-heat days projected 7→15/yr by 2055 (HVAC capex compounding) — expect insurance premiums to compound above CPI over the hold.
Questions for the listing agent
- Is there a deadline driving the sale (1031 exchange, divorce, estate, relocation)? That informs how much negotiation room exists.
- Schools are D-rated, which usually means shorter tenancies and higher turnover. Who's the typical renter profile here, and what's been the actual vacancy rate?
- What's the average days-on-market for RENTAL listings here right now (not sales)? A rising rental-DOM trend means longer vacancies and softer asking-rent achievability than the comps imply.
- What's the recent tenant-quality profile in this submarket — average credit score on applications, eviction rate, late-payment / NSF rate, and stable-employment percentage? A property-management company in the area should have these aggregated.
- How much new for-sale + rental construction is in the pipeline within 1–3 miles? Heavy new supply typically softens prices + rents 12–24 months out; constrained supply supports both.
Investment metrics
- 1% rule
- 1.18% ✓
- Cap rate
- 9.17%
- Cash-on-cash
- 10.26%
- DSCR
- 1.46
- GRM
- 7.1
CMA / ARV
- ARV (on-the-fly)
- $202,500
- Comps found
- 3
Show comp detail 3 sales within ~0.75 mi
| Address | Dist | Beds/Ba | Sqft | Sold | Price | $/sf | Match |
|---|---|---|---|---|---|---|---|
| 812 W Clover Rd #74 | 0.00mi | 3/2.0 (-1) | 1,344 (-0%) | 6mo | $205,000 | $153 | 89 |
| 812 W Clover Rd #89 | 0.03mi | 3/2.0 (-1) | 1,344 (-0%) | 7mo | $202,000 | $150 | 87 |
| 812 W Clover Rd #17 #17 | 0.04mi | 3/2.0 (-1) | 1,400 (+4%) | 22mo | $210,000 | $150 | 68 |
Match score weights: distance 35% · size 25% · config 20% · recency 20%. Top-matched comps best support the ARV.
Projected returns pro-forma
-3.0% appreciation · 3.24% rent growth · sell at horizon
- IRR
- -0.6%
- Equity multiple
- 0.98×
- Total profit
- $-1,629
- Equity at exit
- $37,268
- IRR
- 9.3%
- Equity multiple
- 1.73×
- Total profit
- $50,781
- Equity at exit
- $21,611
Cash invested: $69,986 (down + closing). Projections, not guarantees.
Landlord ↔ Tenant lean methodology
- Overall (STATE)
- 18 Strongly Tenant-Friendly
- State California
- 18 Strongly Tenant-Friendly · D+13
- County
- — inherits STATE
- City
- — inherits STATE
ZIP-level market 95376
- Rents YoY
- 3.2%
- Active inventory
- 166
- Price-to-rent
- 7.1×
Monthly cashflow live
- Estimated rent
- $2,944 high interval (Pro) →
- Mortgage (P&I)
- −$1,311
- Tax est. 1.5%
- −$312 /mo · $3,749/yr
- Insurance
- −$104
- HOA
- −$0
- Vacancy / Maint / Mgmt
- −$618
- Net cashflow
- $598
Break-even live
Sensitivity live
| Price | -10% $771 | -5% $685 | +0% $598 | +5% $512 | +10% $426 |
|---|---|---|---|---|---|
| Rent | -10% $366 | -5% $482 | +0% $598 | +5% $715 | +10% $831 |
| Rate | -1.0pp $724 | -0.5pp $662 | base $598 | +0.5pp $534 | +1.0pp $468 |
UW: 25.0% down · 7.5% · 30yr · 1.5% tax · 5.0% vac · 8.0% maint · 8.0% mgmt
Financing live
Cash to close
- Down payment
- $62,488
- Closing costs
- $7,498
- Reserves months
- —
- Total cash needed
- —
Loan-product check · same deal, 3 products live
Conventional
25% down · 7.5% · 30yr
- Down + closing
- —
- Monthly P&I
- —
- Monthly cashflow
- —
- DSCR
- —
- Eligible?
- —
Personal DTI + credit; lowest rate.
DSCR
20% down · 8.5% · 30yr
- Down + closing
- —
- Monthly P&I
- —
- Monthly cashflow
- —
- DSCR
- —
- Eligible?
- —
No personal income docs; deal must DSCR.
Hard money
10% down · 12.0% · 12mo
- Down + closing
- —
- Monthly P&I
- —
- Monthly cashflow
- —
- DSCR
- —
- Eligible?
- —
Short-term bridge; refi at stabilization.
Rent comps 8 comps
| Address | Beds | Baths | Sqft | Rent | $/sqft | DOM | Units | Dist |
|---|---|---|---|---|---|---|---|---|
| 498 Hintz Ave Tracy, CA | 3.0 | 1.5 | 1084 | $2,420 | $2.23 | 4d | 1 | 0.28mi |
| 2921 Alene Ave Tracy, CA | 3.0 | 1.5 | 1084 | $2,400 | $2.21 | 25d | 1 | 0.29mi |
| 2680 Bonifacio Dr Tracy, CA | 3.0 | 2.0 | 1332 | $3,000 | $2.25 | 5d | 1 | 0.32mi |
| 3440 Buthmann Ave Tracy, CA | 3.0 | 2.0 | 1068 | $2,550 | $2.39 | 20d | 1 | 0.42mi |
| 950 W Grant Line Rd Tracy, CA | 1.0–3.0 | 1.0–2.0 | 821 | $2,685 | $3.27 | 4d | 15 | 0.43mi |
| 1603 Swarthout Ct Unit 1603 Tracy, CA | 3.0 | 1.5 | 1300 | $2,495 | $1.92 | 4d | 1 | 0.59mi |
| 1720 Bessie Ave Tracy, CA | 3.0 | 1.0 | 1080 | $2,475 | $2.29 | 4d | 1 | 0.86mi |
| 115 E Emerson Ave Tracy, CA | 3.0 | 2.0 | 1112 | $2,475 | $2.23 | 23d | 1 | 1.09mi |
Listing history 14 events
-
2026-06-21days on market $249,950 Active 19 DOM
-
2026-06-18days on market $249,950 Active 16 DOM
-
2026-06-17days on market $249,950 Active 15 DOM
-
2026-06-16days on market $249,950 Active 14 DOM
-
2026-06-15days on market $249,950 Active 13 DOM
-
2026-06-14days on market $249,950 Active 11 DOM
-
2026-06-13days on market $249,950 Active 10 DOM
-
2026-06-10days on market $249,950 Active 8 DOM
-
2026-06-09days on market $249,950 Active 7 DOM
-
2026-06-08days on market $249,950 Active 6 DOM
-
2026-06-07days on market $249,950 Active 5 DOM
-
2026-06-05days on market $249,950 Active 2 DOM
-
2026-06-03remarks 699-char remark
-
2026-06-03$249,950 Active 1 DOM
ⓘ Source: listings_history table (triggers on properties + properties_extension) + one-shot
backfill from property_details.listing_events for pre-trigger history.
Climate risk First Street
- Flood 1/10 Low FEMA zone X (unshaded) · 0% chance over 30 yrs
- Wildfire 2/10 Low
- Heat 7/10 Severe 7 d/yr ≥103°F today · 15 d/yr by 30 yrs out
- Wind 1/10 Low
- Air quality 10/10 Extreme 25 unhealthy d/yr today · 26 by 30 yrs out
Nearby sold comps map
Loading sold comps map…
Walkable amenities ~0.75 mi
Loading nearby amenities…
Taxation est. · year 1
- Rental income
- $35,329
- − Mortgage interest
- −$14,001
- − Property taxes
- −$3,749
- − Insurance
- −$1,250
- − Repairs & maintenance
- −$2,826
- − Management
- −$2,826
- − Depreciation
- −$7,271
- Taxable income
- $3,405
- Est. tax owed @ 24.0%
- −$817
- After-tax cash flow
- $6,364/yr
For passive investors: Depreciation is non-cash, so a rental often shows a tax loss while cash-flowing — sheltering income. Rental losses are passive: they offset passive income freely, and up to $25,000/yr can offset ordinary (W-2) income if you actively participate and your MAGI is under $100k (phasing out to $0 by $150k); unused losses carry forward. On sale, claimed depreciation is recaptured at up to 25%, and gains may owe capital-gains tax (a 1031 exchange can defer both). Figures are a year-1 estimate at your 24.0% rate — not tax advice; consult a CPA.
Condition & rehab AI · 12 photos
This move-in ready manufactured home in Orchard Estates Mobile Home Community has been extensively updated with a fresh exterior, updated kitchen and bathrooms, and fresh interior finishes. It offers a spacious floor plan with comfortable living areas and ample storage.
Value-add opportunities
- Resale paint exterior — fresh paint enhances curb appeal
- Resale update landscaping — improved landscaping can increase curb appeal
- Both install smart home features — enhances comfort and energy efficiency
Renovation cost estimate screening
Value-add ROI direction
- Resale paint exterior — fresh paint enhances curb appeal ↑
- Resale update landscaping — improved landscaping can increase curb appeal ↑
- Both install smart home features — enhances comfort and energy efficiency ↑
ⓘ Cost ranges are severity-bucket heuristics (US national rule-of-thumb). Get contractor quotes + a written scope before underwriting a rehab budget.
Schools (NCES district)
- District
- Tracy Joint Unified
- NCES district ID
- 0600047
- Math proficiency
- 22% ▼ -9.00%
- Reading proficiency
- 37% ▼ -7.00%
- Median HH income
- $73,095
- Composite
- 27.94/100
- National rank
- #6862
- State rank
- #305 of 517 in CA
Livability — Tracy
- Score
- 62/100
- State rank
- #496
- US rank
- #16717
Category grades
Schools grade is shown separately in the Schools card above.
Census & demographics
- Census place
- Tracy, CA
- County
- San Joaquin County · 729,570 people
- City population
- 133,642
- Metro
- Stockton, CA
- Population (ZIP)
- 54,488
- Household income
- $102,555
- Rent vs Own
- Severe rent burden
- 1328.0
Population outlook (San Joaquin County) Hauer SSP2
- Today (2025)
- 796,965 people
- By 2030
- 828,849 · +4.0%
- By 2040
- 885,611 · +11.1%
- By 2050
- 929,798 · +16.7%
- By 2075
- 994,578 · +24.8%
- By 2100
- 971,291 · +21.9%
Race, ethnicity, and origin ACS 2023
- Neighborhood character
- Diverse neighborhood (Simpson 0.66)
- Race & ethnicity
- Hispanic / Latino 50% White 27% Two or more races 21% Asian 13% Black 5% Native American 1%
- Hispanic origin (detail)
- Mexican 40% Puerto Rican 1%
- Common ancestry
- Russian 3% Lithuanian 2% Italian 1%
- Foreign-born
- 26% · Canada, China, Vietnam
- Languages at home
- 56% English-only · Spanish 30% Other Indo-European 7% Tagalog/Filipino 2%
Political lean MEDSL · San Joaquin
- 2024 margin
- Toss-up / Even · D 48.0% · R 48.9% · Other 3.0%
- 2008→2024 swing
- -11.6pp toward R · 2008: 10.7pp · 2024: -0.9pp
- All cycles
- 2024: R+0.9 2020: D+13.9 2016: D+12.9 2012: D+8.9 2008: D+10.7
Not yet ingested
- Civics
- —
Market trends
- HPI YoY
- ▼ -436.54%
- Current HPI
- 255.8813
- Rent YoY
- ▲ 3.24%
- Metro
- Stockton, CA
- State GDP YoY
- ▲ 3.21%
- F500 in state
- 116
Industry mix (Fortune 500 HQ in CA)
| Industry | F500 HQs | Revenue |
|---|---|---|
| Technology | 27 | $1,492B |
|
||
| Financial Services | 3 | $174B |
|
||
| Retail | 3 | $44B |
|
||
| Insurance | 3 | $26B |
|
||
| Media / Entertainment | 2 | $115B |
|
||
| Pharmaceuticals / Biotech | 2 | $62B |
|
||
Cash-flow waterfall
monthlySold comps — $/sqft
last 12 mo · ≤1 miLoading sold comps…