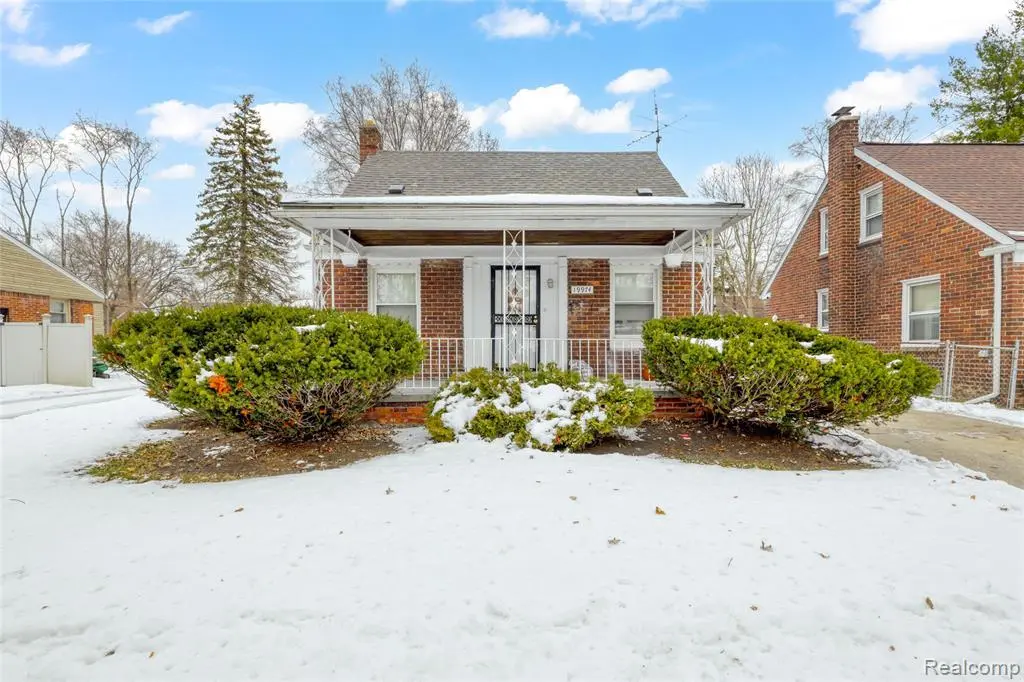
19974 Charest St · Detroit, MI
Flood risk 7/10 · Major
- FEMA flood zone
- X (unshaded)
- Chance of flooding over 30 yrs
- 0.96%
- Est. flood insurance / yr
- $473 – $860
Fire risk 1/10 · Minimal
- Est. fire insurance / yr
- $784 – $1,456
Heat risk 3/10 · Minor
- Hot days now (above 97°F)
- 7 days/yr
- Hot days in 30 yrs
- 15 days/yr
Wind risk 2/10 · Minimal
- Chance of severe wind over 30 yrs
- —
Air-quality risk 4/10 · Minor
- Unhealthy air days now
- 4 days/yr
- Unhealthy air days in 30 yrs
- 6 days/yr
Risk factors via First Street. Map © Google.
Why this score? — see what drove the C grade
The composite is a weighted blend of 9 inputs, each scored 0–100. Each bar is that input's sub-score; the figure is the points it added to the 100-point composite (weight × sub-score).
- Cash flow +29.4/30.0
- DSCR +10.0/10.0
- 1% rule +8.2/10.0
- Rent growth +4.2/5.0
- Livability +3.7/5.0
- Condition / age +2.5/5.0
- Schools +1.3/10.0
- ARV discount +0.0/15.0
- Appreciation +0.0/10.0
$99,999
🖨 Deal sheet 📄 Offer letter ✓ Due diligence
Listing remarks MLS
Welcome to the perfect starter home! This beautifully updated bungalow is ideally located within walking distance of the award-winning Renaissance High School and near Peterson Playfield, where you'll find a tennis court, basketball court, baseball and football fields, picnic areas, a playground, and scenic walking/running paths. Enjoy the convenience of being just minutes from the Northwest Activities Center, The Avenue of Fashion, Detroit Golf Club, Palmer Park, restaurants, gas stations, major freeways, and more! Inside, you'll fall in love with the beautifully updated interior. The kitchen boasts ample cabinet space with stylish shaker cabinets and durable laminate flooring. Great for a first-time home buyer or an investor bringing in positive rental income!
Key facts
- Tennis court
- Basketball court
- Baseball fields
Tags
Property features AI
Exterior
- Parking: Detached 1-car garage
- Utilities: Public water; Public sewer
- Home design: Single family residence; One and one-half stories; Ground-level entry with steps; Brick construction
- Construction: Brick/mortar foundation
- Exterior features: Paved road access; Lot roughly 41 x 100.43 (0.1 acre)
Interior
- Bathrooms: 1 full bathroom
- Heating & cooling: Forced air heating; Electric heating; Natural gas heating; No cooling
- Interior features: Unfinished basement; Total of 6 rooms
Neighborhood map
What this means for you Summary
Snapshot
- This is a 3-bed/1.0-bath single-family listed at $100k.
Deal economics
- At list price, monthly cash flow is $299 ($4k/yr) — positive.
- The deal already cash-flows at list — no discount required.
- Meets the 1% rule at list price ($1k rent vs $100k).
- Recommended offer: $97k (3.0% below list) — sets the bar for market timing.
Location & tenants
- Location reads 73/100 on livability (#218 in MI) — a middle-class / working-renter tenant base. Strengths: amenities A+, commute A+, cost of living A+; Watch: schools F, crime F, employment F.
- Detroit Public Schools Community District (urban): math 10% / reading 24% proficiency, ranked #499 of 540 in MI (top 92%) — low school quality limits family demand, transient renter base, plan for 1-2y turnover; 90% free/reduced lunch — lower-income household profile, screen leases tightly.
- Market conditions: Rents rising fast (+6.7%/yr); 226 active listings in the ZIP; 30 comparable units currently listed for rent nearby; rentals at typical pace (median 18d on market — plan ~3-4 weeks tenant-placement turnaround); lower-income renter base — watch delinquency; 2,639 units permitted in Wayne County in 2024 (1,216 in 5+ unit buildings).
- This rent runs 45% of the median local income ($35k/yr) — at the standard rent-burdened threshold; future hikes will face affordability resistance.
Forward outlook
- Local home prices are declining (-3.0%/yr); year-one equity from $691 of loan paydown is wiped out by about $3k of value loss. Plan a longer hold.
- Wayne County population projected at -17% by 2050 — secular population decline; favor cash flow + early exit over multi-decade hold.
- At projected returns (-3.0% appreciation + 6.7% rent growth), your $28k cash investment doubles in ~7 years — after that, you're playing with house money.
Negotiation context
- It's been on market 35 days — a 3% lower offer ($97k) is reasonable based on typical stale-listing flexibility.
- 15 sale attempts since 23y ago with the ask held roughly flat each time — persistent listings suggest the price (not the market) is what's stuck; bring a comps-based counter.
- Current owner paid $70k; 43% above their basis — modest negotiation headroom, anchor on the comps not their cost.
Risks & watch-outs
- Watch-outs: flood insurance adds $56/mo; built in 1943 — expect roof / HVAC / electrical / plumbing capex.
- Climate carrying-cost: major flood risk — expect insurance premiums to compound above CPI over the hold.
Questions for the listing agent
- It's been on market 35 days. Have you received any prior offers? Is the seller open to a 3% concession, seller financing, or rate buy-down credit?
- Built in 1943 — when were the roof, HVAC, electrical panel, plumbing, and water heater last replaced?
- What's the actual annual flood-insurance premium (NFIP or private), and is the property in a SFHA with mandatory coverage?
- Is there a deadline driving the sale (1031 exchange, divorce, estate, relocation)? That informs how much negotiation room exists.
- Schools are F-rated, which usually means shorter tenancies and higher turnover. Who's the typical renter profile here, and what's been the actual vacancy rate?
- Crime grade is F in this area — have there been break-ins, vandalism, or insurance claims at this property in the last 3 years? What carrier currently insures it and at what premium?
- What's the average days-on-market for RENTAL listings here right now (not sales)? A rising rental-DOM trend means longer vacancies and softer asking-rent achievability than the comps imply.
- What's the recent tenant-quality profile in this submarket — average credit score on applications, eviction rate, late-payment / NSF rate, and stable-employment percentage? A property-management company in the area should have these aggregated.
- How much new for-sale + rental construction is in the pipeline within 1–3 miles? Heavy new supply typically softens prices + rents 12–24 months out; constrained supply supports both.
Investment metrics
- 1% rule
- 1.32% ✓
- Cap rate
- 10.54%
- Cash-on-cash
- 15.18%
- DSCR
- 1.68
- GRM
- 6.3
CMA / ARV
- ARV (median comp)
- $73,958
- List price
- $99,999
- Delta
- 35.21%
- Verdict
- OVERPRICED
- Comps
- 20 within 1.0 mi
Show comp detail 12 sales within ~0.75 mi
| Address | Dist | Beds/Ba | Sqft | Sold | Price | $/sf | Match |
|---|---|---|---|---|---|---|---|
| 20180 Charest St | 0.16mi | 3/1.0 | 840 (0%) | 4mo | $45,000 | $54 | 89 |
| 20156 Gallagher St | 0.14mi | 2/1.0 (-1) | 850 (+1%) | 8mo | $67,000 | $79 | 80 |
| 20012 Binder St | 0.36mi | 3/1.0 | 871 (+4%) | 3mo | $50,500 | $58 | 74 |
| 19619 Norwood St | 0.29mi | 3/1.0 | 941 (+12%) | 2mo | $30,500 | $32 | 65 |
| 19444 Yonka St | 0.38mi | 3/1.0 | 900 (+7%) | 8mo | $85,000 | $94 | 64 |
| 19300 Binder St | 0.55mi | 2/1.0 (-1) | 820 (-2%) | 4mo | $10,000 | $12 | 62 |
| 20270 Dean Ave | 0.52mi | 3/1.0 | 792 (-6%) | 7mo | $55,000 | $69 | 60 |
| 19227 Ryan Rd | 0.61mi | 3/1.0 | 919 (+9%) | 1mo | $38,000 | $41 | 55 |
| 20892 Dean St | 0.72mi | 2/1.0 (-1) | 840 (0%) | 9mo | $136,500 | $163 | 54 |
| 19667 Sunset St | 0.53mi | 3/1.5 | 752 (-10%) | 4mo | $28,500 | $38 | 52 |
| 19255 Binder St | 0.56mi | 2/1.0 (-1) | 719 (-14%) | 3mo | $38,500 | $54 | 42 |
| 19235 Fleming St | 0.62mi | 2/1.0 (-1) | 720 (-14%) | 6mo | $57,000 | $79 | 38 |
Match score weights: distance 35% · size 25% · config 20% · recency 20%. Top-matched comps best support the ARV.
Projected returns pro-forma
-3.0% appreciation · 6.72% rent growth · sell at horizon
- IRR
- 7.0%
- Equity multiple
- 1.29×
- Total profit
- $8,013
- Equity at exit
- $14,910
- IRR
- 19.5%
- Equity multiple
- 2.94×
- Total profit
- $54,458
- Equity at exit
- $8,646
Cash invested: $28,000 (down + closing). Projections, not guarantees.
Landlord ↔ Tenant lean methodology
- Overall (STATE)
- 62 Landlord-Friendly
- State Michigan
- 62 Landlord-Friendly · EVEN
- County
- — inherits STATE
- City
- — inherits STATE
ZIP-level market 48234
- Home prices YoY
- -11.9%
- Rents YoY
- 6.7%
- Active inventory
- 226
- Price-to-rent
- 6.3×
Monthly cashflow live
- Estimated rent
- $1,323 high interval (Pro) →
- Mortgage (P&I)
- −$524
- Tax est. 1.5%
- −$125 /mo · $1,500/yr
- Insurance
- −$42
- Flood insurance flood zone
- −$56 /mo · $666/yr
- HOA
- −$0
- Vacancy / Maint / Mgmt
- −$278
- Net cashflow
- $299
Break-even live
UW: 25.0% down · 7.5% · 30yr · 1.5% tax · 5.0% vac · 8.0% maint · 8.0% mgmt
Financing live
Cash to close
- Down payment
- $25,000
- Closing costs
- $3,000
- Reserves months
- —
- Total cash needed
- —
Loan-product check · same deal, 3 products live
Conventional
25% down · 7.5% · 30yr
- Down + closing
- —
- Monthly P&I
- —
- Monthly cashflow
- —
- DSCR
- —
- Eligible?
- —
Personal DTI + credit; lowest rate.
DSCR
20% down · 8.5% · 30yr
- Down + closing
- —
- Monthly P&I
- —
- Monthly cashflow
- —
- DSCR
- —
- Eligible?
- —
No personal income docs; deal must DSCR.
Hard money
10% down · 12.0% · 12mo
- Down + closing
- —
- Monthly P&I
- —
- Monthly cashflow
- —
- DSCR
- —
- Eligible?
- —
Short-term bridge; refi at stabilization.
Rent comps 30 comps
| Address | Beds | Baths | Sqft | Rent | $/sqft | DOM | Units | Dist |
|---|---|---|---|---|---|---|---|---|
| 19694 Gallagher St Detroit, MI | 3.0 | 1.0 | 1000 | $1,150 | $1.15 | 15d | 1 | 0.21mi |
| 20255 Harned St Detroit, MI | 3.0 | 1.0 | 1000 | $1,374 | $1.37 | 16d | 1 | 0.23mi |
| 19450 Norwood St Detroit, MI | 3.0 | 1.0 | 1000 | $1,200 | $1.20 | 5d | 1 | 0.38mi |
| 19930 Binder St Detroit, MI | 3.0 | 1.0 | 1000 | $1,450 | $1.45 | 16d | 1 | 0.39mi |
| 19360 Revere St Detroit, MI | 3.0 | 1.0 | 1050 | $1,250 | $1.19 | 24d | 1 | 0.42mi |
| 21155 Warner Ave Warren, MI | 2.0 | 1.0 | 756 | $1,029 | $1.36 | 24d | 1 | 0.67mi |
| 2034 John B Ave Warren, MI | 3.0 | 1.0 | 920 | $1,261 | $1.37 | 43d | 1 | 0.69mi |
| 18666 Joseph Campau St Detroit, MI | 3.0 | 1.0 | 1000 | $1,400 | $1.40 | 16d | 1 | 0.80mi |
| 18629 Fleming St Detroit, MI | 3.0 | 1.5 | 900 | $1,150 | $1.28 | 24d | 1 | 0.90mi |
| 21516 Dequindre Rd Warren, MI | 1.0–2.0 | 1.0 | 837 | $1,375 | $1.64 | 22d | 1 | 0.93mi |
| 18882 Marx St Highland Park, MI | 2.0 | 1.0 | 1000 | $1,300 | $1.30 | 43d | 1 | 0.93mi |
| 19450 Fenelon St Detroit, MI | 3.0 | 1.0 | 1062 | $1,384 | $1.30 | 5d | 1 | 0.97mi |
| 18662 Sunset St Detroit, MI | 2.0 | 1.0 | 726 | $1,250 | $1.72 | 17d | 1 | 0.98mi |
| 18551 Saint Aubin St Detroit, MI | 3.0 | 1.0 | 962 | $1,200 | $1.25 | 16d | 1 | 1.02mi |
| 18084 Goddard St Detroit, MI | 2.0 | 1.5 | 790 | $1,050 | $1.33 | 16d | 1 | 1.07mi |
| 20794 Audrey Ave Warren, MI | 3.0 | 1.0 | 954 | $1,350 | $1.42 | 43d | 1 | 1.08mi |
| 1621 E Evelyn Ave Hazel Park, MI | 2.0 | 1.0 | 749 | $1,295 | $1.73 | 18d | 1 | 1.11mi |
| 19162 Conley St Detroit, MI | 2.0 | 1.0 | 1000 | $1,300 | $1.30 | 43d | 1 | 1.13mi |
| 19361 Moenart St Unit 1 Detroit, MI | 2.0 | 1.0 | 1000 | $1,100 | $1.10 | 24d | 1 | 1.15mi |
| 1211 E Bernhard Ave Hazel Park, MI | 2.0 | 1.0 | 721 | $1,500 | $2.08 | 24d | 1 | 1.21mi |
| 1326 E Evelyn Ave Unit 1032332P Hazel Park, MI | 3.0 | 2.0 | 1097 | $6,448 | $5.88 | 1d | 1 | 1.24mi |
| 1019 E Hayes Ave Unit 1032331P Hazel Park, MI | 3.0 | 1.0 | 1033 | $5,301 | $5.13 | 1d | 1 | 1.24mi |
| 19260 Bloom St Detroit, MI | 3.0 | 1.0 | 1100 | $1,350 | $1.23 | 4d | 1 | 1.25mi |
| 20263 Caldwell St Detroit, MI | 3.0 | 1.0 | 909 | $1,350 | $1.49 | 16d | 1 | 1.26mi |
| 18891 Moenart St Detroit, MI | 3.0 | 1.0 | 870 | $1,195 | $1.37 | 16d | 1 | 1.27mi |
| 1731 E Pearl Ave Hazel Park, MI | 3.0 | 1.0 | 844 | $1,500 | $1.78 | 20d | 1 | 1.33mi |
| 18884 Bloom St Detroit, MI | 3.0 | 1.0 | 979 | $975 | $1.00 | 21d | 1 | 1.34mi |
| 18884 Bloom St Detroit, MI | 3.0 | 1.0 | 979 | $975 | $1.00 | 43d | 1 | 1.34mi |
| 21410 Panama St Warren, MI | 3.0 | 1.0 | 900 | $1,600 | $1.78 | 24d | 1 | 1.41mi |
| 19703 Keating St Highland Park, MI | 3.0 | 1.0 | 1000 | $1,200 | $1.20 | 16d | 1 | 1.48mi |
Listing history 50 events
-
2026-06-18days on market $99,999 Active 35 DOM
-
2026-06-17days on market $99,999 Active 34 DOM
-
2026-06-15days on market $99,999 Active 32 DOM
-
2026-06-13days on market $99,999 Active 30 DOM
-
2026-06-13days on market $99,999 Active 29 DOM
-
2026-06-09days on market $99,999 Active 26 DOM
-
2026-06-08days on market $99,999 Active 25 DOM
-
2026-06-07days on market $99,999 Active 24 DOM
-
2026-06-04days on market $99,999 Active 21 DOM
-
2026-06-03days on market $99,999 Active 20 DOM
-
2026-06-02days on market $99,999 Active 19 DOM
-
2026-06-01days on market $99,999 Active 18 DOM
-
2026-05-31days on market $99,999 Active 17 DOM
-
2026-05-14$99,999 Active 772-char remark
Show marketing remark (772 chars)
Welcome to the perfect starter home! This beautifully updated bungalow is ideally located within walking distance of the award-winning Renaissance High School and near Peterson Playfield, where you'll find a tennis court, basketball court, baseball and football fields, picnic areas, a playground, and scenic walking/running paths. Enjoy the convenience of being just minutes from the Northwest Activities Center, The Avenue of Fashion, Detroit Golf Club, Palmer Park, restaurants, gas stations, major freeways, and more! Inside, you'll fall in love with the beautifully updated interior. The kitchen boasts ample cabinet space with stylish shaker cabinets and durable laminate flooring. Great for a first-time home buyer or an investor bringing in positive rental income!
-
2026-05-14historical
Show marketing remark (772 chars)
Welcome to the perfect starter home! This beautifully updated bungalow is ideally located within walking distance of the award-winning Renaissance High School and near Peterson Playfield, where you'll find a tennis court, basketball court, baseball and football fields, picnic areas, a playground, and scenic walking/running paths. Enjoy the convenience of being just minutes from the Northwest Activities Center, The Avenue of Fashion, Detroit Golf Club, Palmer Park, restaurants, gas stations, major freeways, and more! Inside, you'll fall in love with the beautifully updated interior. The kitchen boasts ample cabinet space with stylish shaker cabinets and durable laminate flooring. Great for a first-time home buyer or an investor bringing in positive rental income!
-
2026-05-14$99,999 Active
Show marketing remark (772 chars)
Welcome to the perfect starter home! This beautifully updated bungalow is ideally located within walking distance of the award-winning Renaissance High School and near Peterson Playfield, where you'll find a tennis court, basketball court, baseball and football fields, picnic areas, a playground, and scenic walking/running paths. Enjoy the convenience of being just minutes from the Northwest Activities Center, The Avenue of Fashion, Detroit Golf Club, Palmer Park, restaurants, gas stations, major freeways, and more! Inside, you'll fall in love with the beautifully updated interior. The kitchen boasts ample cabinet space with stylish shaker cabinets and durable laminate flooring. Great for a first-time home buyer or an investor bringing in positive rental income!
-
2026-04-21$99,999 Active
-
2026-04-21$99,999 Active
-
2026-04-21historical
-
2026-04-21historical
-
2026-02-17$106,900 Active
-
2026-02-17$106,900 Active
-
2026-02-17historical
-
2026-01-03price $106,900
-
2026-01-02price $106,900
-
2025-12-16$115,000 Active
-
2025-12-16$115,000 Active
-
2024-11-06soldstatus $70,000
-
2020-07-31soldstatus $47,000
-
2014-02-28soldstatus $65,600
-
2012-08-13soldstatus $10,500
-
2012-08-13soldstatus $10,500
-
2012-06-27historical
-
2012-06-27historical
-
2012-06-18historical
-
2012-05-31$8,900
-
2012-05-31$8,900
-
2012-05-21historical
-
2011-10-18$9,200
-
2011-10-18$9,200
-
2004-09-29soldstatus $97,000
-
2004-04-30soldstatus $50,000
-
2004-03-08$55,000
-
2004-02-15historical
-
2003-11-11$67,900
-
2003-08-10historical
-
2003-03-13$74,900
-
1999-11-10soldstatus $25,000
-
1999-10-06soldstatus $1,382,562
ⓘ Source: listings_history table (triggers on properties + properties_extension) + one-shot
backfill from property_details.listing_events for pre-trigger history.
Climate risk First Street
- Flood 7/10 Severe FEMA zone X (unshaded) · 96% chance over 30 yrs
- Wildfire 1/10 Low
- Heat 3/10 Moderate 7 d/yr ≥97°F today · 15 d/yr by 30 yrs out
- Wind 2/10 Low
- Air quality 4/10 Moderate 4 unhealthy d/yr today · 6 by 30 yrs out
Nearby sold comps map
Loading sold comps map…
Walkable amenities ~0.75 mi
Loading nearby amenities…
Taxation est. · year 1
- Rental income
- $15,879
- − Mortgage interest
- −$5,601
- − Property taxes
- −$1,500
- − Insurance
- −$1,166
- − Repairs & maintenance
- −$1,270
- − Management
- −$1,270
- − Depreciation
- −$2,909
- Taxable income
- $2,161
- Est. tax owed @ 24.0%
- −$519
- After-tax cash flow
- $3,066/yr
For passive investors: Depreciation is non-cash, so a rental often shows a tax loss while cash-flowing — sheltering income. Rental losses are passive: they offset passive income freely, and up to $25,000/yr can offset ordinary (W-2) income if you actively participate and your MAGI is under $100k (phasing out to $0 by $150k); unused losses carry forward. On sale, claimed depreciation is recaptured at up to 25%, and gains may owe capital-gains tax (a 1031 exchange can defer both). Figures are a year-1 estimate at your 24.0% rate — not tax advice; consult a CPA.
Schools (NCES district)
- District
- Detroit Public Schools Community District
- NCES district ID
- 2601103
- Math proficiency
- 10% ▼ -2.00%
- Reading proficiency
- 24% ▲ 6.00%
- Median HH income
- $25,815
- Composite
- 13.06/100
- National rank
- #9564
- State rank
- #499 of 540 in MI
Livability — Detroit
- Score
- 73/100
- State rank
- #218
- US rank
- #5427
Category grades
Schools grade is shown separately in the Schools card above.
Census & demographics
- Census place
- Detroit, MI
- County
- Wayne County · 1,562,939 people
- City population
- 572,865
- Metro
- Detroit-Warren-Dearborn, MI
- Population (ZIP)
- 32,760
- Household income
- $35,322
- Rent vs Own
- Severe rent burden
- 2372.0
Population outlook (Wayne County) Hauer SSP2
- Today (2025)
- 1,675,273 people
- By 2030
- 1,620,300 · -3.3%
- By 2040
- 1,502,341 · -10.3%
- By 2050
- 1,384,039 · -17.4%
- By 2075
- 1,124,592 · -32.9%
- By 2100
- 881,193 · -47.4%
Race, ethnicity, and origin ACS 2023
- Neighborhood character
- Predominantly Black (94%)
- Race & ethnicity
- Black 94% White 3% Two or more races 1%
- Common ancestry
- Romanian 1%
- Foreign-born
- 2% · Canada, Vietnam, Philippines
- Languages at home
- 97% English-only · French/Haitian/Cajun 1%
Political lean MEDSL · Wayne
- 2024 margin
- Strong D (+29.0) · D 62.7% · R 33.7% · Other 3.6%
- 2008→2024 swing
- -20.5pp toward R · 2008: 49.5pp · 2024: 29.0pp
- All cycles
- 2024: D+29.0 2020: D+38.1 2016: D+37.3 2012: D+46.9 2008: D+49.5
Not yet ingested
- Civics
- —
Market trends
- HPI YoY
- ▼ -44.65%
- Current HPI
- 328.8978
- Rent YoY
- ▲ 6.72%
- Metro
- Detroit-Warren-Dearborn, MI
- State GDP YoY
- ▲ 1.37%
- F500 in state
- 28
Industry mix (Fortune 500 HQ in MI)
| Industry | F500 HQs | Revenue |
|---|---|---|
| Automotive Parts | 3 | $48B |
|
||
| Automotive | 2 | $372B |
|
||
| Chemicals | 1 | $45B |
|
||
| Automotive Retail | 1 | $29B |
|
||
| Healthcare / Medical Devices | 1 | $23B |
|
||
| Automotive Technology | 1 | $20B |
|
||
Price history
-92.8% since first listed37 events — show timeline
- 2026-05-14 Listed $99,999 REALCOMP
- 2026-05-14 Listing Removed — MiRealSource-MiMLS
- 2026-05-14 Listing Removed — REALCOMP
- 2026-05-14 Listed $99,999 MiRealSource-MiMLS
- 2026-04-21 Listing Removed — MiRealSource-MiMLS
- 2026-04-21 Listing Removed — REALCOMP
- 2026-04-21 Listed $99,999 MiRealSource-MiMLS
- 2026-04-21 Listed $99,999 REALCOMP
- 2026-02-17 Listed $106,900 REALCOMP
- 2026-02-17 Listing Removed — MiRealSource-MiMLS
- 2026-02-17 Listed $106,900 MiRealSource-MiMLS
- 2026-01-03 Price Changed $106,900 MiRealSource-MiMLS
- 2026-01-02 Price Changed $106,900 REALCOMP
- 2025-12-16 Listed $115,000 REALCOMP
- 2025-12-16 Listed $115,000 MiRealSource-MiMLS
- 2024-11-06 Sold (Public Records) $70,000 Public Records
- 2020-07-31 Sold (Public Records) $47,000 Public Records
- 2014-02-28 Sold (Public Records) $65,600 Public Records
- 2012-08-13 Sold (MLS) $10,500 MiRealSource-MiMLS
- 2012-08-13 Sold (MLS) $10,500 REALCOMP
- 2012-06-27 Listing Removed — MiRealSource-MiMLS
- 2012-06-27 Listing Removed — REALCOMP
- 2012-06-18 Listing Removed — MiRealSource-MiMLS
- 2012-05-31 Listed $8,900 MiRealSource-MiMLS
- 2012-05-31 Listed $8,900 REALCOMP
- 2012-05-21 Listing Removed — REALCOMP
- 2011-10-18 Listed $9,200 REALCOMP
- 2011-10-18 Listed $9,200 MiRealSource-MiMLS
- 2004-09-29 Sold (Public Records) $97,000 Public Records
- 2004-04-30 Sold (MLS) $50,000 REALCOMP
- 2004-03-08 Listed $55,000 REALCOMP
- 2004-02-15 Listing Removed — REALCOMP
- 2003-11-11 Listed $67,900 REALCOMP
- 2003-08-10 Listing Removed — REALCOMP
- 2003-03-13 Listed $74,900 REALCOMP
- 1999-11-10 Sold (Public Records) $25,000 Public Records
- 1999-10-06 Sold (Public Records) $1,382,562 Public Records
Property tax history
+14.0%/yrLatest (2025): $5,343 · +368.8% YoY. Source: county tax records.
Cash-flow waterfall
monthlySold comps — $/sqft
last 12 mo · ≤1 miLoading sold comps…