 Duplex
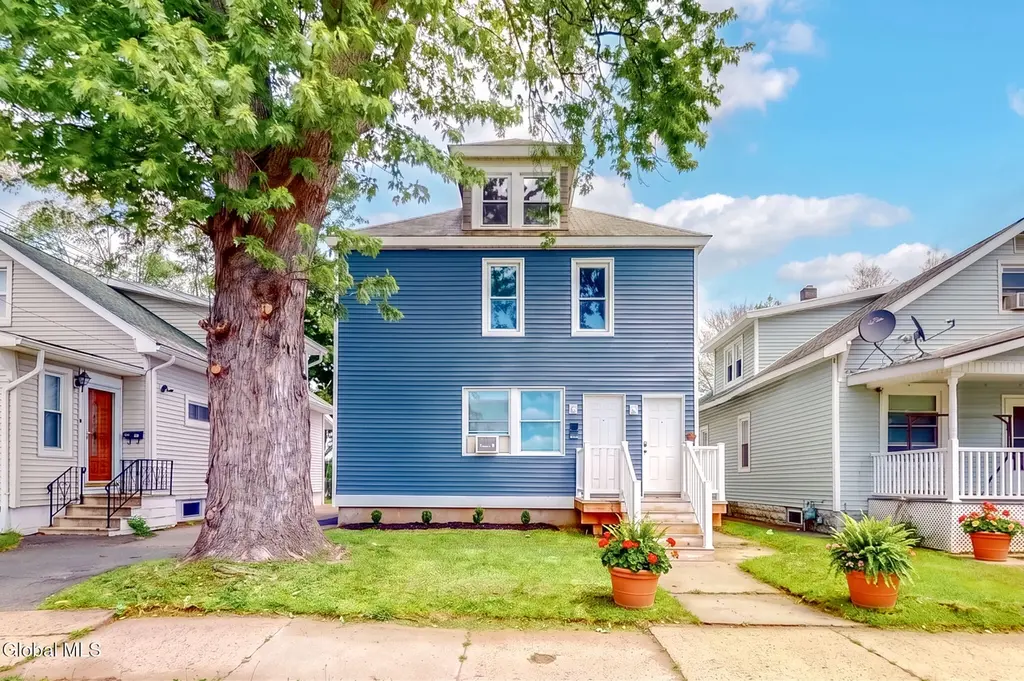
1315 Van Cortland St · Schenectady, NY
Flood risk 1/10 · Minimal
- FEMA flood zone
- X (unshaded)
- Chance of flooding over 30 yrs
- 0.0%
- Est. flood insurance / yr
- $473 – $860
Fire risk 1/10 · Minimal
- Est. fire insurance / yr
- $691 – $1,283
Heat risk 4/10 · Minor
- Hot days now (above 96°F)
- 7 days/yr
- Hot days in 30 yrs
- 16 days/yr
Wind risk 2/10 · Minimal
- Chance of severe wind over 30 yrs
- 4.0%
Air-quality risk 1/10 · Minimal
- Unhealthy air days now
- 0 days/yr
- Unhealthy air days in 30 yrs
- 0 days/yr
Risk factors via First Street. Map © Google.
Why this score? — see what drove the D+ grade
The composite is a weighted blend of 9 inputs, each scored 0–100. Each bar is that input's sub-score; the figure is the points it added to the 100-point composite (weight × sub-score).
- Cash flow +20.8/30.0
- DSCR +6.6/10.0
- 1% rule +6.1/10.0
- Livability +3.9/5.0
- Schools +3.0/10.0
- Rent growth +2.5/5.0
- Condition / age +2.5/5.0
- ARV discount +0.0/15.0
- Appreciation +0.0/10.0
$239,000
🖨 Deal sheet (PDF) 📄 Offer letter ✓ Due diligence
Multi-family units
County records classify this as Multi-Family (2-4 Unit). Listing-text estimate: 2 units. confirmed
Listing remarks MLS
Two family with lots of rental potential, has all the required city certifications. All buyers and agents must wear a mask, sign the one page NYSAR Covid 19 Disclosure prior to previewing the property. Proof of funds or a pre-qualification letter to accompany all offers. Good Condition
Key facts
- Separate utilities
- Two-family home
- Eat-in kitchen
Tags
Property features AI
Exterior
- Parking: 2 parking spaces
- Utilities: Public water; Public sewer
- Home design: Duplex; Living area listed as 1,360; Aluminum siding
- Construction: Aluminum siding construction
- Exterior features: Back yard fencing; Lot approximately 0.11 acre
Interior
- Bedrooms: Unit 1: 3 bedrooms; Unit 2: 2 bedrooms
- Bathrooms: 2 full bathrooms (one on the 1st level, one on the 2nd level)
- Heating & cooling: Forced air heating; Natural gas heating
- Interior features: Full basement
Neighborhood map
What this means for you Summary
Snapshot
- This is a 2 × 2-bed/1.0-bath units multifamily listed at $239k.
Deal economics
- At list price, monthly cash flow is $327 ($4k/yr) — positive. Per door: $163/mo.
- The deal already cash-flows at list — no discount required.
- Meets the 1% rule at list price ($3k rent vs $239k).
- Cap rate 7.9% vs local median 6.3% in Schenectady — meaningfully above typical; check what's discounted (condition, days-on-market, listing class) to confirm the premium yield is real.
Location & tenants
- Location reads 78/100 on livability (#167 in NY, #2,597 nationally) — a middle-class / working-renter tenant base. Strengths: commute A+, health & safety A+, cost of living A; Watch: employment D+, crime F.
- Schenectady City School District (urban): math 38% / reading 34% proficiency, ranked #556 of 590 in NY (top 94%) — families likely to look elsewhere, expect single-tenant / working-renter base with shorter leases; 65% free/reduced lunch — lower-income household profile, screen leases tightly.
- Zoned schools: Schenectady High School (math 75% / reading 90%, grade A, #446 of 1,100 statewide, top 41%, 2,743 students, 71% FRL).
- Zoned-school proficiency averages 82% at this address vs 36% district-wide (+46 pts) — the actual schools serving this property are materially stronger than the Schenectady City School District average implies; a family-tenant draw the district grade alone would hide.
- Market conditions: 164 active listings in the ZIP; 10 comparable units currently listed for rent nearby; rentals at typical pace (median 20d on market — plan ~3-4 weeks tenant-placement turnaround); solid renter incomes; 154 units permitted in Schenectady County in 2024 (54 in 5+ unit buildings).
- This rent runs 38% of the median local income ($84k/yr) — at the standard rent-burdened threshold; future hikes will face affordability resistance.
Forward outlook
- Local home prices are declining (-3.0%/yr); year-one equity from $2k of loan paydown is wiped out by about $7k of value loss. Plan a longer hold.
- Schenectady County population projected to shrink 4% by 2050 — rents likely to lag national; underwrite the cash flow, not the appreciation.
Negotiation context
- Only 8 days on market — expect competitive offers; lowballing is unlikely to land.
- 7 sale attempts since 21y ago with the ask held roughly flat each time — persistent listings suggest the price (not the market) is what's stuck; bring a comps-based counter.
- Current owner paid $90k; list at $239k implies a 167% gain — meaningful room to come down on a strong offer.
Risks & watch-outs
- Watch-outs: built in 1910 — expect roof / HVAC / electrical / plumbing capex.
Questions for the listing agent
- Can we see the unit-by-unit rent roll, current vacancy, and any below-market leases? What's the average tenancy length?
- What capital expenditures (roof, boiler, parking lot, exteriors) have been made in the last 5 years, and what's planned in the next 2?
- Built in 1910 — when were the roof, HVAC, electrical panel, plumbing, and water heater last replaced?
- Is there a deadline driving the sale (1031 exchange, divorce, estate, relocation)? That informs how much negotiation room exists.
- Crime grade is F in this area — have there been break-ins, vandalism, or insurance claims at this property in the last 3 years? What carrier currently insures it and at what premium?
- The area grade is low — what's the realistic commute time and amenity access for the typical tenant pool here? Any planned neighborhood developments (good or bad) we should know about?
- What's the average days-on-market for RENTAL listings here right now (not sales)? A rising rental-DOM trend means longer vacancies and softer asking-rent achievability than the comps imply.
- What's the recent tenant-quality profile in this submarket — average credit score on applications, eviction rate, late-payment / NSF rate, and stable-employment percentage? A property-management company in the area should have these aggregated.
- How much new apartment / multifamily construction is in the pipeline within 1–3 miles? Heavy new supply (>2% of stock underway) typically softens rents 12–24 months out; light construction supports rent growth.
Investment metrics
- 1% rule
- 1.11% ✓
- Cap rate
- 7.93%
- Cash-on-cash
- 5.86%
- DSCR
- 1.26
- GRM
- 7.5
CMA / ARV
- ARV (on-the-fly)
- $174,080
- Comps found
- 12
Show comp detail 12 sales within ~0.75 mi
| Address | Dist | Beds/Ba | Sqft | Sold | Price | $/sf | Match |
|---|---|---|---|---|---|---|---|
| 1041 Strong St | 0.50mi | 4/2.0 | 1,400 (+3%) | 4mo | $160,000 | $114 | 68 |
| 892 Maplewood Ave | 0.18mi | 4/2.0 | 1,510 (+11%) | 11mo | $200,000 | $132 | 64 |
| 1218 9th Ave | 0.37mi | 4/2.0 | 1,496 (+10%) | 6mo | $192,000 | $128 | 61 |
| 956 Strong St | 0.41mi | 4/2.0 | 1,280 (-6%) | 18mo | $70,000 | $55 | 56 |
| 622 Lansing St | 0.62mi | 4/2.0 | 1,360 (0%) | 21mo | $235,000 | $173 | 53 |
| 276 Duane Ave | 0.47mi | 3/2.0 (-1) | 1,300 (-4%) | 16mo | $195,000 | $150 | 52 |
| 1258 Webster St | 0.43mi | 3/2.0 (-1) | 1,470 (+8%) | 20mo | $185,500 | $126 | 45 |
| 1015-1017 Second Ave | 0.64mi | 5/2.0 (+1) | 1,440 (+6%) | 14mo | $185,000 | $128 | 44 |
| 1071-1073 Cutler St | 0.63mi | 5/2.0 (+1) | 1,480 (+9%) | 13mo | $140,000 | $95 | 40 |
| 139 Duane Ave | 0.50mi | 4/2.0 | 1,524 (+12%) | 23mo | $195,000 | $128 | 37 |
| 1118 Congress St | 0.56mi | 5/2.0 (+1) | 1,484 (+9%) | 22mo | $215,000 | $145 | 36 |
| 1762 Hamburg St | 0.57mi | 3/2.0 (-1) | 1,514 (+11%) | 18mo | $173,000 | $114 | 35 |
Match score weights: distance 35% · size 25% · config 20% · recency 20%. Top-matched comps best support the ARV.
Projected returns pro-forma
-3.0% appreciation · 3.0% rent growth · sell at horizon
- IRR
- -7.2%
- Equity multiple
- 0.73×
- Total profit
- $-17,797
- Equity at exit
- $35,636
- IRR
- 2.4%
- Equity multiple
- 1.18×
- Total profit
- $11,751
- Equity at exit
- $20,664
Cash invested: $66,920 (down + closing). Projections, not guarantees.
Landlord ↔ Tenant lean methodology
- Overall (STATE)
- 15 Strongly Tenant-Friendly
- State New York
- 15 Strongly Tenant-Friendly · D+10
- County
- — inherits STATE
- City
- — inherits STATE
ZIP-level market 12303
- Active inventory
- 164
- Price-to-rent
- 15.1×
Monthly cashflow live
- Estimated rent
- $2,642 medium interval (Pro) →
- Mortgage (P&I)
- −$1,253
- Tax from tax record
- −$407 /mo · $4,887/yr
- Insurance
- −$100
- HOA
- −$0
- Vacancy / Maint / Mgmt
- −$555
- Net cashflow
- $327
Break-even live
Sensitivity live
| Price | -10% $462 | -5% $395 | +0% $327 | +5% $259 | +10% $192 |
|---|---|---|---|---|---|
| Rent | -10% $118 | -5% $223 | +0% $327 | +5% $431 | +10% $536 |
| Rate | -1.0pp $447 | -0.5pp $388 | base $327 | +0.5pp $265 | +1.0pp $202 |
2-unit breakdown (identical units grouped — click to expand)
| Units | Beds | Baths | Est. rent |
|---|---|---|---|
| 2× units | 2 | 1 | $2,642 |
| #1 | 2 | 1 | $1,321 |
| #2 | 2 | 1 | $1,321 |
| Total (2 units) | $2,642 | ||
UW: 25.0% down · 7.5% · 30yr · 1.5% tax · 5.0% vac · 8.0% maint · 8.0% mgmt
Financing live
Cash to close
- Down payment
- $59,750
- Closing costs
- $7,170
- Reserves months
- —
- Total cash needed
- —
Loan-product check · same deal, 3 products live
Conventional
25% down · 7.5% · 30yr
- Down + closing
- —
- Monthly P&I
- —
- Monthly cashflow
- —
- DSCR
- —
- Eligible?
- —
Personal DTI + credit; lowest rate.
DSCR
20% down · 8.5% · 30yr
- Down + closing
- —
- Monthly P&I
- —
- Monthly cashflow
- —
- DSCR
- —
- Eligible?
- —
No personal income docs; deal must DSCR.
Hard money
10% down · 12.0% · 12mo
- Down + closing
- —
- Monthly P&I
- —
- Monthly cashflow
- —
- DSCR
- —
- Eligible?
- —
Short-term bridge; refi at stabilization.
Rent comps 10 comps
| Address | Beds | Baths | Sqft | Rent | $/sqft | DOM | Units | Dist |
|---|---|---|---|---|---|---|---|---|
| 1120 Pleasant St Schenectady, NY | 3.0 | 1.0 | 1000 | $1,500 | $1.50 | 15d | 1 | 0.41mi |
| 918 Delamont Ave Schenectady, NY | 3.0 | 1.0 | 1192 | $1,600 | $1.34 | 24d | 1 | 0.65mi |
| 418 Third St Schenectady, NY | 3.0 | 1.0 | 1000 | $2,200 | $2.20 | 15d | 1 | 1.21mi |
| 126 Prospect St Schenectady, NY | 3.0 | 1.0 | 1000 | $1,600 | $1.60 | 24d | 1 | 1.24mi |
| 120 De Graff St Schenectady, NY | 4.0 | 1.0 | 1022 | $1,600 | $1.57 | 45d | 1 | 1.24mi |
| 1826 Campbell Ave Schenectady, NY | 3.0 | 1.0 | 1000 | $1,600 | $1.60 | 15d | 1 | 1.25mi |
| 2030 Euclid Ave Schenectady, NY | 3.0 | 1.0 | 1300 | $2,000 | $1.54 | 20d | 1 | 1.26mi |
| 2007 Campbell Ave Schenectady, NY | 3.0 | 1.0 | 1272 | $1,600 | $1.26 | 15d | 1 | 1.36mi |
| 117 Washington Ave Schenectady, NY | 2.0–4.0 | 1.0–2.0 | 1033 | $2,163 | $2.09 | 15d | 9 | 1.39mi |
| 1037 University Pl Unit 2 Schenectady, NY | 3.0 | 1.0 | 1200 | $1,600 | $1.33 | 45d | 1 | 1.48mi |
Listing history 7 events
-
2026-06-14statusdays on market $239,000 Pending 8 DOM
-
2026-06-13days on market $239,000 Active 7 DOM
-
2026-06-10days on market $239,000 Active 5 DOM
-
2026-06-09days on market $239,000 Active 4 DOM
-
2026-06-08days on market $239,000 Active 3 DOM
-
2026-06-07remarks 699-char remark
-
2026-06-07$239,000 Active 2 DOM
ⓘ Source: listings_history table (triggers on properties + properties_extension) + one-shot
backfill from property_details.listing_events for pre-trigger history.
Tax reassessment forecast NY · Partial reset (capped growth)
- Current annual tax
- $4,887 · $407/mo
- Projected year-2 tax
- $4,887 · $407/mo
- Expected delta
- $0/yr ($0/mo · 0.0%)
ⓘ Screening estimate from a state-policy table — verify with the county assessor before closing.
Climate risk First Street
- Flood 1/10 Low FEMA zone X (unshaded) · 0% chance over 30 yrs
- Wildfire 1/10 Low
- Heat 4/10 Moderate 7 d/yr ≥96°F today · 16 d/yr by 30 yrs out
- Wind 2/10 Low 4% chance of damaging wind over 30 yrs
- Air quality 1/10 Low 0 unhealthy d/yr today · 0 by 30 yrs out
Nearby sold comps map
Loading sold comps map…
Walkable amenities ~0.75 mi
Loading nearby amenities…
Taxation est. · year 1
- Rental income
- $31,704
- − Mortgage interest
- −$13,388
- − Property taxes
- −$4,887
- − Insurance
- −$1,195
- − Repairs & maintenance
- −$2,536
- − Management
- −$2,536
- − Depreciation
- −$6,953
- Taxable income
- $208
- Est. tax owed @ 24.0%
- −$50
- After-tax cash flow
- $3,874/yr
For passive investors: Depreciation is non-cash, so a rental often shows a tax loss while cash-flowing — sheltering income. Rental losses are passive: they offset passive income freely, and up to $25,000/yr can offset ordinary (W-2) income if you actively participate and your MAGI is under $100k (phasing out to $0 by $150k); unused losses carry forward. On sale, claimed depreciation is recaptured at up to 25%, and gains may owe capital-gains tax (a 1031 exchange can defer both). Figures are a year-1 estimate at your 24.0% rate — not tax advice; consult a CPA.
Schools (NCES district)
- District
- Schenectady City School District
- NCES district ID
- 3626010
- Math proficiency
- 38% ▲ 12.00%
- Reading proficiency
- 34% ▲ 2.00%
- Median HH income
- $39,453
- Composite
- 30.2/100
- National rank
- #6309
- State rank
- #556 of 590 in NY
Livability — Schenectady
- Score
- 78/100
- State rank
- #167
- US rank
- #2597
Category grades
Schools grade is shown separately in the Schools card above.
Census & demographics
- Census place
- Schenectady, NY
- County
- Schenectady County · 141,369 people
- City population
- 141,369
- Metro
- Albany-Schenectady-Troy, NY
- Population (ZIP)
- 29,360
- Household income
- $84,375
- Rent vs Own
- Severe rent burden
- 1318.0
Population outlook (Schenectady County) Hauer SSP2
- Today (2025)
- 155,046 people
- By 2030
- 154,322 · -0.5%
- By 2040
- 151,796 · -2.1%
- By 2050
- 148,621 · -4.1%
- By 2075
- 141,229 · -8.9%
- By 2100
- 126,014 · -18.7%
Race, ethnicity, and origin ACS 2023
- Neighborhood character
- Predominantly White (66%)
- Race & ethnicity
- White 66% Two or more races 11% Black 10% Hispanic / Latino 9% Asian 4%
- Hispanic origin (detail)
- Mexican 1% Puerto Rican 5%
- Common ancestry
- Romanian 6% Lithuanian 3% Iranian 2%
- Foreign-born
- 10% · Canada, China
- Languages at home
- 90% English-only · Spanish 6% Other Indo-European 2% Chinese 1%
Political lean MEDSL · Schenectady
- 2024 margin
- D (+10.8) · D 55.4% · R 44.6%
- 2008→2024 swing
- -1.8pp toward R · 2008: 12.7pp · 2024: 10.8pp
- All cycles
- 2024: D+10.8 2020: D+15.7 2016: D+5.8 2012: D+15.4 2008: D+12.7
Not yet ingested
- Civics
- —
Market trends
- HPI YoY
- ▼ -151.01%
- Current HPI
- 280.3886
- Rent YoY
- —
- Metro
- Albany-Schenectady-Troy, NY
- State GDP YoY
- ▲ 2.60%
- F500 in state
- 92
Industry mix (Fortune 500 HQ in NY)
| Industry | F500 HQs | Revenue |
|---|---|---|
| Financial Services | 10 | $950B |
|
||
| Consumer Goods | 9 | $162B |
|
||
| Insurance | 4 | $225B |
|
||
| Telecommunications | 2 | $144B |
|
||
| Pharmaceuticals | 2 | $112B |
|
||
| Media / Entertainment | 2 | $69B |
|
||
Price history
+334.5% since first listed21 events — show timeline
- 2026-06-05 Listed $239,000 Global MLS
- 2020-12-23 Sold (Public Records) $89,500 Public Records
- 2020-12-18 Sold (MLS) $89,900 Global MLS
- 2020-09-30 Pending — Global MLS
- 2020-09-28 Listed $89,900 Global MLS
- 2013-09-03 Sold (MLS) $25,000 Global MLS
- 2013-07-26 Listing Removed — Global MLS
- 2013-02-04 Listed $28,500 Global MLS
- 2012-10-17 Listing Removed — Global MLS
- 2010-11-16 Listed $55,000 Global MLS
- 2008-12-29 Listing Removed — Global MLS
- 2008-06-23 Listed $104,900 Global MLS
- 2006-12-22 Sold (Public Records) $75,000 Public Records
- 2006-12-15 Sold (MLS) $75,000 Global MLS
- 2006-10-06 Listing Removed — Global MLS
- 2006-09-25 Listed $79,900 Global MLS
- 2005-05-06 Sold (Public Records) $43,113 Public Records
- 2005-04-28 Sold (MLS) $43,113 Global MLS
- 2005-03-28 Listing Removed — Global MLS
- 2005-03-18 Listed $40,000 Global MLS
- 1996-12-06 Sold (Public Records) $55,000 Public Records
Property tax history
+0.9%/yrLatest (2025): $4,887 · +4.0% YoY. Source: county tax records.
Cash-flow waterfall
monthlySold comps — $/sqft
last 12 mo · ≤1 miLoading sold comps…