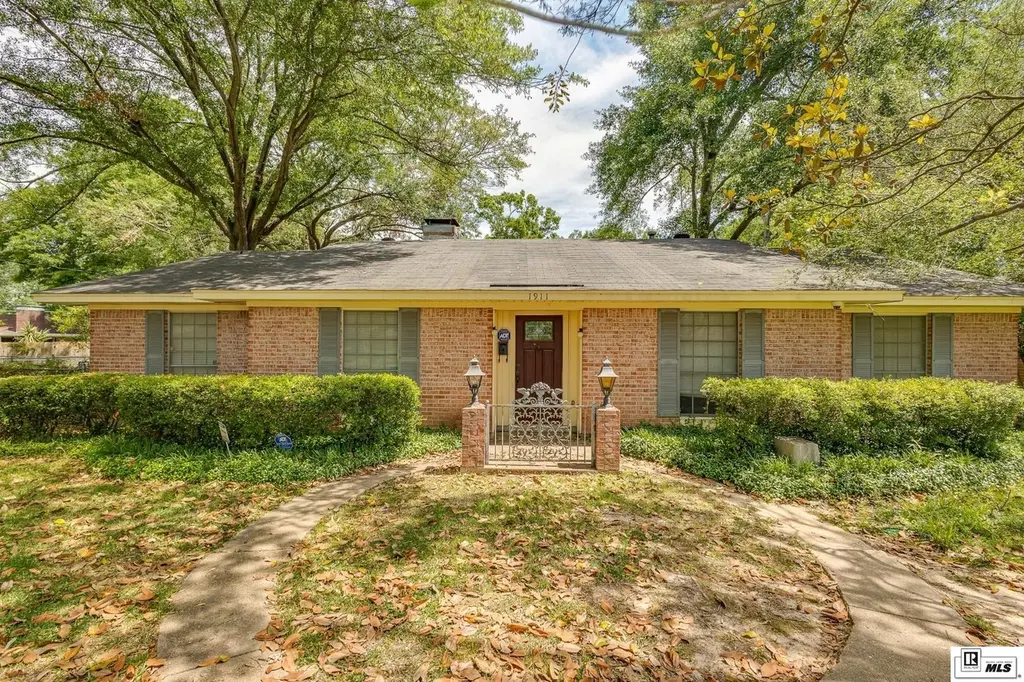
1911 Scott St · Monroe, LA
Flood risk 1/10 · Minimal
- FEMA flood zone
- X (shaded)
- Chance of flooding over 30 yrs
- 0.0%
- Est. flood insurance / yr
- $507 – $1,088
Fire risk 1/10 · Minimal
- Est. fire insurance / yr
- $1,269 – $2,357
Heat risk 7/10 · Major
- Hot days now (above 111°F)
- 7 days/yr
- Hot days in 30 yrs
- 18 days/yr
Wind risk 7/10 · Major
- Chance of severe wind over 30 yrs
- 78.0%
Air-quality risk 1/10 · Minimal
- Unhealthy air days now
- 0 days/yr
- Unhealthy air days in 30 yrs
- 0 days/yr
Risk factors via First Street. Map © Google.
Why this score? — see what drove the C- grade
The composite is a weighted blend of 9 inputs, each scored 0–100. Each bar is that input's sub-score; the figure is the points it added to the 100-point composite (weight × sub-score).
- Cash flow +16.6/30.0
- ARV discount +15.0/15.0
- DSCR +5.2/10.0
- 1% rule +3.8/10.0
- Livability +3.3/5.0
- Rent growth +2.5/5.0
- Condition / age +2.5/5.0
- Schools +2.1/10.0
- Appreciation +0.0/10.0
$188,000
🖨 Deal sheet (PDF) 📄 Offer letter ✓ Due diligence
Listing remarks
This 3-bedroom, 2-bath Monroe home is ready for a buyer with vision and the willingness to roll up their sleeves. A fireplace anchors the living room, adding warmth and character to the main living space. Out back, a screened-in patio invites you to enjoy Louisiana evenings in comfort, while a separate shop opens the door to hobbies, projects, or extra storage. With the right updates, this one has real potential to become something special.
Key facts
- Separate shop
- Screened-in patio
- Fireplace
Tags
Neighborhood map
What this means for you Summary
Snapshot
- This is a 3-bed/2.0-bath single-family listed at $188k.
Deal economics
- At list price, monthly cash flow is $114 ($1k/yr) — positive.
- The deal already cash-flows at list — no discount required.
- To meet the 1% rule (rent ≥ 1% of price), the offer needs to be $166k (11.6% below list).
- Recommended offer: $166k (11.6% below list) — sets the bar for 1% rule.
- Cap rate 7.0% vs local median 5.7% in Monroe — meaningfully above typical; check what's discounted (condition, days-on-market, listing class) to confirm the premium yield is real.
Location & tenants
- Location reads 66/100 on livability (#128 in LA) — a middle-class / working-renter tenant base. Strengths: cost of living A+, health & safety A+; Watch: crime F, amenities F, commute F.
- City Of Monroe School District (urban): math 21% / reading 31% proficiency, ranked #60 of 98 in LA (top 61%) — low school quality limits family demand, transient renter base, plan for 1-2y turnover; 82% free/reduced lunch — lower-income household profile, screen leases tightly.
- Zoned schools: Lexington Elementary School (604 students, 48% FRL); Neville Junior High School (math 29% / reading 53%, grade F, #61 of 218 statewide, top 28%, 480 students, 58% FRL); Neville High School (math 35% / reading 52%, grade F, #64 of 265 statewide, top 24%, 1,121 students, 49% FRL) — zoned schools average 52% FRL vs 82% district-wide (30 pts lower); this property's tenant base skews higher-income than the district average.
- Zoned-school proficiency averages 42% at this address vs 26% district-wide (+16 pts) — the actual schools serving this property are materially stronger than the City Of Monroe School District average implies; a family-tenant draw the district grade alone would hide.
- Market conditions: 142 active listings in the ZIP; 1 comparable units currently listed for rent nearby; 345 units permitted in Ouachita Parish in 2024 (0 in 5+ unit buildings).
- This rent runs 30% of the median local income ($65k/yr) — at the standard rent-burdened threshold; future hikes will face affordability resistance.
Forward outlook
- Local home prices are declining (-3.0%/yr); year-one equity from $1k of loan paydown is wiped out by about $6k of value loss. Plan a longer hold.
Negotiation context
- Only 4 days on market — expect competitive offers; lowballing is unlikely to land.
Risks & watch-outs
- Climate carrying-cost: major wind risk, 78% chance of damaging wind over 30y; extreme-heat days projected 7→18/yr by 2055 (HVAC capex compounding) — expect insurance premiums to compound above CPI over the hold.
Questions for the listing agent
- Built in 1972 — when were the roof, HVAC, electrical panel, plumbing, and water heater last replaced?
- Is there a deadline driving the sale (1031 exchange, divorce, estate, relocation)? That informs how much negotiation room exists.
- Crime grade is F in this area — have there been break-ins, vandalism, or insurance claims at this property in the last 3 years? What carrier currently insures it and at what premium?
- What's the average days-on-market for RENTAL listings here right now (not sales)? A rising rental-DOM trend means longer vacancies and softer asking-rent achievability than the comps imply.
- What's the recent tenant-quality profile in this submarket — average credit score on applications, eviction rate, late-payment / NSF rate, and stable-employment percentage? A property-management company in the area should have these aggregated.
- How much new for-sale + rental construction is in the pipeline within 1–3 miles? Heavy new supply typically softens prices + rents 12–24 months out; constrained supply supports both.
Investment metrics
- 1% rule
- 0.88% ✗
- Cap rate
- 7.02%
- Cash-on-cash
- 2.60%
- DSCR
- 1.12
- GRM
- 9.4
CMA / ARV
- ARV (on-the-fly)
- $235,200
- Comps found
- 12
Show comp detail 12 sales within ~0.75 mi
| Address | Dist | Beds/Ba | Sqft | Sold | Price | $/sf | Match |
|---|---|---|---|---|---|---|---|
| 2120 Maywood Dr | 0.13mi | 4/2.0 (+1) | 2,398 (+2%) | 10mo | $200,000 | $83 | 78 |
| 1906 Richard Dr | 0.17mi | 4/3.0 (+1) | 2,250 (-4%) | 3mo | $210,000 | $93 | 74 |
| 1909 Richard Dr | 0.19mi | 3/2.0 | 2,032 (-14%) | 5mo | $190,000 | $94 | 64 |
| 2214 Beechwood Dr | 0.40mi | 3/2.0 | 2,618 (+11%) | 4mo | $247,500 | $95 | 59 |
| 2102 Marie Pl | 0.44mi | 3/3.0 | 2,593 (+10%) | 2mo | $265,000 | $102 | 57 |
| 1801 Oakmont St | 0.30mi | 4/2.0 (+1) | 2,106 (-10%) | 9mo | $287,500 | $137 | 56 |
| 1713 Milton St | 0.58mi | 4/2.5 (+1) | 2,198 (-6%) | 1mo | $283,000 | $129 | 54 |
| 2014 Frances Pl | 0.65mi | 2/1.5 (-1) | 2,361 (+0%) | 9mo | $130,000 | $55 | 54 |
| 1503 Glenmar Ave | 0.62mi | 3/3.0 | 2,409 (+2%) | 12mo | $115,000 | $48 | 53 |
| 1702 Park Ave | 0.65mi | 3/2.0 | 2,562 (+9%) | 8mo | $255,000 | $100 | 48 |
| 1506 Park Ave | 0.66mi | 3/2.5 | 2,101 (-11%) | 6mo | $475,000 | $226 | 45 |
| 2526 Felicity Dr | 0.74mi | 3/2.0 | 2,114 (-10%) | 8mo | $369,900 | $175 | 42 |
Match score weights: distance 35% · size 25% · config 20% · recency 20%. Top-matched comps best support the ARV.
Projected returns pro-forma
-3.0% appreciation · 3.0% rent growth · sell at horizon
- IRR
- -12.2%
- Equity multiple
- 0.56×
- Total profit
- $-23,230
- Equity at exit
- $28,031
- IRR
- -3.1%
- Equity multiple
- 0.79×
- Total profit
- $-11,014
- Equity at exit
- $16,255
Cash invested: $52,640 (down + closing). Projections, not guarantees.
Landlord ↔ Tenant lean methodology
- Overall (STATE)
- 90 Strongly Landlord-Friendly
- State Louisiana
- 90 Strongly Landlord-Friendly · R+12
- County
- — inherits STATE
- City
- — inherits STATE
ZIP-level market 71201
- Home prices YoY
- -31.9%
- Active inventory
- 142
- Price-to-rent
- 9.4×
Monthly cashflow live
- Estimated rent
- $1,663 medium interval (Pro) →
- Mortgage (P&I)
- −$986
- Tax from tax record
- −$135 /mo · $1,621/yr
- Insurance
- −$78
- HOA
- −$0
- Vacancy / Maint / Mgmt
- −$349
- Net cashflow
- $114
Break-even live
Sensitivity live
| Price | -10% $221 | -5% $167 | +0% $114 | +5% $61 | +10% $8 |
|---|---|---|---|---|---|
| Rent | -10% $-17 | -5% $48 | +0% $114 | +5% $180 | +10% $245 |
| Rate | -1.0pp $209 | -0.5pp $162 | base $114 | +0.5pp $65 | +1.0pp $16 |
UW: 25.0% down · 7.5% · 30yr · 1.5% tax · 5.0% vac · 8.0% maint · 8.0% mgmt
Financing live
Cash to close
- Down payment
- $47,000
- Closing costs
- $5,640
- Reserves months
- —
- Total cash needed
- —
Loan-product check · same deal, 3 products live
Conventional
25% down · 7.5% · 30yr
- Down + closing
- —
- Monthly P&I
- —
- Monthly cashflow
- —
- DSCR
- —
- Eligible?
- —
Personal DTI + credit; lowest rate.
DSCR
20% down · 8.5% · 30yr
- Down + closing
- —
- Monthly P&I
- —
- Monthly cashflow
- —
- DSCR
- —
- Eligible?
- —
No personal income docs; deal must DSCR.
Hard money
10% down · 12.0% · 12mo
- Down + closing
- —
- Monthly P&I
- —
- Monthly cashflow
- —
- DSCR
- —
- Eligible?
- —
Short-term bridge; refi at stabilization.
Rent comps 1 comps
| Address | Beds | Baths | Sqft | Rent | $/sqft | DOM | Units | Dist |
|---|---|---|---|---|---|---|---|---|
| 1707 N 5th St Monroe, LA | 3.0 | 2.0 | 1694 | $3,500 | $2.07 | 23d | 1 | 1.25mi |
Listing history 3 events
-
2026-04-28status Pending
-
2026-04-24$188,000 Active
-
2011-09-16soldstatus
ⓘ Source: listings_history table (triggers on properties + properties_extension) + one-shot
backfill from property_details.listing_events for pre-trigger history.
Tax reassessment forecast LA · Resets to sale price
- Current annual tax
- $1,621 · $135/mo
- Projected year-2 tax
- $1,621 · $135/mo
- Expected delta
- $0/yr ($0/mo · 0.0%)
ⓘ Screening estimate from a state-policy table — verify with the county assessor before closing.
Climate risk First Street
- Flood 1/10 Low FEMA zone X (shaded) · 0% chance over 30 yrs
- Wildfire 1/10 Low
- Heat 7/10 Severe 7 d/yr ≥111°F today · 18 d/yr by 30 yrs out
- Wind 7/10 Severe 78% chance of damaging wind over 30 yrs
- Air quality 1/10 Low 0 unhealthy d/yr today · 0 by 30 yrs out
Nearby sold comps map
Loading sold comps map…
Walkable amenities ~0.75 mi
Loading nearby amenities…
Taxation est. · year 1
- Rental income
- $19,951
- − Mortgage interest
- −$10,531
- − Property taxes
- −$1,621
- − Insurance
- −$940
- − Repairs & maintenance
- −$1,596
- − Management
- −$1,596
- − Depreciation
- −$5,469
- Taxable loss
- −$1,802
- Est. tax savings @ 24.0%
- +$432
- After-tax cash flow
- $1,802/yr
For passive investors: Depreciation is non-cash, so a rental often shows a tax loss while cash-flowing — sheltering income. Rental losses are passive: they offset passive income freely, and up to $25,000/yr can offset ordinary (W-2) income if you actively participate and your MAGI is under $100k (phasing out to $0 by $150k); unused losses carry forward. On sale, claimed depreciation is recaptured at up to 25%, and gains may owe capital-gains tax (a 1031 exchange can defer both). Figures are a year-1 estimate at your 24.0% rate — not tax advice; consult a CPA.
Schools (NCES district)
- District
- City Of Monroe School District
- NCES district ID
- 2201080
- Math proficiency
- 21% ▼ -36.00%
- Reading proficiency
- 31% ▼ -34.00%
- Median HH income
- $28,751
- Composite
- 20.82/100
- National rank
- #8505
- State rank
- #60 of 98 in LA
Livability — Monroe
- Score
- 66/100
- State rank
- #128
- US rank
- #11948
Category grades
Schools grade is shown separately in the Schools card above.
Census & demographics
- Census place
- Monroe, LA
- County
- Ouachita Parish · 118,340 people
- City population
- 60,136
- Metro
- Monroe, LA
- Population (ZIP)
- 21,782
- Household income
- $65,446
- Rent vs Own
- Severe rent burden
- 1466.0
Population outlook (Ouachita County) Hauer SSP2
- Today (2025)
- 163,370 people
- By 2030
- 165,520 · +1.3%
- By 2040
- 167,652 · +2.6%
- By 2050
- 166,699 · +2.0%
- By 2075
- 156,348 · -4.3%
- By 2100
- 134,102 · -17.9%
Race, ethnicity, and origin ACS 2023
- Neighborhood character
- Diverse neighborhood (Simpson 0.55)
- Race & ethnicity
- White 57% Black 35% Two or more races 3% Hispanic / Latino 3% Asian 2%
- Common ancestry
- Lithuanian 3% Slovak 2% Italian 1%
- Foreign-born
- 3% · Vietnam
- Languages at home
- 95% English-only · Spanish 3% Other Indo-European 1% Arabic 1%
Political lean MEDSL · Ouachita
- 2024 margin
- Strong R (+27.9) · D 35.5% · R 63.3% · Other 1.2%
- 2008→2024 swing
- -2.7pp toward R · 2008: -25.2pp · 2024: -27.9pp
- All cycles
- 2024: R+27.9 2020: R+23.6 2016: R+25.4 2012: R+20.9 2008: R+25.2
Not yet ingested
- Civics
- —
Market trends
- HPI YoY
- ▼ -92.35%
- Current HPI
- 196.7468
- Rent YoY
- —
- Metro
- Monroe, LA
- State GDP YoY
- ▲ 3.29%
- F500 in state
- 10
Industry mix (Fortune 500 HQ in LA)
| Industry | F500 HQs | Revenue |
|---|---|---|
| Telecommunications | 2 | $23B |
|
||
| Utilities | 1 | $12B |
|
||
| Wholesale / Distribution | 1 | $5B |
|
||
| Advertising | 1 | $2B |
|
||
Price history
3 events — show timeline
- 2026-04-28 Pending — NELABOR
- 2026-04-24 Listed $188,000 NELABOR
- 2011-09-16 Sold (Public Records) — Public Records
Property tax history
+2.6%/yrLatest (2025): $1,621 · -0.1% YoY. Source: county tax records.
Cash-flow waterfall
monthlySold comps — $/sqft
last 12 mo · ≤1 miLoading sold comps…