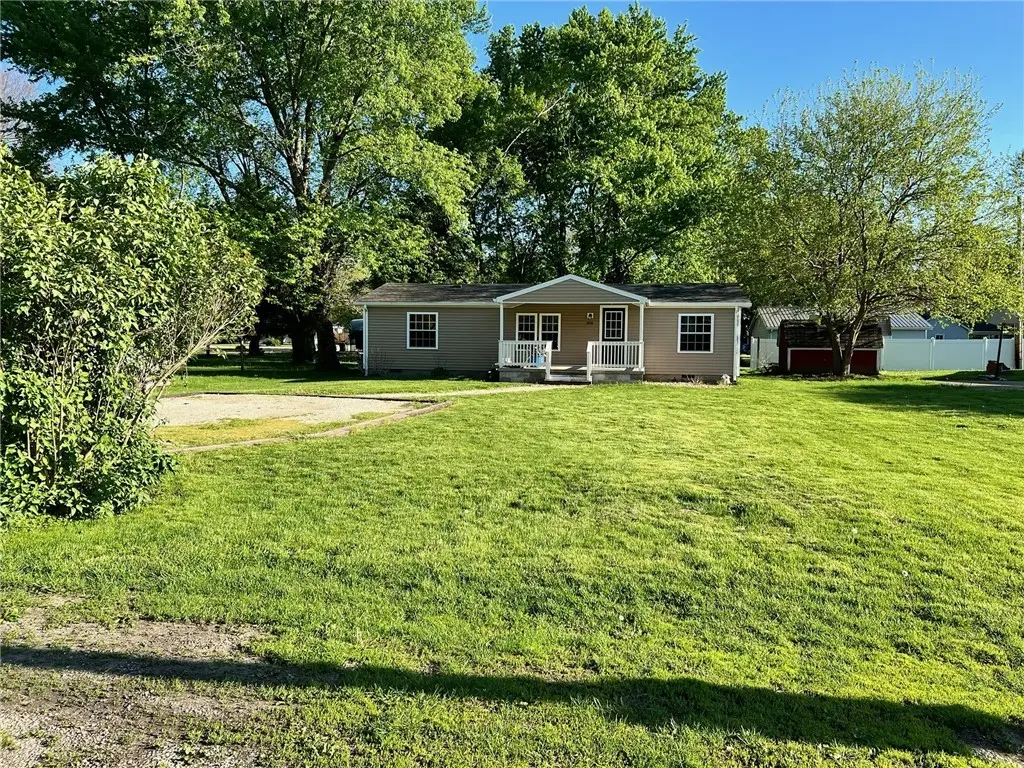
306 Robinson St · Bethany, IL
Flood risk 1/10 · Minimal
- FEMA flood zone
- X (unshaded)
- Chance of flooding over 30 yrs
- 0.0%
- Est. flood insurance / yr
- $507 – $1,088
Fire risk 1/10 · Minimal
- Est. fire insurance / yr
- $804 – $1,492
Heat risk 3/10 · Minor
- Hot days now (above 104°F)
- 7 days/yr
- Hot days in 30 yrs
- 20 days/yr
Wind risk 2/10 · Minimal
- Chance of severe wind over 30 yrs
- 2.0%
Air-quality risk 2/10 · Minimal
- Unhealthy air days now
- 1 days/yr
- Unhealthy air days in 30 yrs
- 2 days/yr
Risk factors via First Street. Map © Google.
Why this score? — see what drove the C grade
The composite is a weighted blend of 9 inputs, each scored 0–100. Each bar is that input's sub-score; the figure is the points it added to the 100-point composite (weight × sub-score).
- Cash flow +20.3/30.0
- Appreciation +9.0/10.0
- DSCR +6.4/10.0
- 1% rule +5.7/10.0
- ARV discount +5.6/15.0
- Livability +3.2/5.0
- Rent growth +2.5/5.0
- Condition / age +2.5/5.0
- Schools +1.8/10.0
$98,000
🖨 Deal sheet 📄 Offer letter ✓ Due diligence
Listing remarks
Charming home located at 306 Robinson in Bethany, offering a comfortable layout and a welcoming feel. This property features spacious living areas, functional design, and a great opportunity to make it your own. Conveniently located with small-town charm while still being within reach of nearby amenities. A solid option for buyers looking for value and potential.
Key facts
- 7,500 sq ft lot
- Built 1993
- Listed 34 days
Property features AI
Finance
- Other: Zoned RES
Exterior
- Utilities: Public water; Public sewer
- Home design: Manufactured single-family residence; One story
- Construction: Vinyl siding; Built as a manufactured home
- Exterior features: Shingle roof; Road surface: Other; Subdivision: Nobles Add
Interior
- Kitchen: Microwave; Oven; Refrigerator
- Bedrooms: 3 total rooms
- Bathrooms: 2 full bathrooms
- Heating & cooling: Natural gas heating; Central air conditioning
- Interior features: Microwave; Oven; Refrigerator; Gas water heater; Water heater; Crawl space basement
- Laundry & utility: Washer; Dryer; Laundry on main level
Neighborhood map
What this means for you Summary
Snapshot
- This is a 3-bed/2.0-bath single-family listed at $98k.
Deal economics
- At list price, monthly cash flow is $126 ($2k/yr) — positive.
- The deal already cash-flows at list — no discount required.
- Meets the 1% rule at list price ($1k rent vs $98k).
- Recommended offer: $95k (3.0% below list) — sets the bar for market timing.
Location & tenants
- Location reads 63/100 on livability (#736 in IL) — a middle-class / working-renter tenant base. Strengths: crime A+, cost of living A+, housing A+; Watch: employment D, schools F, amenities F.
- Okaw Valley CUSD 302 (rural): math 11% / reading 29% proficiency, ranked #424 of 620 in IL (top 68%) — low school quality limits family demand, transient renter base, plan for 1-2y turnover.
- Market conditions: 7 active listings in the ZIP; 42 units permitted in Moultrie County in 2024 (20 in 5+ unit buildings).
Forward outlook
- In year one you build about $8k of equity ($678 loan paydown + $8k appreciation (7.9% local appreciation)).
- Moultrie County population projected at -12% by 2050 — secular population decline; favor cash flow + early exit over multi-decade hold.
- At projected returns (7.9% appreciation + 3.0% rent growth), your $27k cash investment doubles in ~3 years — after that, you're playing with house money.
- By year 5, paydown + projected appreciation supports a ~$38k cash-out refi (75% LTV) — recoverable capital for the next deal without selling this one.
Negotiation context
- It's been on market 34 days — a 3% lower offer ($95k) is reasonable based on typical stale-listing flexibility.
- 2 sale attempts; this cycle's ask has dropped $16k (14%) from the opening price — seller is motivated, your offer sets the floor, not the list.
Questions for the listing agent
- It's been on market 34 days. Have you received any prior offers? Is the seller open to a 3% concession, seller financing, or rate buy-down credit?
- Is there a deadline driving the sale (1031 exchange, divorce, estate, relocation)? That informs how much negotiation room exists.
- Schools are F-rated, which usually means shorter tenancies and higher turnover. Who's the typical renter profile here, and what's been the actual vacancy rate?
- What's the average days-on-market for RENTAL listings here right now (not sales)? A rising rental-DOM trend means longer vacancies and softer asking-rent achievability than the comps imply.
- What's the recent tenant-quality profile in this submarket — average credit score on applications, eviction rate, late-payment / NSF rate, and stable-employment percentage? A property-management company in the area should have these aggregated.
- How much new for-sale + rental construction is in the pipeline within 1–3 miles? Heavy new supply typically softens prices + rents 12–24 months out; constrained supply supports both.
Investment metrics
- 1% rule
- 1.07% ✓
- Cap rate
- 7.83%
- Cash-on-cash
- 5.51%
- DSCR
- 1.24
- GRM
- 7.8
CMA / ARV
- ARV (median comp)
- $94,080
- List price
- $98,000
- Delta
- 21.17%
- Verdict
- OVERPRICED
- Comps
- 20 within 1.0 mi
Show comp detail 12 sales within ~0.75 mi
| Address | Dist | Beds/Ba | Sqft | Sold | Price | $/sf | Match |
|---|---|---|---|---|---|---|---|
| 11 Elm Dr | 0.17mi | 2/1.0 (-1) | 1,056 (0%) | 6mo | $139,000 | $132 | 78 |
| 704 S Saint John St | 0.20mi | 3/1.0 | 960 (-9%) | 4mo | $111,500 | $116 | 68 |
| 716 W Robinson St | 0.24mi | 3/1.0 | 1,154 (+9%) | 3mo | $100,000 | $87 | 67 |
| 1 Elm Dr | 0.11mi | 3/2.0 | 1,212 (+15%) | 5mo | $82,000 | $68 | 66 |
| 407 S Saint John St | 0.07mi | 3/1.0 | 1,152 (+9%) | 18mo | $28,000 | $24 | 62 |
| 601 S Saint John St | 0.14mi | 3/1.5 | 1,200 (+14%) | 18mo | $120,000 | $100 | 54 |
| 505 W Main St | 0.19mi | 2/1.0 (-1) | 924 (-12%) | 11mo | $63,000 | $68 | 52 |
| 44 Meadow Lark Ct | 0.47mi | 3/1.0 | 960 (-9%) | 12mo | $124,000 | $129 | 49 |
| 11 Iola Ct | 0.53mi | 2/1.5 (-1) | 1,164 (+10%) | 5mo | $163,900 | $141 | 47 |
| 16 Iola Ct | 0.53mi | 2/1.0 (-1) | 1,128 (+7%) | 11mo | $105,000 | $93 | 46 |
| 601 N Worth St | 0.57mi | 3/1.0 | 1,104 (+4%) | 19mo | $109,000 | $99 | 46 |
| 7 Lane Dr | 0.56mi | 3/1.0 | 960 (-9%) | 12mo | $115,000 | $120 | 45 |
Match score weights: distance 35% · size 25% · config 20% · recency 20%. Top-matched comps best support the ARV.
Projected returns pro-forma
7.93% appreciation · 3.0% rent growth · sell at horizon
- IRR
- 24.1%
- Equity multiple
- 2.75×
- Total profit
- $47,974
- Equity at exit
- $73,980
- IRR
- 21.9%
- Equity multiple
- 5.86×
- Total profit
- $133,276
- Equity at exit
- $146,401
Cash invested: $27,440 (down + closing). Projections, not guarantees.
Landlord ↔ Tenant lean methodology
- Overall (STATE)
- 43 Moderately Tenant-Leaning
- State Illinois
- 43 Moderately Tenant-Leaning · D+7
- County
- — inherits STATE
- City
- — inherits STATE
ZIP-level market 61914
- Home prices YoY
- 4.2%
- Active inventory
- 7
- Price-to-rent
- 7.8×
Monthly cashflow live
- Estimated rent
- $1,044 medium interval (Pro) →
- Mortgage (P&I)
- −$514
- Tax from tax record
- −$144 /mo · $1,729/yr
- Insurance
- −$41
- HOA
- −$0
- Vacancy / Maint / Mgmt
- −$219
- Net cashflow
- $126
Break-even live
UW: 25.0% down · 7.5% · 30yr · 1.5% tax · 5.0% vac · 8.0% maint · 8.0% mgmt
Financing live
Cash to close
- Down payment
- $24,500
- Closing costs
- $2,940
- Reserves months
- —
- Total cash needed
- —
Loan-product check · same deal, 3 products live
Conventional
25% down · 7.5% · 30yr
- Down + closing
- —
- Monthly P&I
- —
- Monthly cashflow
- —
- DSCR
- —
- Eligible?
- —
Personal DTI + credit; lowest rate.
DSCR
20% down · 8.5% · 30yr
- Down + closing
- —
- Monthly P&I
- —
- Monthly cashflow
- —
- DSCR
- —
- Eligible?
- —
No personal income docs; deal must DSCR.
Hard money
10% down · 12.0% · 12mo
- Down + closing
- —
- Monthly P&I
- —
- Monthly cashflow
- —
- DSCR
- —
- Eligible?
- —
Short-term bridge; refi at stabilization.
Listing history 19 events
-
2026-06-18days on market $98,000 Active 34 DOM
-
2026-06-17days on market $98,000 Active 33 DOM
-
2026-06-16price $98,000 Active 32 DOM
-
2026-06-16days on market $114,000 Active 32 DOM
-
2026-06-15days on market $114,000 Active 31 DOM
-
2026-06-14days on market $114,000 Active 29 DOM
-
2026-06-13days on market $114,000 Active 28 DOM
-
2026-06-10days on market $114,000 Active 26 DOM
-
2026-06-09days on market $114,000 Active 25 DOM
-
2026-06-08days on market $114,000 Active 24 DOM
-
2026-06-07days on market $114,000 Active 23 DOM
-
2026-06-05days on market $114,000 Active 20 DOM
-
2026-06-03days on market $114,000 Active 19 DOM
-
2026-06-02days on market $114,000 Active 18 DOM
-
2026-06-01days on market $114,000 Active 17 DOM
-
2026-05-31days on market $114,000 Active 16 DOM
-
2026-05-30days on market $114,000 Active 15 DOM
-
2026-05-11status Pending 365-char remark
-
2026-04-28$114,000 Active 365-char remark
ⓘ Source: listings_history table (triggers on properties + properties_extension) + one-shot
backfill from property_details.listing_events for pre-trigger history.
Tax reassessment forecast IL · Partial reset (capped growth)
- Current annual tax
- $1,729 · $144/mo
- Projected year-2 tax
- $1,977 · $165/mo
- Expected delta
- +$248/yr (+$21/mo · 14.3%)
ⓘ Screening estimate from a state-policy table — verify with the county assessor before closing.
Climate risk First Street
- Flood 1/10 Low FEMA zone X (unshaded) · 0% chance over 30 yrs
- Wildfire 1/10 Low
- Heat 3/10 Moderate 7 d/yr ≥104°F today · 20 d/yr by 30 yrs out
- Wind 2/10 Low 2% chance of damaging wind over 30 yrs
- Air quality 2/10 Low 1 unhealthy d/yr today · 2 by 30 yrs out
Nearby sold comps map
Loading sold comps map…
Walkable amenities ~0.75 mi
Loading nearby amenities…
Taxation est. · year 1
- Rental income
- $12,528
- − Mortgage interest
- −$5,490
- − Property taxes
- −$1,729
- − Insurance
- −$490
- − Repairs & maintenance
- −$1,002
- − Management
- −$1,002
- − Depreciation
- −$2,851
- Taxable loss
- −$36
- Est. tax savings @ 24.0%
- +$9
- After-tax cash flow
- $1,520/yr
For passive investors: Depreciation is non-cash, so a rental often shows a tax loss while cash-flowing — sheltering income. Rental losses are passive: they offset passive income freely, and up to $25,000/yr can offset ordinary (W-2) income if you actively participate and your MAGI is under $100k (phasing out to $0 by $150k); unused losses carry forward. On sale, claimed depreciation is recaptured at up to 25%, and gains may owe capital-gains tax (a 1031 exchange can defer both). Figures are a year-1 estimate at your 24.0% rate — not tax advice; consult a CPA.
Schools (NCES district)
- District
- Okaw Valley CUSD 302
- NCES district ID
- 1700223
- Math proficiency
- 11% ▲ 2.00%
- Reading proficiency
- 29% ▼ -5.00%
- Median HH income
- $48,236
- Composite
- 17.67/100
- National rank
- #9028
- State rank
- #424 of 620 in IL
Livability — Bethany
- Score
- 63/100
- State rank
- #736
- US rank
- #14904
Category grades
Schools grade is shown separately in the Schools card above.
Census & demographics
- Census place
- Bethany, IL
- Population (ZIP)
- 1,855
Population outlook (Moultrie County) Hauer SSP2
- Today (2025)
- 14,766 people
- By 2030
- 14,490 · -1.9%
- By 2040
- 13,848 · -6.2%
- By 2050
- 13,063 · -11.5%
- By 2075
- 10,862 · -26.4%
- By 2100
- 7,963 · -46.1%
Race, ethnicity, and origin ACS 2023
- Neighborhood character
- Predominantly White (97%)
- Race & ethnicity
- White 97% Two or more races 2% Hispanic / Latino 1%
- Common ancestry
- Italian 3% Iranian 2% Serbian 2%
- Foreign-born
- 1%
Political lean MEDSL · Moultrie
- 2024 margin
- Solid R (+49.1) · D 24.8% · R 73.8% · Other 1.4%
- 2008→2024 swing
- -36.2pp toward R · 2008: -12.8pp · 2024: -49.1pp
- All cycles
- 2024: R+49.1 2020: R+49.0 2016: R+48.0 2012: R+27.1 2008: R+12.8
Not yet ingested
- Civics
- —
Market trends
- HPI YoY
- ▲ 7.93%
- Current HPI
- 197.4905
- Rent YoY
- —
- Metro
- —
- State GDP YoY
- ▲ 1.59%
- F500 in state
- 60
Industry mix (Fortune 500 HQ in IL)
| Industry | F500 HQs | Revenue |
|---|---|---|
| Insurance | 4 | $201B |
|
||
| Consumer Goods | 4 | $87B |
|
||
| Industrial Machinery | 3 | $64B |
|
||
| Healthcare | 2 | $55B |
|
||
| Retail / Pharmacy | 1 | $148B |
|
||
| Agriculture / Food | 1 | $86B |
|
||
Price history
-14.0% since first listed4 events — show timeline
- 2026-06-16 Price Changed $98,000 CIBR
- 2026-05-27 Relisted — CIBR
- 2026-05-11 Pending — CIBR
- 2026-04-28 Listed $114,000 CIBR
Property tax history
+3.3%/yrLatest (2024): $1,729 · +12.1% YoY. Source: county tax records.
Cash-flow waterfall
monthlySold comps — $/sqft
last 12 mo · ≤1 miLoading sold comps…