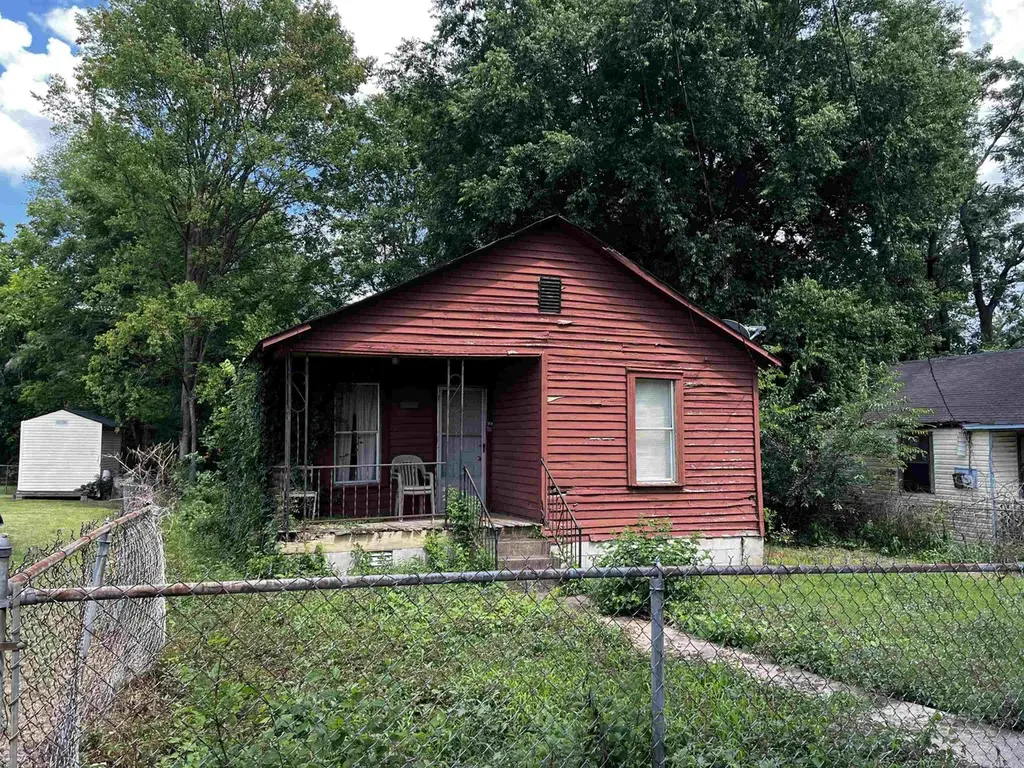
3319 Short Spring St · Little Rock, AR
Flood risk 1/10 · Minimal
- FEMA flood zone
- X (unshaded)
- Chance of flooding over 30 yrs
- 0.0%
- Est. flood insurance / yr
- $507 – $1,088
Fire risk 1/10 · Minimal
- Est. fire insurance / yr
- $1,499 – $2,785
Heat risk 7/10 · Major
- Hot days now (above 110°F)
- 7 days/yr
- Hot days in 30 yrs
- 19 days/yr
Wind risk 4/10 · Minor
- Chance of severe wind over 30 yrs
- 12.0%
Air-quality risk 2/10 · Minimal
- Unhealthy air days now
- 1 days/yr
- Unhealthy air days in 30 yrs
- 1 days/yr
Risk factors via First Street. Map © Google.
Why this score? — see what drove the B- grade
The composite is a weighted blend of 9 inputs, each scored 0–100. Each bar is that input's sub-score; the figure is the points it added to the 100-point composite (weight × sub-score).
- Cash flow +30.0/30.0
- 1% rule +10.0/10.0
- DSCR +10.0/10.0
- ARV discount +7.5/15.0
- Livability +3.7/5.0
- Rent growth +3.3/5.0
- Condition / age +2.5/5.0
- Schools +2.1/10.0
- Appreciation +0.0/10.0
$23,000
🖨 Deal sheet 📄 Offer letter ✓ Due diligence
Listing remarks MLS
This one needs work but could be a great property with the right owner making the needed renovations. Completely fenced yard. Sitting on a dead end street so not a lot of traffic to worry about. Bring your hammer, nails and some know how to get this one back to pristine condition. Priced to sale quickly. No Seller Property Disclosure. Sold AS IS with any contents remaining. Some floors and porch have some issues so enter at your own risk.
Key facts
- Fenced yard
- Dead end street
- Sold as is
Tags
Neighborhood map
What this means for you Summary
Snapshot
- This is a 2-bed/1.0-bath single-family listed at $23k.
Deal economics
- At list price, monthly cash flow is $511 ($6k/yr) — positive.
- The deal already cash-flows at list — no discount required.
- Meets the 1% rule at list price ($844 rent vs $23k).
- Recommended offer: $20k (12.0% below list) — sets the bar for market timing.
- Cap rate 32.9% vs local median 4.1% in Little Rock — top-decile yield for the area; either an underpriced asset or a hidden risk that comps aren't pricing in. Stress-test before assuming the spread holds.
Location & tenants
- Location reads 73/100 on livability (#22 in AR) — a middle-class / working-renter tenant base. Strengths: commute A+, cost of living A+, housing A+; Watch: crime F.
- Little Rock School District (urban): math 23% / reading 26% proficiency, ranked #183 of 238 in AR (top 77%) — low school quality limits family demand, transient renter base, plan for 1-2y turnover; 69% free/reduced lunch — lower-income household profile, screen leases tightly.
- Market conditions: Rents rising (+3.4%/yr); 125 active listings in the ZIP; 3 comparable units currently listed for rent nearby; rentals at typical pace (median 24d on market — plan ~3-4 weeks tenant-placement turnaround); 1,006 units permitted in Pulaski County in 2024 (0 in 5+ unit buildings).
Forward outlook
- Local home prices are declining (-3.0%/yr); year-one equity from $159 of loan paydown is wiped out by about $690 of value loss. Plan a longer hold.
- Pulaski County population projected at +6% by 2050 — modest demand growth; plan on rents tracking national, not racing it.
- At projected returns (-3.0% appreciation + 3.4% rent growth), your $6k cash investment doubles in ~2 years — after that, you're playing with house money.
Negotiation context
- It's been on market 341 days — a 12% lower offer ($20k) is reasonable based on typical stale-listing flexibility.
- 2 sale attempts with the ask held roughly flat each time — persistent listings suggest the price (not the market) is what's stuck; bring a comps-based counter.
Risks & watch-outs
- Watch-outs: built in 1946 — expect roof / HVAC / electrical / plumbing capex.
- Climate carrying-cost: extreme-heat days projected 7→19/yr by 2055 (HVAC capex compounding) — expect insurance premiums to compound above CPI over the hold.
Questions for the listing agent
- It's been on market 341 days. Have you received any prior offers? Is the seller open to a 12% concession, seller financing, or rate buy-down credit?
- Built in 1946 — when were the roof, HVAC, electrical panel, plumbing, and water heater last replaced?
- Why hasn't it sold? Are there any deal-killer items the seller is aware of (foundation, flood, title, zoning, code violations)?
- Is there a deadline driving the sale (1031 exchange, divorce, estate, relocation)? That informs how much negotiation room exists.
- Crime grade is F in this area — have there been break-ins, vandalism, or insurance claims at this property in the last 3 years? What carrier currently insures it and at what premium?
- What's the average days-on-market for RENTAL listings here right now (not sales)? A rising rental-DOM trend means longer vacancies and softer asking-rent achievability than the comps imply.
- What's the recent tenant-quality profile in this submarket — average credit score on applications, eviction rate, late-payment / NSF rate, and stable-employment percentage? A property-management company in the area should have these aggregated.
- How much new for-sale + rental construction is in the pipeline within 1–3 miles? Heavy new supply typically softens prices + rents 12–24 months out; constrained supply supports both.
Investment metrics
- 1% rule
- 3.67% ✓
- Cap rate
- 32.94%
- Cash-on-cash
- 95.17%
- DSCR
- 5.23
- GRM
- 2.3
CMA / ARV
- ARV (median comp)
- $79,558
- List price
- $23,000
- Delta
- -71.09%
- Verdict
- UNDERPRICED
- Comps
- 6 within 1.0 mi
Projected returns pro-forma
-3.0% appreciation · 3.36% rent growth · sell at horizon
- IRR
- 96.5%
- Equity multiple
- 5.52×
- Total profit
- $29,121
- Equity at exit
- $3,429
- IRR
- 99.2%
- Equity multiple
- 11.65×
- Total profit
- $68,558
- Equity at exit
- $1,989
Cash invested: $6,440 (down + closing). Projections, not guarantees.
Landlord ↔ Tenant lean methodology
- Overall (STATE)
- 92 Strongly Landlord-Friendly
- State Arkansas
- 92 Strongly Landlord-Friendly · R+14
- County
- — inherits STATE
- City
- — inherits STATE
ZIP-level market 72206
- Rents YoY
- 3.4%
- Active inventory
- 125
- Price-to-rent
- 2.3×
Monthly cashflow live
- Estimated rent
- $844 medium interval (Pro) →
- Mortgage (P&I)
- −$121
- Tax from tax record
- −$26 /mo · $310/yr
- Insurance
- −$10
- HOA
- −$0
- Vacancy / Maint / Mgmt
- −$177
- Net cashflow
- $511
Break-even live
UW: 25.0% down · 7.5% · 30yr · 1.5% tax · 5.0% vac · 8.0% maint · 8.0% mgmt
Financing live
Cash to close
- Down payment
- $5,750
- Closing costs
- $690
- Reserves months
- —
- Total cash needed
- —
Loan-product check · same deal, 3 products live
Conventional
25% down · 7.5% · 30yr
- Down + closing
- —
- Monthly P&I
- —
- Monthly cashflow
- —
- DSCR
- —
- Eligible?
- —
Personal DTI + credit; lowest rate.
DSCR
20% down · 8.5% · 30yr
- Down + closing
- —
- Monthly P&I
- —
- Monthly cashflow
- —
- DSCR
- —
- Eligible?
- —
No personal income docs; deal must DSCR.
Hard money
10% down · 12.0% · 12mo
- Down + closing
- —
- Monthly P&I
- —
- Monthly cashflow
- —
- DSCR
- —
- Eligible?
- —
Short-term bridge; refi at stabilization.
Rent comps 3 comps
| Address | Beds | Baths | Sqft | Rent | $/sqft | DOM | Units | Dist |
|---|---|---|---|---|---|---|---|---|
| 3122 S Arch St Little Rock, AR | 2.0 | 1.0 | 654 | $725 | $1.11 | 23d | 1 | 0.16mi |
| 901 W Charles Bussey Ave Unit C Little Rock, AR | 1.0 | 1.0 | 686 | $895 | $1.30 | 14d | 1 | 0.93mi |
| 1302 Scott St Unit 303B Little Rock, AR | 1.0 | 1.0 | 562 | $1,015 | $1.81 | 23d | 1 | 1.34mi |
Listing history 18 events
-
2026-06-18days on market $23,000 Active 341 DOM
-
2026-06-17days on market $23,000 Active 340 DOM
-
2026-06-16days on market $23,000 Active 339 DOM
-
2026-06-15days on market $23,000 Active 338 DOM
-
2026-06-14days on market $23,000 Active 336 DOM
-
2026-06-13days on market $23,000 Active 335 DOM
-
2026-06-10days on market $23,000 Active 333 DOM
-
2026-06-09days on market $23,000 Active 332 DOM
-
2026-06-08days on market $23,000 Active 331 DOM
-
2026-06-05days on market $23,000 Active 327 DOM
-
2026-06-03days on market $23,000 Active 326 DOM
-
2026-06-02days on market $23,000 Active 325 DOM
-
2026-06-01days on market $23,000 Active 324 DOM
-
2026-05-31days on market $23,000 Active 323 DOM
-
2026-05-31days on market $23,000 Active 322 DOM
-
2026-04-28status Back on Market 442-char remark
Show marketing remark (442 chars)
This one needs work but could be a great property with the right owner making the needed renovations. Completely fenced yard. Sitting on a dead end street so not a lot of traffic to worry about. Bring your hammer, nails and some know how to get this one back to pristine condition. Priced to sale quickly. No Seller Property Disclosure. Sold AS IS with any contents remaining. Some floors and porch have some issues so enter at your own risk.
-
2026-03-18historical Take Backups 442-char remark
Show marketing remark (442 chars)
This one needs work but could be a great property with the right owner making the needed renovations. Completely fenced yard. Sitting on a dead end street so not a lot of traffic to worry about. Bring your hammer, nails and some know how to get this one back to pristine condition. Priced to sale quickly. No Seller Property Disclosure. Sold AS IS with any contents remaining. Some floors and porch have some issues so enter at your own risk.
-
2025-07-12$23,000 New Listing 442-char remark
Show marketing remark (442 chars)
This one needs work but could be a great property with the right owner making the needed renovations. Completely fenced yard. Sitting on a dead end street so not a lot of traffic to worry about. Bring your hammer, nails and some know how to get this one back to pristine condition. Priced to sale quickly. No Seller Property Disclosure. Sold AS IS with any contents remaining. Some floors and porch have some issues so enter at your own risk.
ⓘ Source: listings_history table (triggers on properties + properties_extension) + one-shot
backfill from property_details.listing_events for pre-trigger history.
Tax reassessment forecast AR · Resets to sale price
- Current annual tax
- $310 · $26/mo
- Projected year-2 tax
- $310 · $26/mo
- Expected delta
- $0/yr ($0/mo · 0.0%)
ⓘ Screening estimate from a state-policy table — verify with the county assessor before closing.
Climate risk First Street
- Flood 1/10 Low FEMA zone X (unshaded) · 0% chance over 30 yrs
- Wildfire 1/10 Low
- Heat 7/10 Severe 7 d/yr ≥110°F today · 19 d/yr by 30 yrs out
- Wind 4/10 Moderate 12% chance of damaging wind over 30 yrs
- Air quality 2/10 Low 1 unhealthy d/yr today · 1 by 30 yrs out
Nearby sold comps map
Loading sold comps map…
Walkable amenities ~0.75 mi
Loading nearby amenities…
Taxation est. · year 1
- Rental income
- $10,128
- − Mortgage interest
- −$1,288
- − Property taxes
- −$310
- − Insurance
- −$115
- − Repairs & maintenance
- −$810
- − Management
- −$810
- − Depreciation
- −$669
- Taxable income
- $6,125
- Est. tax owed @ 24.0%
- −$1,470
- After-tax cash flow
- $4,659/yr
For passive investors: Depreciation is non-cash, so a rental often shows a tax loss while cash-flowing — sheltering income. Rental losses are passive: they offset passive income freely, and up to $25,000/yr can offset ordinary (W-2) income if you actively participate and your MAGI is under $100k (phasing out to $0 by $150k); unused losses carry forward. On sale, claimed depreciation is recaptured at up to 25%, and gains may owe capital-gains tax (a 1031 exchange can defer both). Figures are a year-1 estimate at your 24.0% rate — not tax advice; consult a CPA.
Schools (NCES district)
- District
- Little Rock School District
- NCES district ID
- 0509000
- Math proficiency
- 23% ▼ -12.00%
- Reading proficiency
- 26% ▼ -8.00%
- Median HH income
- $43,346
- Composite
- 21.0/100
- National rank
- #8457
- State rank
- #183 of 238 in AR
Livability — Little Rock
- Score
- 73/100
- State rank
- #22
- US rank
- #5295
Category grades
Schools grade is shown separately in the Schools card above.
Census & demographics
- Census place
- Little Rock, AR
- County
- Pulaski County · 372,764 people
- City population
- 218,896
- Metro
- Little Rock-North Little Rock-Conway, AR
- Population (ZIP)
- 22,667
- Household income
- $52,132
- Rent vs Own
- Severe rent burden
- 623.0
Population outlook (Pulaski County) Hauer SSP2
- Today (2025)
- 415,378 people
- By 2030
- 423,720 · +2.0%
- By 2040
- 435,182 · +4.8%
- By 2050
- 440,904 · +6.1%
- By 2075
- 445,521 · +7.3%
- By 2100
- 419,173 · +0.9%
Race, ethnicity, and origin ACS 2023
- Neighborhood character
- Diverse neighborhood (Simpson 0.59)
- Race & ethnicity
- Black 48% White 43% Two or more races 6% Hispanic / Latino 5%
- Hispanic origin (detail)
- Mexican 4%
- Common ancestry
- Iranian 1% Italian 1% Lithuanian 1%
- Foreign-born
- 1% · Canada
- Languages at home
- 94% English-only · Spanish 5%
Political lean MEDSL · Pulaski
- 2024 margin
- Strong D (+22.1) · D 59.8% · R 37.7% · Other 2.5%
- 2008→2024 swing
- +10.6pp toward D · 2008: 11.6pp · 2024: 22.1pp
- All cycles
- 2024: D+22.1 2020: D+22.5 2016: D+17.9 2012: D+11.4 2008: D+11.6
Not yet ingested
- Civics
- —
Market trends
- HPI YoY
- ▼ -88.64%
- Current HPI
- 158.3601
- Rent YoY
- ▲ 3.36%
- Metro
- Little Rock-North Little Rock-Conway, AR
- State GDP YoY
- ▲ 3.80%
- F500 in state
- 10
Industry mix (Fortune 500 HQ in AR)
| Industry | F500 HQs | Revenue |
|---|---|---|
| Retail | 1 | $681B |
|
||
| Food / Agriculture | 1 | $53B |
|
||
| Retail / Energy | 1 | $22B |
|
||
| Transportation / Logistics | 1 | $12B |
|
||
| Energy | 1 | $4B |
|
||
Price history
3 events — show timeline
- 2026-04-28 Relisted — CARMLS
- 2026-03-18 Contingent — CARMLS
- 2025-07-12 Listed $23,000 CARMLS
Property tax history
+1.0%/yrLatest (2025): $310 · +7.8% YoY. Source: county tax records.
Cash-flow waterfall
monthlySold comps — $/sqft
last 12 mo · ≤1 miLoading sold comps…