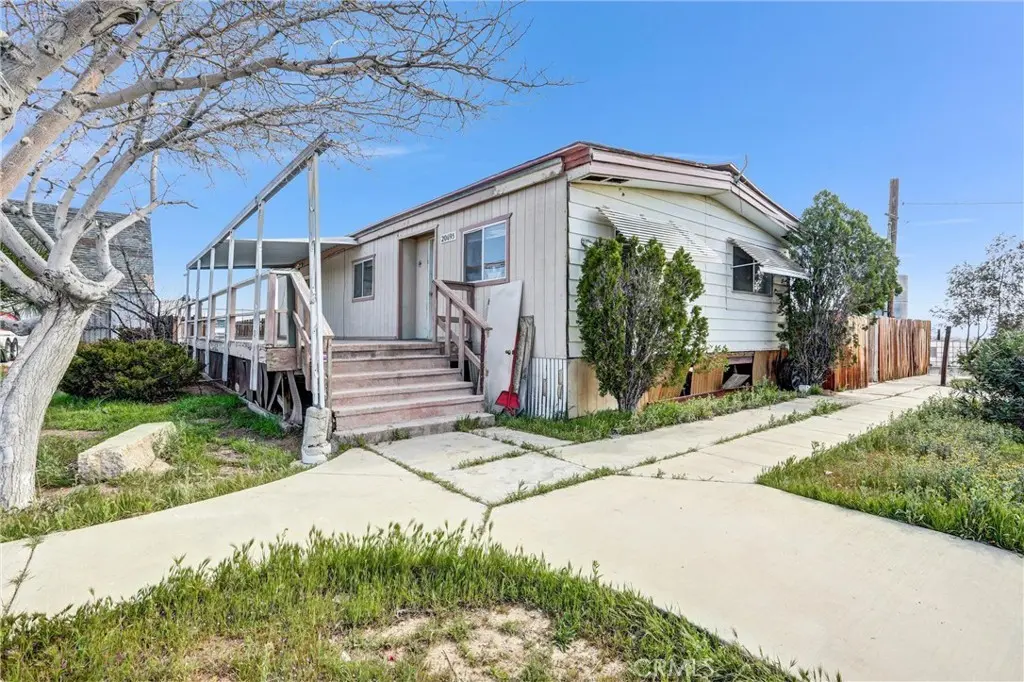
20695 Dale Evans Pkwy · Apple Valley, CA
Flood risk 1/10 · Minimal
- FEMA flood zone
- D
- Chance of flooding over 30 yrs
- 0.0%
- Est. flood insurance / yr
- $544 – $1,084
Fire risk 6/10 · Moderate
- Est. fire insurance / yr
- $659 – $1,223
Heat risk 7/10 · Major
- Hot days now (above 99°F)
- 7 days/yr
- Hot days in 30 yrs
- 20 days/yr
Wind risk 1/10 · Minimal
- Chance of severe wind over 30 yrs
- —
Air-quality risk 9/10 · Severe
- Unhealthy air days now
- 21 days/yr
- Unhealthy air days in 30 yrs
- 26 days/yr
Risk factors via First Street. Map © Google.
Why this score? — see what drove the B- grade
The composite is a weighted blend of 9 inputs, each scored 0–100. Each bar is that input's sub-score; the figure is the points it added to the 100-point composite (weight × sub-score).
- Cash flow +26.4/30.0
- ARV discount +15.0/15.0
- DSCR +9.0/10.0
- 1% rule +5.9/10.0
- Rent growth +3.9/5.0
- Schools +3.1/10.0
- Livability +3.1/5.0
- Condition / age +2.5/5.0
- Appreciation +0.0/10.0
$199,000
🖨 Deal sheet (PDF) 📄 Offer letter ✓ Due diligence
Listing remarks MLS
Manufactured home on 1.26 acres zoned Commercial-NEC in Apple Valley. Flat, usable parcel with frontage along Dale Evans Pkwy. Property includes a detached two-story garage and a separate shed/workshop, offering flexible utility for storage, work space, or future use. Ideal for owner-user, redevelopment, or future commercial potential. Adjacent parcel also available, creating a rare land assemblage opportunity. Buyer to verify zoning, permitted uses, and utilities.
Key facts
- 1.26 acre lot
- 4 garage spots
- Built 1975
Neighborhood map
What this means for you Summary
Snapshot
- This is a 3-bed/2.0-bath manufactured listed at $199k.
Deal economics
- At list price, monthly cash flow is $517 ($6k/yr) — positive.
- The deal already cash-flows at list — no discount required.
- Meets the 1% rule at list price ($2k rent vs $199k).
- Recommended offer: $175k (12.0% below list) — sets the bar for market timing.
- Cap rate 9.4% vs local median 3.5% in Apple Valley — top-decile yield for the area; either an underpriced asset or a hidden risk that comps aren't pricing in. Stress-test before assuming the spread holds.
Location & tenants
- Location reads 61/100 on livability (#532 in CA) — a middle-class / working-renter tenant base. Strengths: housing A+, commute B+; Watch: employment D+, schools F, crime D-.
- Apple Valley Unified (suburban): math 25% / reading 40% proficiency, ranked #955 of 1,400 in CA (top 68%) — families likely to look elsewhere, expect single-tenant / working-renter base with shorter leases; 60% free/reduced lunch — lower-income household profile, screen leases tightly.
- Market conditions: Rents rising fast (+5.5%/yr); 538 active listings in the ZIP; solid renter incomes; 5,458 units permitted in San Bernardino County in 2024 (1,500 in 5+ unit buildings).
- This rent runs 34% of the median local income ($77k/yr) — at the standard rent-burdened threshold; future hikes will face affordability resistance.
Forward outlook
- Local home prices are declining (-3.0%/yr); year-one equity from $1k of loan paydown is wiped out by about $6k of value loss. Plan a longer hold.
- San Bernardino County population projected at +15% by 2050 — modest demand growth; plan on rents tracking national, not racing it.
- At projected returns (-3.0% appreciation + 5.5% rent growth), your $56k cash investment doubles in ~9 years — after that, you're playing with house money.
Negotiation context
- It's been on market 127 days — a 12% lower offer ($175k) is reasonable based on typical stale-listing flexibility.
- 4 sale attempts since 10y ago; this cycle's ask has dropped $20k (9%) from the opening price — seller is motivated, your offer sets the floor, not the list.
- Current owner paid $110k; list at $199k implies a 81% gain — meaningful room to come down on a strong offer.
Risks & watch-outs
- Climate carrying-cost: major wildfire risk; extreme-heat days projected 7→20/yr by 2055 (HVAC capex compounding) — expect insurance premiums to compound above CPI over the hold.
Questions for the listing agent
- It's been on market 127 days. Have you received any prior offers? Is the seller open to a 12% concession, seller financing, or rate buy-down credit?
- Built in 1975 — when were the roof, HVAC, electrical panel, plumbing, and water heater last replaced?
- Why hasn't it sold? Are there any deal-killer items the seller is aware of (foundation, flood, title, zoning, code violations)?
- Is there a deadline driving the sale (1031 exchange, divorce, estate, relocation)? That informs how much negotiation room exists.
- Schools are F-rated, which usually means shorter tenancies and higher turnover. Who's the typical renter profile here, and what's been the actual vacancy rate?
- Crime grade is D in this area — have there been break-ins, vandalism, or insurance claims at this property in the last 3 years? What carrier currently insures it and at what premium?
- What's the average days-on-market for RENTAL listings here right now (not sales)? A rising rental-DOM trend means longer vacancies and softer asking-rent achievability than the comps imply.
- What's the recent tenant-quality profile in this submarket — average credit score on applications, eviction rate, late-payment / NSF rate, and stable-employment percentage? A property-management company in the area should have these aggregated.
- How much new for-sale + rental construction is in the pipeline within 1–3 miles? Heavy new supply typically softens prices + rents 12–24 months out; constrained supply supports both.
Investment metrics
- 1% rule
- 1.09% ✓
- Cap rate
- 9.41%
- Cash-on-cash
- 11.14%
- DSCR
- 1.50
- GRM
- 7.6
CMA / ARV
- ARV (median comp)
- $374,188
- List price
- $199,000
- Delta
- -46.82%
- Verdict
- UNDERPRICED
- Comps
- 1 within 2.0 mi
Projected returns pro-forma
-3.0% appreciation · 5.48% rent growth · sell at horizon
- IRR
- 2.8%
- Equity multiple
- 1.11×
- Total profit
- $6,153
- Equity at exit
- $29,672
- IRR
- 14.4%
- Equity multiple
- 2.28×
- Total profit
- $71,384
- Equity at exit
- $17,206
Cash invested: $55,720 (down + closing). Projections, not guarantees.
Landlord ↔ Tenant lean methodology
- Overall (STATE)
- 18 Strongly Tenant-Friendly
- State California
- 18 Strongly Tenant-Friendly · D+13
- County
- — inherits STATE
- City
- — inherits STATE
ZIP-level market 92307
- Rents YoY
- 5.5%
- Active inventory
- 538
- Price-to-rent
- 7.6×
Monthly cashflow live
- Estimated rent
- $2,168 medium interval (Pro) →
- Mortgage (P&I)
- −$1,044
- Tax from tax record
- −$69 /mo · $830/yr
- Insurance
- −$83
- HOA
- −$0
- Vacancy / Maint / Mgmt
- −$455
- Net cashflow
- $517
Break-even live
Sensitivity live
| Price | -10% $630 | -5% $573 | +0% $517 | +5% $461 | +10% $404 |
|---|---|---|---|---|---|
| Rent | -10% $346 | -5% $431 | +0% $517 | +5% $603 | +10% $688 |
| Rate | -1.0pp $617 | -0.5pp $568 | base $517 | +0.5pp $466 | +1.0pp $413 |
UW: 25.0% down · 7.5% · 30yr · 1.5% tax · 5.0% vac · 8.0% maint · 8.0% mgmt
Financing live
Cash to close
- Down payment
- $49,750
- Closing costs
- $5,970
- Reserves months
- —
- Total cash needed
- —
Loan-product check · same deal, 3 products live
Conventional
25% down · 7.5% · 30yr
- Down + closing
- —
- Monthly P&I
- —
- Monthly cashflow
- —
- DSCR
- —
- Eligible?
- —
Personal DTI + credit; lowest rate.
DSCR
20% down · 8.5% · 30yr
- Down + closing
- —
- Monthly P&I
- —
- Monthly cashflow
- —
- DSCR
- —
- Eligible?
- —
No personal income docs; deal must DSCR.
Hard money
10% down · 12.0% · 12mo
- Down + closing
- —
- Monthly P&I
- —
- Monthly cashflow
- —
- DSCR
- —
- Eligible?
- —
Short-term bridge; refi at stabilization.
Listing history 26 events
-
2026-06-21days on market $199,000 Active 127 DOM
-
2026-06-18days on market $199,000 Active 124 DOM
-
2026-06-17days on market $199,000 Active 123 DOM
-
2026-06-16days on market $199,000 Active 122 DOM
-
2026-06-15days on market $199,000 Active 121 DOM
-
2026-06-13days on market $199,000 Active 119 DOM
-
2026-06-13days on market $199,000 Active 118 DOM
-
2026-06-09days on market $199,000 Active 115 DOM
-
2026-06-08days on market $199,000 Active 114 DOM
-
2026-06-07days on market $199,000 Active 113 DOM
-
2026-06-04days on market $199,000 Active 110 DOM
-
2026-06-03days on market $199,000 Active 109 DOM
-
2026-06-02days on market $199,000 Active 108 DOM
-
2026-06-01days on market $199,000 Active 107 DOM
-
2026-05-31days on market $199,000 Active 106 DOM
-
2026-05-04price $199,000 469-char remark
Show marketing remark (469 chars)
Manufactured home on 1.26 acres zoned Commercial-NEC in Apple Valley. Flat, usable parcel with frontage along Dale Evans Pkwy. Property includes a detached two-story garage and a separate shed/workshop, offering flexible utility for storage, work space, or future use. Ideal for owner-user, redevelopment, or future commercial potential. Adjacent parcel also available, creating a rare land assemblage opportunity. Buyer to verify zoning, permitted uses, and utilities.
-
2026-02-14$219,000 Active 469-char remark
Show marketing remark (469 chars)
Manufactured home on 1.26 acres zoned Commercial-NEC in Apple Valley. Flat, usable parcel with frontage along Dale Evans Pkwy. Property includes a detached two-story garage and a separate shed/workshop, offering flexible utility for storage, work space, or future use. Ideal for owner-user, redevelopment, or future commercial potential. Adjacent parcel also available, creating a rare land assemblage opportunity. Buyer to verify zoning, permitted uses, and utilities.
-
2026-02-09historical $219,000 469-char remark
Show marketing remark (469 chars)
Manufactured home on 1.26 acres zoned Commercial-NEC in Apple Valley. Flat, usable parcel with frontage along Dale Evans Pkwy. Property includes a detached two-story garage and a separate shed/workshop, offering flexible utility for storage, work space, or future use. Ideal for owner-user, redevelopment, or future commercial potential. Adjacent parcel also available, creating a rare land assemblage opportunity. Buyer to verify zoning, permitted uses, and utilities.
-
2019-07-09soldstatus $110,000 458-char remark
Show marketing remark (458 chars)
Manufactured home with large detached 2 car garage and bonus loft area plus a house close to the Walmart Distribution Center. Zoning was changed from Residential to Office Professional. This listing is for 2 parcels. Association Amenities: None # of RV Spaces: 0NONE Lot Location Type: Standard Location Landscaping: Natural Patio and Porch Features: Covered Deck Special Features: None Spa Features: Hauled # of Attached Spaces: 0 # of Detached Spaces: 2
-
2019-07-09soldstatus $110,000
Show marketing remark (458 chars)
Manufactured home with large detached 2 car garage and bonus loft area plus a house close to the Walmart Distribution Center. Zoning was changed from Residential to Office Professional. This listing is for 2 parcels. Association Amenities: None # of RV Spaces: 0NONE Lot Location Type: Standard Location Landscaping: Natural Patio and Porch Features: Covered Deck Special Features: None Spa Features: Hauled # of Attached Spaces: 0 # of Detached Spaces: 2
-
2019-06-10$139,000 458-char remark
Show marketing remark (458 chars)
Manufactured home with large detached 2 car garage and bonus loft area plus a house close to the Walmart Distribution Center. Zoning was changed from Residential to Office Professional. This listing is for 2 parcels. Association Amenities: None # of RV Spaces: 0NONE Lot Location Type: Standard Location Landscaping: Natural Patio and Porch Features: Covered Deck Special Features: None Spa Features: Hauled # of Attached Spaces: 0 # of Detached Spaces: 2
-
2016-11-11historical
-
2016-11-11historical
-
2016-10-28price $116,999
-
2016-10-17$117,000 Active
-
2016-08-29$116,999
ⓘ Source: listings_history table (triggers on properties + properties_extension) + one-shot
backfill from property_details.listing_events for pre-trigger history.
Tax reassessment forecast CA · Resets to sale price
- Current annual tax
- $830 · $69/mo
- Projected year-2 tax
- $1,512 · $126/mo
- Expected delta
- +$683/yr (+$57/mo · 82.3%)
ⓘ Screening estimate from a state-policy table — verify with the county assessor before closing.
Climate risk First Street
- Flood 1/10 Low FEMA zone D · 0% chance over 30 yrs
- Wildfire 6/10 Major
- Heat 7/10 Severe 7 d/yr ≥99°F today · 20 d/yr by 30 yrs out
- Wind 1/10 Low
- Air quality 9/10 Extreme 21 unhealthy d/yr today · 26 by 30 yrs out
Nearby sold comps map
Loading sold comps map…
Walkable amenities ~0.75 mi
Loading nearby amenities…
Taxation est. · year 1
- Rental income
- $26,016
- − Mortgage interest
- −$11,147
- − Property taxes
- −$830
- − Insurance
- −$995
- − Repairs & maintenance
- −$2,081
- − Management
- −$2,081
- − Depreciation
- −$5,789
- Taxable income
- $3,093
- Est. tax owed @ 24.0%
- −$742
- After-tax cash flow
- $5,463/yr
For passive investors: Depreciation is non-cash, so a rental often shows a tax loss while cash-flowing — sheltering income. Rental losses are passive: they offset passive income freely, and up to $25,000/yr can offset ordinary (W-2) income if you actively participate and your MAGI is under $100k (phasing out to $0 by $150k); unused losses carry forward. On sale, claimed depreciation is recaptured at up to 25%, and gains may owe capital-gains tax (a 1031 exchange can defer both). Figures are a year-1 estimate at your 24.0% rate — not tax advice; consult a CPA.
Schools (NCES district)
- District
- Apple Valley Unified
- NCES district ID
- 0600017
- Math proficiency
- 25% ▬ 0.00%
- Reading proficiency
- 40% ▬ 0.00%
- Median HH income
- $49,264
- Composite
- 30.91/100
- National rank
- #11351
- State rank
- #955 of 1400 in CA
Livability — Apple Valley
- Score
- 61/100
- State rank
- #532
- US rank
- #17800
Category grades
Schools grade is shown separately in the Schools card above.
Census & demographics
- Census place
- Apple Valley, CA
- County
- San Bernardino County · 2,030,291 people
- City population
- 83,889
- Metro
- Riverside-San Bernardino-Ontario, CA
- Population (ZIP)
- 41,180
- Household income
- $77,106
- Rent vs Own
- Severe rent burden
- 1069.0
Population outlook (San Bernardino County) Hauer SSP2
- Today (2025)
- 2,300,329 people
- By 2030
- 2,378,907 · +3.4%
- By 2040
- 2,523,137 · +9.7%
- By 2050
- 2,642,388 · +14.9%
- By 2075
- 2,880,769 · +25.2%
- By 2100
- 2,909,436 · +26.5%
Race, ethnicity, and origin ACS 2023
- Neighborhood character
- Diverse neighborhood (Simpson 0.63)
- Race & ethnicity
- White 47% Hispanic / Latino 38% Two or more races 22% Black 5% Asian 3% Native American 2%
- Hispanic origin (detail)
- Mexican 34% Puerto Rican 1%
- Common ancestry
- Lithuanian 3% Italian 3% Slovak 2%
- Foreign-born
- 10% · Canada, China
- Languages at home
- 75% English-only · Spanish 20% Arabic 1% Other Indo-European 1%
Political lean MEDSL · San Bernardino
- 2024 margin
- Toss-up / Even · D 47.5% · R 49.7% · Other 2.8%
- 2008→2024 swing
- -8.5pp toward R · 2008: 6.3pp · 2024: -2.1pp
- All cycles
- 2024: R+2.1 2020: D+10.7 2016: D+9.8 2012: D+5.4 2008: D+6.3
Not yet ingested
- Civics
- —
Market trends
- HPI YoY
- ▼ -262.21%
- Current HPI
- 347.8498
- Rent YoY
- ▲ 5.48%
- Metro
- Riverside-San Bernardino-Ontario, CA
- State GDP YoY
- ▲ 3.21%
- F500 in state
- 116
Industry mix (Fortune 500 HQ in CA)
| Industry | F500 HQs | Revenue |
|---|---|---|
| Technology | 27 | $1,492B |
|
||
| Financial Services | 3 | $174B |
|
||
| Retail | 3 | $44B |
|
||
| Insurance | 3 | $26B |
|
||
| Media / Entertainment | 2 | $115B |
|
||
| Pharmaceuticals / Biotech | 2 | $62B |
|
||
Price history
+70.1% since first listed11 events — show timeline
- 2026-05-04 Price Changed $199,000 CRMLS
- 2026-02-14 Listed $219,000 CRMLS
- 2026-02-09 Coming Soon $219,000 CRMLS
- 2019-07-09 Sold (Public Records) $110,000 Public Records
- 2019-07-09 Sold (MLS) $110,000 CRMLS
- 2019-06-10 Listed $139,000 CRMLS
- 2016-11-11 Listing Removed — CRMLS
- 2016-11-11 Listing Removed — CRMLS
- 2016-10-28 Price Changed $116,999 CRMLS
- 2016-10-17 Listed $117,000 CRMLS
- 2016-08-29 Listed $116,999 CRMLS
Property tax history
+4.0%/yrLatest (2025): $830 · -31.8% YoY. Source: county tax records.
Cash-flow waterfall
monthlySold comps — $/sqft
last 12 mo · ≤1 miLoading sold comps…