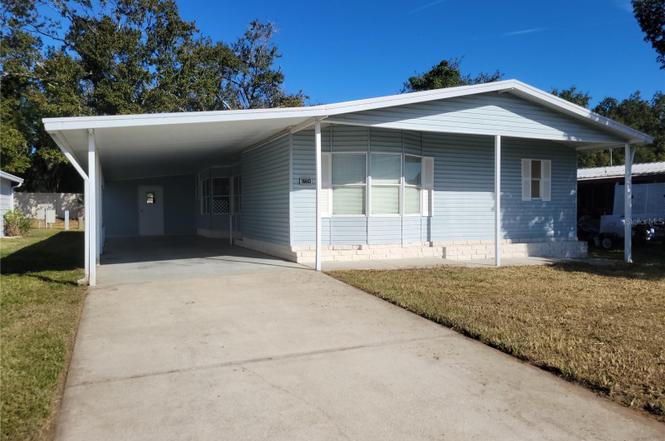
36603 Jodi Ave · Zephyrhills West, FL
Flood risk 1/10 · Minimal
- FEMA flood zone
- X (unshaded)
- Chance of flooding over 30 yrs
- 0.0%
- Est. flood insurance / yr
- $507 – $1,088
Fire risk 5/10 · Moderate
- Est. fire insurance / yr
- $947 – $1,759
Heat risk 9/10 · Severe
- Hot days now (above 108°F)
- 7 days/yr
- Hot days in 30 yrs
- 24 days/yr
Wind risk 9/10 · Severe
- Chance of severe wind over 30 yrs
- 99.0%
Air-quality risk 2/10 · Minimal
- Unhealthy air days now
- 1 days/yr
- Unhealthy air days in 30 yrs
- 2 days/yr
Risk factors via First Street. Map © Google.
Why this score? — see what drove the B- grade
The composite is a weighted blend of 9 inputs, each scored 0–100. Each bar is that input's sub-score; the figure is the points it added to the 100-point composite (weight × sub-score).
- Cash flow +24.6/30.0
- ARV discount +15.0/15.0
- DSCR +7.9/10.0
- 1% rule +6.9/10.0
- Schools +4.3/10.0
- Livability +3.1/5.0
- Condition / age +2.5/5.0
- Rent growth +1.6/5.0
- Appreciation +0.0/10.0
$170,000
🖨 Deal sheet 📄 Offer letter ✓ Due diligence
Listing remarks
BETMAR ESTATES (55+ Community) 3BR/2BA/HUGE CARPORT Home with PETS ALLOWED and LAND OWNED. This amazing community has so many optional activities! This home has a wonderful layout with a double-sided fireplace, large kitchen with breakfast nook, well-spaced living and family rooms, great natural light, and a two-way split plan of your primary bedroom and large bath (complete with siting tub) on one end and your two bedrooms and bathroom 2 on the other end. Enjoy a dedicated laundry area and a convenient exit door for the back yard too. Your carport can easily fit two linear vehicles along with a great driveway too. Storage is a breeze too, with a dedicated storage unit at the home too. Take
Key facts
- Breakfast nook
- Large kitchen
- Convenient exit door
Tags
Property features AI
Finance
- Other: Association contact: Jennifer Rogers
- Financial info: Lease restrictions apply
- HOA & community: Homeowner association with monthly fee of $37.33 (annual fee $448); Association amenities include pool, recreational facilities, clubhouse, basketball court; Association fee includes pool, escrow reserves fund, recreational facilities; Community features: Clubhouse, community mailbox, deed restrictions, dog park, golf, golf carts allowed, handicap modified, playground, pool, sidewalks, special community restrictions, tennis courts; Senior community; Pets allowed
Exterior
- Parking: Covered parking; Driveway; Parking pad; Tandem parking; Golf cart parking; 2-space carport
- Utilities: Public sewer; Water connected; Electricity connected; Cable available; Water source: None listed
- Home design: Manufactured double-wide home; One story; Faces south; Entry on one level
- Construction: Vinyl siding; Membrane roof; Crawlspace foundation; Built as a manufactured home
- Exterior features: Covered patio/porch; Side porch; Storage; Other exterior storage; Conservation area lot; Paved road access
Interior
- Kitchen: Dishwasher; Range
- Bedrooms: 3 bedrooms
- Flooring: Carpet; Vinyl
- Bathrooms: 2 full bathrooms
- Heating & cooling: Central heat; Central air conditioning
- Interior features: Ceiling fans; Eat-in kitchen; Wood-burning fireplace
- Laundry & utility: Inside laundry with washer and dryer
Neighborhood map
What this means for you Summary
Snapshot
- This is a 3-bed/2.0-bath manufactured listed at $170k.
Deal economics
- At list price, monthly cash flow is $352 ($4k/yr) — positive.
- The deal already cash-flows at list — no discount required.
- Meets the 1% rule at list price ($2k rent vs $170k).
- Recommended offer: $155k (9.0% below list) — sets the bar for market timing.
Location & tenants
- Location reads 61/100 on livability (#772 in FL) — a middle-class / working-renter tenant base. Strengths: cost of living A+, housing A+; Watch: schools D-, amenities F, commute F.
- Pasco (suburban): math 50% / reading 52% proficiency, ranked #32 of 73 in FL (top 44%) — acceptable for families but not a draw, mixed tenant base, ~2y average lease.
- Market conditions: Rents falling (-3.6%/yr); 294 active listings in the ZIP; 40 comparable units currently listed for rent nearby; rentals at typical pace (median 22d on market — plan ~3-4 weeks tenant-placement turnaround); 6,765 units permitted in Pasco County in 2024 (1,250 in 5+ unit buildings).
- At $2,026/mo this rent would consume 49% of the median local household income ($49k/yr) (locally 831% of renters already pay >50% of income on rent) — very limited rent-growth headroom before tenants either downsize or default.
Forward outlook
- Local home prices are declining (-3.0%/yr); year-one equity from $1k of loan paydown is wiped out by about $5k of value loss. Plan a longer hold.
- Pasco County population projected at +29% by 2050 — long-run rental-demand tailwind backs the buy-and-hold thesis.
Negotiation context
- It's been on market 97 days — a 9% lower offer ($155k) is reasonable based on typical stale-listing flexibility.
- 2 sale attempts; this cycle's ask has dropped $15k (8%) from the opening price — seller is motivated, your offer sets the floor, not the list.
Risks & watch-outs
- Climate carrying-cost: severe wind risk, 99% chance of damaging wind over 30y; moderate wildfire risk; extreme-heat days projected 7→24/yr by 2055 (HVAC capex compounding) — expect insurance premiums to compound above CPI over the hold.
Questions for the listing agent
- It's been on market 97 days. Have you received any prior offers? Is the seller open to a 9% concession, seller financing, or rate buy-down credit?
- What does the HOA fee cover, when was the last increase, and are there any pending special assessments or reserve-fund shortfalls?
- Why hasn't it sold? Are there any deal-killer items the seller is aware of (foundation, flood, title, zoning, code violations)?
- Is there a deadline driving the sale (1031 exchange, divorce, estate, relocation)? That informs how much negotiation room exists.
- Schools are D-rated, which usually means shorter tenancies and higher turnover. Who's the typical renter profile here, and what's been the actual vacancy rate?
- What's the average days-on-market for RENTAL listings here right now (not sales)? A rising rental-DOM trend means longer vacancies and softer asking-rent achievability than the comps imply.
- What's the recent tenant-quality profile in this submarket — average credit score on applications, eviction rate, late-payment / NSF rate, and stable-employment percentage? A property-management company in the area should have these aggregated.
- How much new for-sale + rental construction is in the pipeline within 1–3 miles? Heavy new supply typically softens prices + rents 12–24 months out; constrained supply supports both.
Investment metrics
- 1% rule
- 1.19% ✓
- Cap rate
- 8.78%
- Cash-on-cash
- 8.87%
- DSCR
- 1.39
- GRM
- 7.0
CMA / ARV
- ARV (on-the-fly)
- $221,364
- Comps found
- 12
Show comp detail 12 sales within ~0.75 mi
| Address | Dist | Beds/Ba | Sqft | Sold | Price | $/sf | Match |
|---|---|---|---|---|---|---|---|
| 36713 Jodi Ave | 0.12mi | 2/2.0 (-1) | 1,716 (+2%) | 2mo | $212,000 | $124 | 84 |
| 5602 Dakota St | 0.13mi | 2/2.0 (-1) | 1,576 (-6%) | 3mo | $215,250 | $137 | 76 |
| 36701 Jodi Ave | 0.09mi | 3/2.0 | 1,546 (-8%) | 10mo | $165,000 | $107 | 74 |
| 36846 Kimela Ave | 0.28mi | 2/2.0 (-1) | 1,632 (-3%) | 4mo | $209,900 | $129 | 74 |
| 5522 Mandan St | 0.20mi | 2/2.0 (-1) | 1,762 (+5%) | 4mo | $200,000 | $114 | 74 |
| 36743 Kiowa Ave | 0.20mi | 2/2.0 (-1) | 1,511 (-10%) | 1mo | $240,000 | $159 | 69 |
| 35970 Valleybrook Ave | 0.64mi | 3/2.0 | 1,680 (+0%) | 8mo | $300,000 | $179 | 64 |
| 36850 Lakewood Dr | 0.41mi | 2/2.0 (-1) | 1,539 (-8%) | 4mo | $245,000 | $159 | 58 |
| 36819 Kiowa Ave | 0.25mi | 2/2.0 (-1) | 1,480 (-12%) | 7mo | $195,000 | $132 | 58 |
| 36825 Kimela Ave | 0.24mi | 2/2.0 (-1) | 1,444 (-14%) | 6mo | $239,000 | $166 | 55 |
| 5646 Pawnee St | 0.37mi | 3/2.0 | 1,440 (-14%) | 5mo | $160,000 | $111 | 55 |
| 36624 Kay Ave | 0.48mi | 3/1.5 | 1,504 (-10%) | 8mo | $100,000 | $66 | 52 |
Match score weights: distance 35% · size 25% · config 20% · recency 20%. Top-matched comps best support the ARV.
Projected returns pro-forma
-3.0% appreciation · 0.0% rent growth · sell at horizon
- IRR
- -6.4%
- Equity multiple
- 0.77×
- Total profit
- $-10,994
- Equity at exit
- $25,348
- IRR
- -1.2%
- Equity multiple
- 0.93×
- Total profit
- $-3,350
- Equity at exit
- $14,698
Cash invested: $47,600 (down + closing). Projections, not guarantees.
Landlord ↔ Tenant lean methodology
- Overall (STATE)
- 87 Strongly Landlord-Friendly
- State Florida
- 87 Strongly Landlord-Friendly · R+3
- County
- — inherits STATE
- City
- — inherits STATE
ZIP-level market 33542
- Home prices YoY
- -20.6%
- Rents YoY
- -3.6%
- Active inventory
- 294
- Price-to-rent
- 7.0×
Monthly cashflow live
- Estimated rent
- $2,026 high interval (Pro) →
- Mortgage (P&I)
- −$891
- Tax from tax record
- −$250 /mo · $2,995/yr
- Insurance
- −$71
- HOA
- −$37
- Vacancy / Maint / Mgmt
- −$426
- Net cashflow
- $352
Break-even live
UW: 25.0% down · 7.5% · 30yr · 1.5% tax · 5.0% vac · 8.0% maint · 8.0% mgmt
Financing live
Cash to close
- Down payment
- $42,500
- Closing costs
- $5,100
- Reserves months
- —
- Total cash needed
- —
Loan-product check · same deal, 3 products live
Conventional
25% down · 7.5% · 30yr
- Down + closing
- —
- Monthly P&I
- —
- Monthly cashflow
- —
- DSCR
- —
- Eligible?
- —
Personal DTI + credit; lowest rate.
DSCR
20% down · 8.5% · 30yr
- Down + closing
- —
- Monthly P&I
- —
- Monthly cashflow
- —
- DSCR
- —
- Eligible?
- —
No personal income docs; deal must DSCR.
Hard money
10% down · 12.0% · 12mo
- Down + closing
- —
- Monthly P&I
- —
- Monthly cashflow
- —
- DSCR
- —
- Eligible?
- —
Short-term bridge; refi at stabilization.
Rent comps 40 comps
| Address | Beds | Baths | Sqft | Rent | $/sqft | DOM | Units | Dist |
|---|---|---|---|---|---|---|---|---|
| 36243 Lake Chase Blvd #203 Zephyrhills, FL | 3.0 | 2.0 | 1278 | $1,775 | $1.39 | 24d | 1 | 0.41mi |
| 36887 Highland Meadows Ct Zephyrhills, FL | 4.0 | 2.0 | 1828 | $2,250 | $1.23 | 24d | 1 | 0.42mi |
| 36106 Lake Chase Blvd #102 Zephyrhills, FL | 3.0 | 2.0 | 1170 | $1,650 | $1.41 | 4d | 1 | 0.54mi |
| 36106 Lake Chase Blvd Zephyrhills, FL | 3.0 | 2.0 | 1325 | $1,700 | $1.28 | 24d | 1 | 0.54mi |
| 36420 Garden Wall Way Zephyrhills, FL | 4.0 | 2.5 | 2050 | $2,450 | $1.20 | 24d | 1 | 0.56mi |
| 6213 Back Forty Loop Zephyrhills, FL | 4.0 | 2.5 | 1870 | $2,395 | $1.28 | 4d | 1 | 0.58mi |
| 36507 Camp Fire Ter Zephyrhills, FL | 3.0 | 2.0 | 1537 | $2,500 | $1.63 | 24d | 1 | 0.60mi |
| 36401 Camp Fire Ter Unit 36401 Zephyrhills, FL | 3.0 | 2.5 | 1634 | $1,895 | $1.16 | 20d | 1 | 0.63mi |
| 36406 Well Hill Way Zephyrhills, FL | 3.0 | 2.5 | 1634 | $2,000 | $1.22 | 17d | 1 | 0.65mi |
| 36015 Deer Creek Dr #202 Zephyrhills, FL | 2.0 | 2.0 | 1062 | $1,450 | $1.37 | 24d | 1 | 0.66mi |
| 36352 Well Hill Way Zephyrhills, FL | 3.0 | 2.5 | 1634 | $1,950 | $1.19 | 2d | 1 | 0.67mi |
| 36403 Well Hill Way Zephyrhills, FL | 3.0 | 2.5 | 1528 | $2,200 | $1.44 | 24d | 1 | 0.68mi |
| 5521 Barbara St Zephyrhills, FL | 2.0 | 2.0 | 1056 | $1,800 | $1.70 | 24d | 1 | 0.71mi |
| 6302 Abbott Station Dr Zephyrhills, FL | 3.0 | 1.0–2.5 | 855 | $1,999 | $2.34 | 1d | 142 | 0.87mi |
| 36095 Carriage Pine Ct Zephyrhills, FL | 3.0 | 2.0 | 1461 | $1,990 | $1.36 | 24d | 1 | 0.87mi |
| 35940 Inspiration Dr Zephyrhills, FL | 1.0–3.0 | 1.0–2.0 | 1034 | $1,988 | $1.92 | 2d | 21 | 0.89mi |
| 36618 Goffaux Loop Zephyrhills, FL | 4.0 | 2.0 | 1846 | $2,115 | $1.15 | 17d | 1 | 0.94mi |
| 5686 Barakat Rd Zephyrhills, FL | 4.0 | 2.0 | 1867 | $2,250 | $1.21 | 14d | 1 | 1.00mi |
| 5686 Barakat Rd Zephyrhills, FL | 4.0 | 2.0 | 1828 | $2,300 | $1.26 | 24d | 1 | 1.00mi |
| 6766 Shelby Lynn Way Unit 1A Zephyrhills, FL | 4.0 | 3.0 | 2124 | $2,800 | $1.32 | 12d | 1 | 1.01mi |
| 6633 Foxmoor Dr Zephyrhills, FL | 3.0 | 2.0 | 1300 | $2,000 | $1.54 | 24d | 1 | 1.06mi |
| 6773 Branham Mill Ct Zephyrhills, FL | 3.0 | 2.0 | 1454 | $1,950 | $1.34 | 24d | 1 | 1.06mi |
| 6249 Maisai Rd #6 Zephyrhills, FL | 3.0 | 2.5 | 1561 | $1,550 | $0.99 | 2d | 1 | 1.08mi |
| 6722 Northlake Dr Zephyrhills, FL | 3.0 | 2.0 | 2215 | $2,450 | $1.11 | 24d | 1 | 1.09mi |
| 6262 Maisie Rd Zephyrhills, FL | 3.0 | 2.5 | 1363 | $1,700 | $1.25 | 24d | 1 | 1.12mi |
| 6335 Maisie Rd Zephyrhills, FL | 3.0 | 2.5 | 1363 | $1,650 | $1.21 | 20d | 1 | 1.12mi |
| 7064 Ripple Pond Loop Zephyrhills, FL | 3.0 | 2.5 | 1787 | $2,047 | $1.15 | 14d | 1 | 1.13mi |
| 6246 Timberly Ln Zephyrhills, FL | 3.0 | 2.5 | 1363 | $1,900 | $1.39 | 24d | 1 | 1.18mi |
| 37661 Aaralyn Rd Zephyrhills, FL | 3.0 | 2.5 | 1363 | $1,800 | $1.32 | 24d | 1 | 1.20mi |
| 37357 Sharks Eye Ln Zephyrhills, FL | 3.0 | 2.5 | 1961 | $2,600 | $1.33 | 24d | 1 | 1.25mi |
| 37373 Sharks Eye Ln Zephyrhills, FL | 3.0 | 2.0 | 1560 | $2,200 | $1.41 | 10d | 1 | 1.26mi |
| 35542 Sparrow Nest Way Zephyrhills, FL | 4.0 | 2.0 | 2000 | $2,400 | $1.20 | 24d | 1 | 1.28mi |
| 33529 Buttonweed Trl Zephyrhills, FL | 3.0 | 2.0 | 1412 | $2,500 | $1.77 | 24d | 1 | 1.29mi |
| 37472 Sharks Eye Ln Zephyrhills, FL | 3.0 | 2.0 | 1560 | $2,100 | $1.35 | 1d | 1 | 1.34mi |
| 37643 Leafside Ln Zephyrhills, FL | 2.0 | 2.5 | 1541 | $1,840 | $1.19 | 21d | 1 | 1.36mi |
| 4850 Foliage Rd Zephyrhills, FL | 2.0 | 2.5 | 1541 | $1,780 | $1.16 | 21d | 1 | 1.39mi |
| 37714 Leafside Ln Zephyrhills, FL | 2.0 | 2.5 | 1541 | $1,855 | $1.20 | 14d | 1 | 1.42mi |
| 37711 Leafside Ln Zephyrhills, FL | 2.0 | 2.5 | 1541 | $1,765 | $1.15 | 14d | 1 | 1.42mi |
| 37726 Leafside Ln Zephyrhills, FL | 3.0 | 2.5 | 1634 | $1,985 | $1.21 | 21d | 1 | 1.43mi |
| 6195 Daerr Ridge St Zephyrhills, FL | 3.0 | 2.5 | 1386 | $2,000 | $1.44 | 17d | 1 | 1.49mi |
HOA detail
- Monthly dues
- $37 · $444/yr
Listing history 20 events
-
2026-06-18days on market $170,000 Active 97 DOM
-
2026-06-17days on market $170,000 Active 96 DOM
-
2026-06-16days on market $170,000 Active 95 DOM
-
2026-06-15days on market $170,000 Active 94 DOM
-
2026-06-13pricedays on market $170,000 Active 92 DOM
-
2026-06-09days on market $175,000 Active 88 DOM
-
2026-06-08days on market $175,000 Active 87 DOM
-
2026-06-07days on market $175,000 Active 86 DOM
-
2026-06-04days on market $175,000 Active 83 DOM
-
2026-06-03days on market $175,000 Active 82 DOM
-
2026-06-02days on market $175,000 Active 81 DOM
-
2026-06-01days on market $175,000 Active 80 DOM
-
2026-05-31days on market $175,000 Active 79 DOM
-
2026-05-12price $175,000
-
2026-04-23price $180,000
-
2026-03-13$185,000 Active
-
2026-02-08historical
-
2025-12-12price $200,000
-
2025-11-19price $206,500
-
2025-09-19$211,500 Active
ⓘ Source: listings_history table (triggers on properties + properties_extension) + one-shot
backfill from property_details.listing_events for pre-trigger history.
Tax reassessment forecast FL · Resets to sale price
- Current annual tax
- $2,995 · $250/mo
- Projected year-2 tax
- $2,995 · $250/mo
- Expected delta
- $0/yr ($0/mo · -0.0%)
ⓘ Screening estimate from a state-policy table — verify with the county assessor before closing.
Climate risk First Street
- Flood 1/10 Low FEMA zone X (unshaded) · 0% chance over 30 yrs
- Wildfire 5/10 Major
- Heat 9/10 Extreme 7 d/yr ≥108°F today · 24 d/yr by 30 yrs out
- Wind 9/10 Extreme 99% chance of damaging wind over 30 yrs
- Air quality 2/10 Low 1 unhealthy d/yr today · 2 by 30 yrs out
Nearby sold comps map
Loading sold comps map…
Walkable amenities ~0.75 mi
Loading nearby amenities…
Taxation est. · year 1
- Rental income
- $24,316
- − Mortgage interest
- −$9,523
- − Property taxes
- −$2,995
- − Insurance
- −$850
- − Repairs & maintenance
- −$1,945
- − Management
- −$1,945
- − HOA
- −$444
- − Depreciation
- −$4,945
- Taxable income
- $1,669
- Est. tax owed @ 24.0%
- −$401
- After-tax cash flow
- $3,823/yr
For passive investors: Depreciation is non-cash, so a rental often shows a tax loss while cash-flowing — sheltering income. Rental losses are passive: they offset passive income freely, and up to $25,000/yr can offset ordinary (W-2) income if you actively participate and your MAGI is under $100k (phasing out to $0 by $150k); unused losses carry forward. On sale, claimed depreciation is recaptured at up to 25%, and gains may owe capital-gains tax (a 1031 exchange can defer both). Figures are a year-1 estimate at your 24.0% rate — not tax advice; consult a CPA.
Schools (NCES district)
- District
- Pasco
- NCES district ID
- 1201530
- Math proficiency
- 50% ▼ -10.00%
- Reading proficiency
- 52% ▼ -5.00%
- Median HH income
- $45,039
- Composite
- 43.14/100
- National rank
- #3074
- State rank
- #32 of 73 in FL
Livability — Zephyrhills West
- Score
- 61/100
- State rank
- #772
- US rank
- #17403
Category grades
Schools grade is shown separately in the Schools card above.
Census & demographics
- Census place
- Zephyrhills West, FL
- County
- Pasco County · 524,098 people
- Metro
- Tampa-St. Petersburg-Clearwater, FL
- Population (ZIP)
- 23,612
- Household income
- $49,316
- Rent vs Own
- Severe rent burden
- 831.0
Population outlook (Pasco County) Hauer SSP2
- Today (2025)
- 570,045 people
- By 2030
- 605,844 · +6.3%
- By 2040
- 674,806 · +18.4%
- By 2050
- 736,022 · +29.1%
- By 2075
- 862,900 · +51.4%
- By 2100
- 906,364 · +59.0%
Race, ethnicity, and origin ACS 2023
- Neighborhood character
- Predominantly White (76%)
- Race & ethnicity
- White 76% Hispanic / Latino 17% Two or more races 8% Black 4% Asian 1%
- Hispanic origin (detail)
- Mexican 2% Puerto Rican 10%
- Common ancestry
- Lithuanian 3% Romanian 2% Iranian 2%
- Foreign-born
- 5% · Canada, Jamaica
- Languages at home
- 86% English-only · Spanish 12% Other Indo-European 1% Russian/Polish/Slavic 1%
Political lean MEDSL · Pasco
- 2024 margin
- Strong R (+25.2) · D 36.9% · R 62.1% · Other 1.0%
- 2008→2024 swing
- -21.6pp toward R · 2008: -3.6pp · 2024: -25.2pp
- All cycles
- 2024: R+25.2 2020: R+20.1 2016: R+21.6 2012: R+6.7 2008: R+3.6
Not yet ingested
- Civics
- —
Market trends
- HPI YoY
- ▼ -81.25%
- Current HPI
- 313.3993
- Rent YoY
- ▼ -3.56%
- Metro
- Tampa-St. Petersburg-Clearwater, FL
- State GDP YoY
- ▲ 3.28%
- F500 in state
- 36
Industry mix (Fortune 500 HQ in FL)
| Industry | F500 HQs | Revenue |
|---|---|---|
| Industrial Technology | 2 | $29B |
|
||
| Insurance | 2 | $17B |
|
||
| Retail | 1 | $60B |
|
||
| Technology Distribution | 1 | $58B |
|
||
| Homebuilding | 1 | $35B |
|
||
| Technology Manufacturing | 1 | $35B |
|
||
Price history
-17.3% since first listed7 events — show timeline
- 2026-05-12 Price Changed $175,000 Stellar MLS as Distributed by MLS Grid
- 2026-04-23 Price Changed $180,000 Stellar MLS as Distributed by MLS Grid
- 2026-03-13 Listed $185,000 Stellar MLS as Distributed by MLS Grid
- 2026-02-08 Listing Removed — Stellar MLS as Distributed by MLS Grid
- 2025-12-12 Price Changed $200,000 Stellar MLS as Distributed by MLS Grid
- 2025-11-19 Price Changed $206,500 Stellar MLS as Distributed by MLS Grid
- 2025-09-19 Listed $211,500 Stellar MLS as Distributed by MLS Grid
Property tax history
+5.5%/yrLatest (2025): $2,995 · +5.1% YoY. Source: county tax records.
Cash-flow waterfall
monthlySold comps — $/sqft
last 12 mo · ≤1 miLoading sold comps…