 🏗️ New Construction
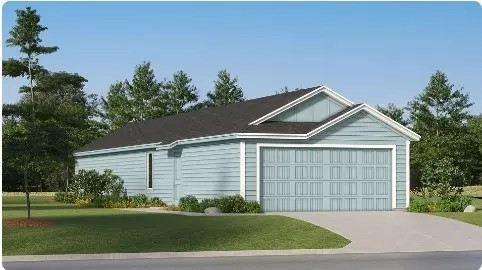
365 Lucia Way · Plum Grove, TX
Flood risk No data
- FEMA flood zone
- —
- Chance of flooding over 30 yrs
- —
- Est. flood insurance / yr
- —
Fire risk No data
- Est. fire insurance / yr
- —
Heat risk No data
- Hot days now (above threshold)
- —
- Hot days in 30 yrs
- —
Wind risk No data
- Chance of severe wind over 30 yrs
- —
Air-quality risk No data
- Unhealthy air days now
- —
- Unhealthy air days in 30 yrs
- —
Risk factors via First Street. Map © Google.
Why this score? — see what drove the D+ grade
The composite is a weighted blend of 9 inputs, each scored 0–100. Each bar is that input's sub-score; the figure is the points it added to the 100-point composite (weight × sub-score).
- Cash flow +18.0/30.0
- ARV discount +7.5/15.0
- DSCR +5.6/10.0
- 1% rule +4.9/10.0
- Condition / age +4.0/5.0
- Rent growth +3.5/5.0
- Livability +2.9/5.0
- Schools +2.1/10.0
- Appreciation +0.0/10.0
$152,690
🖨 Deal sheet 📄 Offer letter ✓ Due diligence
Listing remarks
NEW in the Santa Fe Village Community! Lennar Crestmore Collection "Whiles" Plan with Elevation "D". This new single-level home boasts a modern, low-maintenance layout. An inviting open-concept layout can be found off the entry, combining the kitchen, living and dining areas to simplify everyday multitasking. Three bedrooms are tucked away at the back of the home, including the luxurious owner’s suite with a generous walk-in closet and en-suite bathroom.
Key facts
- Walk-in closet
- En-suite bathroom
- Open-concept layout
Tags
Property features AI
Finance
- HOA & community: Homeowners association (Houston El Norte Prop Assoc.) with an annual fee of $120
Exterior
- Parking: Attached garage with 2 spaces
- Utilities: Has heating and cooling
- Home design: Residential property; Under construction (new construction); Single-story (all main rooms listed on first floor); Slab foundation
- Construction: Cement siding; Composition roof; Built in 2026
- Exterior features: Subdivision lot setting
Interior
- Kitchen: Kitchen island; Breakfast bar; Pantry; Open to family and dining areas
- Bedrooms: Three bedrooms (all on the first floor): two 10x10 bedrooms; primary bedroom 14x11
- Bathrooms: Two full bathrooms
- Heating & cooling: Central gas heating; Central electric air conditioning
- Interior features: Breakfast bar; Kitchen island; Kitchen/Family room combo; Pantry; Tub with shower; Walk-in pantry; Kitchen/Dining combo
Neighborhood map
What this means for you Summary
Snapshot
- This is a 3-bed/2.0-bath single-family listed at $153k. Condition is rated good.
Deal economics
- At list price, monthly cash flow is $143 ($2k/yr) — positive.
- The deal already cash-flows at list — no discount required.
- Meets the 1% rule at list price ($2k rent vs $153k).
- Recommended offer: $148k (3.0% below list) — sets the bar for market timing.
- Cap rate 7.3% vs local median 5.0% in Plum Grove — top-decile yield for the area; either an underpriced asset or a hidden risk that comps aren't pricing in. Stress-test before assuming the spread holds.
Location & tenants
- Location reads 58/100 on livability (#1,206 in TX) — a working-class tenant base; expect higher turnover. Strengths: crime A+, cost of living A+, housing A+; Watch: amenities F, commute F, health & safety F.
- Cleveland ISD (town): math 24% / reading 25% proficiency, ranked #723 of 826 in TX (top 88%) — low school quality limits family demand, transient renter base, plan for 1-2y turnover; 71% free/reduced lunch — lower-income household profile, screen leases tightly.
- Zoned schools: Pine Burr El (691 students, 97% FRL); Santa Fe Middle (915 students, 99% FRL); Cleveland H S (math 30% / reading 32%, grade F, #1,077 of 1,632 statewide, top 66%, 3,310 students, 92% FRL) — zoned schools average 96% FRL vs 71% district-wide (25 pts higher); higher-poverty schools than district average — tighter screening recommended.
- Market conditions: Rents rising fast (+4.0%/yr); 1574 active listings in the ZIP; 2 comparable units currently listed for rent nearby; 1,321 units permitted in Liberty County in 2024 (0 in 5+ unit buildings).
- This rent runs 32% of the median local income ($62k/yr) — at the standard rent-burdened threshold; future hikes will face affordability resistance.
Forward outlook
- Local home prices are declining (-3.0%/yr); year-one equity from $1k of loan paydown is wiped out by about $5k of value loss. Plan a longer hold.
- Liberty County population projected at +24% by 2050 — long-run rental-demand tailwind backs the buy-and-hold thesis.
Negotiation context
- It's been on market 55 days — a 3% lower offer ($148k) is reasonable based on typical stale-listing flexibility.
Questions for the listing agent
- It's been on market 55 days. Have you received any prior offers? Is the seller open to a 3% concession, seller financing, or rate buy-down credit?
- What does the HOA fee cover, when was the last increase, and are there any pending special assessments or reserve-fund shortfalls?
- Is there a deadline driving the sale (1031 exchange, divorce, estate, relocation)? That informs how much negotiation room exists.
- Schools are F-rated, which usually means shorter tenancies and higher turnover. Who's the typical renter profile here, and what's been the actual vacancy rate?
- The area grade is low — what's the realistic commute time and amenity access for the typical tenant pool here? Any planned neighborhood developments (good or bad) we should know about?
- What's the average days-on-market for RENTAL listings here right now (not sales)? A rising rental-DOM trend means longer vacancies and softer asking-rent achievability than the comps imply.
- What's the recent tenant-quality profile in this submarket — average credit score on applications, eviction rate, late-payment / NSF rate, and stable-employment percentage? A property-management company in the area should have these aggregated.
- How much new for-sale + rental construction is in the pipeline within 1–3 miles? Heavy new supply typically softens prices + rents 12–24 months out; constrained supply supports both.
Investment metrics
- 1% rule
- 0.99% ✗
- Cap rate
- 7.33%
- Cash-on-cash
- 3.69%
- DSCR
- 1.16
- GRM
- 8.4
CMA / ARV
- ARV (median comp)
- $166,182
- List price
- $152,690
- Delta
- -8.12%
- Verdict
- FAIR
- Comps
- 20 within 1.0 mi
Show comp detail 6 sales within ~0.75 mi
| Address | Dist | Beds/Ba | Sqft | Sold | Price | $/sf | Match |
|---|---|---|---|---|---|---|---|
| 378 Lucia Way | 0.00mi | 3/2.0 | 1,208 (0%) | 1mo | $174,990 | $145 | 99 |
| 381 Lucia Way | 0.00mi | 3/2.0 | 1,208 (0%) | 1mo | $172,990 | $143 | 99 |
| 385 Lucia Way | 0.00mi | 3/2.0 | 1,049 (-13%) | 1mo | $170,991 | $163 | 77 |
| 382 Lucia Way | 0.01mi | 3/2.0 | 1,033 (-14%) | 0mo | $156,990 | $152 | 75 |
| 1023 Road 5606 | 0.74mi | 3/2.0 | 1,200 (-1%) | 1mo | $199,000 | $166 | 64 |
| 338 Road 5840 Rd | 0.61mi | 3/2.0 | 1,350 (+12%) | 1mo | $172,000 | $127 | 52 |
Match score weights: distance 35% · size 25% · config 20% · recency 20%. Top-matched comps best support the ARV.
Projected returns pro-forma
-3.0% appreciation · 4.0% rent growth · sell at horizon
- IRR
- -9.4%
- Equity multiple
- 0.65×
- Total profit
- $-16,115
- Equity at exit
- $24,778
- IRR
- 1.4%
- Equity multiple
- 1.10×
- Total profit
- $4,832
- Equity at exit
- $14,368
Cash invested: $46,531 (down + closing). Projections, not guarantees.
Landlord ↔ Tenant lean methodology
- Overall (STATE)
- 87 Strongly Landlord-Friendly
- State Texas
- 87 Strongly Landlord-Friendly · R+5
- County
- — inherits STATE
- City
- — inherits STATE
ZIP-level market 77327
- Home prices YoY
- -5.2%
- Rents YoY
- 4.0%
- Active inventory
- 1574
- Price-to-rent
- 7.7×
Monthly cashflow live
- Estimated rent
- $1,647 medium interval (Pro) →
- Mortgage (P&I)
- −$871
- Tax est. 1.5%
- −$208 /mo · $2,493/yr
- Insurance
- −$69
- HOA
- −$10
- Vacancy / Maint / Mgmt
- −$346
- Net cashflow
- $143
Break-even live
UW: 25.0% down · 7.5% · 30yr · 1.5% tax · 5.0% vac · 8.0% maint · 8.0% mgmt
Financing live
Cash to close
- Down payment
- $41,545
- Closing costs
- $4,985
- Reserves months
- —
- Total cash needed
- —
Loan-product check · same deal, 3 products live
Conventional
25% down · 7.5% · 30yr
- Down + closing
- —
- Monthly P&I
- —
- Monthly cashflow
- —
- DSCR
- —
- Eligible?
- —
Personal DTI + credit; lowest rate.
DSCR
20% down · 8.5% · 30yr
- Down + closing
- —
- Monthly P&I
- —
- Monthly cashflow
- —
- DSCR
- —
- Eligible?
- —
No personal income docs; deal must DSCR.
Hard money
10% down · 12.0% · 12mo
- Down + closing
- —
- Monthly P&I
- —
- Monthly cashflow
- —
- DSCR
- —
- Eligible?
- —
Short-term bridge; refi at stabilization.
Rent comps 2 comps
| Address | Beds | Baths | Sqft | Rent | $/sqft | DOM | Units | Dist |
|---|---|---|---|---|---|---|---|---|
| 1192 Road 57071 Cleveland, TX | 2.0 | 2.0 | 1000 | $950 | $0.95 | 1d | 1 | 0.63mi |
| 203 Road 5248 Cleveland, TX | 3.0 | 2.0 | 910 | $1,680 | $1.85 | 15d | 1 | 0.98mi |
HOA detail
- Monthly dues
- $10 · $120/yr
Listing history 22 events
-
2026-06-18days on market $152,690 Active 55 DOM
-
2026-06-17days on market $152,690 Active 54 DOM
-
2026-06-16days on market $152,690 Active 53 DOM
-
2026-06-15days on market $152,690 Active 52 DOM
-
2026-06-13days on market $152,690 Active 50 DOM
-
2026-06-09days on market $152,690 Active 46 DOM
-
2026-06-08days on market $152,690 Active 45 DOM
-
2026-06-07days on market $152,690 Active 44 DOM
-
2026-06-04days on market $152,690 Active 41 DOM
-
2026-06-03days on market $152,690 Active 40 DOM
-
2026-06-02days on market $152,690 Active 39 DOM
-
2026-06-01days on market $152,690 Active 38 DOM
-
2026-05-31days on market $152,690 Active 37 DOM
-
2026-05-15price $152,690 357-char remark
-
2026-05-14price $152,690 485-char remark
-
2026-05-01price $160,140 357-char remark
-
2026-04-30price $160,140 485-char remark
-
2026-04-28price $155,340 357-char remark
-
2026-04-27price $148,990 357-char remark
-
2026-04-27price $155,340 485-char remark
-
2026-04-23$174,990 Active 357-char remark
-
2026-04-23$174,990 Active 485-char remark
ⓘ Source: listings_history table (triggers on properties + properties_extension) + one-shot
backfill from property_details.listing_events for pre-trigger history.
Nearby sold comps map
Loading sold comps map…
Walkable amenities ~0.75 mi
Loading nearby amenities…
Taxation est. · year 1
- Rental income
- $19,769
- − Mortgage interest
- −$9,309
- − Property taxes
- −$2,493
- − Insurance
- −$831
- − Repairs & maintenance
- −$1,582
- − Management
- −$1,582
- − HOA
- −$120
- − Depreciation
- −$4,834
- Taxable loss
- −$981
- Est. tax savings @ 24.0%
- +$235
- After-tax cash flow
- $1,952/yr
For passive investors: Depreciation is non-cash, so a rental often shows a tax loss while cash-flowing — sheltering income. Rental losses are passive: they offset passive income freely, and up to $25,000/yr can offset ordinary (W-2) income if you actively participate and your MAGI is under $100k (phasing out to $0 by $150k); unused losses carry forward. On sale, claimed depreciation is recaptured at up to 25%, and gains may owe capital-gains tax (a 1031 exchange can defer both). Figures are a year-1 estimate at your 24.0% rate — not tax advice; consult a CPA.
Condition & rehab AI · 10 photos
This single-family home in the Santa Fe Village Community is in excellent condition with a modern, low-maintenance layout. It is move-in ready and would benefit from exterior painting and landscaping improvements to further enhance its value.
Value-add opportunities
- Both Painting exterior siding — Enhances curb appeal and can increase both resale and rental value.
- Both Landscaping improvements — Enhances curb appeal and can increase both resale and rental value.
Renovation cost estimate screening
Value-add ROI direction
- Both Painting exterior siding — Enhances curb appeal and can increase both resale and rental value. ↑
- Both Landscaping improvements — Enhances curb appeal and can increase both resale and rental value. ↑
ⓘ Cost ranges are severity-bucket heuristics (US national rule-of-thumb). Get contractor quotes + a written scope before underwriting a rehab budget.
Schools (NCES district)
- District
- Cleveland ISD
- NCES district ID
- 4814370
- Math proficiency
- 24% ▼ -13.00%
- Reading proficiency
- 25% ▼ -4.00%
- Median HH income
- $39,173
- Composite
- 20.61/100
- National rank
- #8549
- State rank
- #723 of 826 in TX
Livability — Plum Grove
- Score
- 58/100
- State rank
- #1206
- US rank
- #21049
Category grades
Schools grade is shown separately in the Schools card above.
Census & demographics
- County
- Liberty County · 82,189 people
- Metro
- Houston-The Woodlands-Sugar Land, TX
- Population (ZIP)
- 42,685
- Household income
- $62,219
- Rent vs Own
- Severe rent burden
- 437.0
Population outlook (Liberty County) Hauer SSP2
- Today (2025)
- 87,956 people
- By 2030
- 92,161 · +4.8%
- By 2040
- 100,784 · +14.6%
- By 2050
- 109,471 · +24.5%
- By 2075
- 133,470 · +51.7%
- By 2100
- 147,372 · +67.6%
Race, ethnicity, and origin ACS 2023
- Neighborhood character
- Diverse neighborhood (Simpson 0.57)
- Race & ethnicity
- Hispanic / Latino 54% White 36% Two or more races 18% Black 8% Native American 2%
- Hispanic origin (detail)
- Mexican 42%
- Common ancestry
- Lithuanian 2% Serbian 1% Slovak 0%
- Foreign-born
- 22% · Canada
- Languages at home
- 51% English-only · Spanish 48%
Political lean MEDSL · Liberty
- 2024 margin
- Solid R (+61.6) · D 19.0% · R 80.6%
- 2008→2024 swing
- -17.9pp toward R · 2008: -43.7pp · 2024: -61.6pp
- All cycles
- 2024: R+61.6 2020: R+59.7 2016: R+58.0 2012: R+53.3 2008: R+43.7
Not yet ingested
- Civics
- —
Market trends
- HPI YoY
- ▼ -12.39%
- Current HPI
- 224.9222
- Rent YoY
- ▲ 4.00%
- Metro
- Houston-The Woodlands-Sugar Land, TX
- State GDP YoY
- ▲ 3.95%
- F500 in state
- 110
Industry mix (Fortune 500 HQ in TX)
| Industry | F500 HQs | Revenue |
|---|---|---|
| Energy | 16 | $1,198B |
|
||
| Technology | 5 | $198B |
|
||
| Engineering / Construction | 4 | $72B |
|
||
| Energy Services | 3 | $60B |
|
||
| Utilities | 3 | $41B |
|
||
| Healthcare | 2 | $330B |
|
||
Price history
-12.7% since first listed4 events — show timeline
- 2026-05-14 Price Changed $152,690 HARMLS
- 2026-04-30 Price Changed $160,140 HARMLS
- 2026-04-27 Price Changed $155,340 HARMLS
- 2026-04-23 Listed $174,990 HARMLS
Cash-flow waterfall
monthlySold comps — $/sqft
last 12 mo · ≤1 miLoading sold comps…