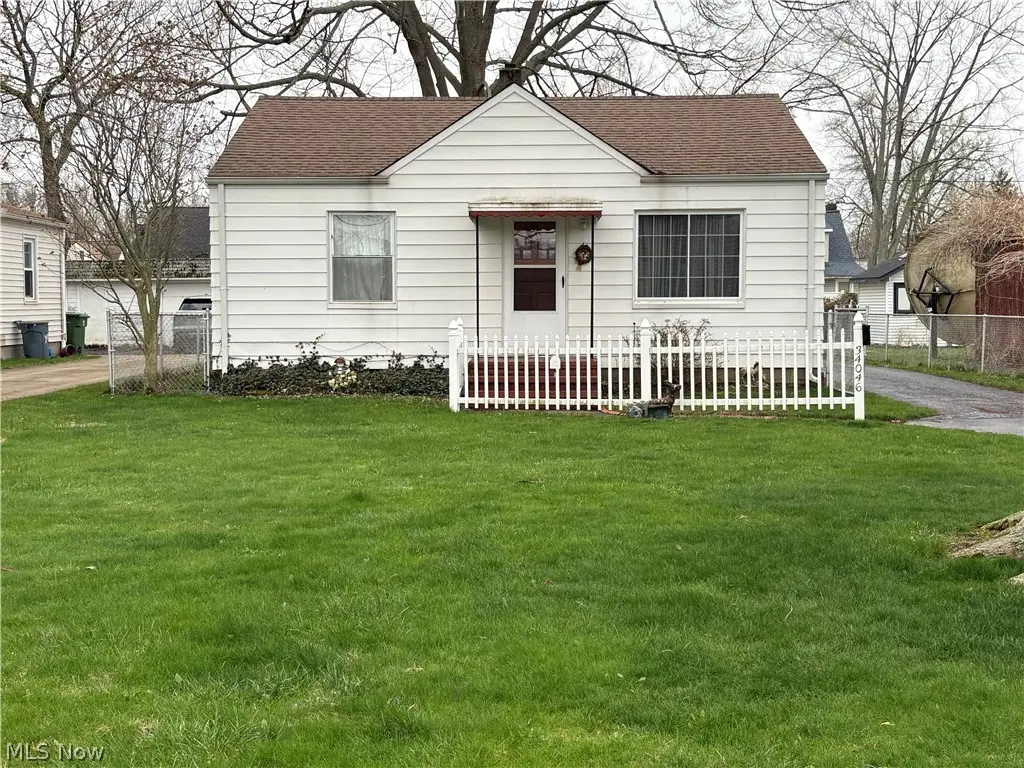
34046 Sylvia Dr · Eastlake, OH
Flood risk 1/10 · Minimal
- FEMA flood zone
- X (unshaded)
- Chance of flooding over 30 yrs
- 0.0%
- Est. flood insurance / yr
- $507 – $1,088
Fire risk 1/10 · Minimal
- Est. fire insurance / yr
- $713 – $1,323
Heat risk 3/10 · Minor
- Hot days now (above 93°F)
- 7 days/yr
- Hot days in 30 yrs
- 18 days/yr
Wind risk 1/10 · Minimal
- Chance of severe wind over 30 yrs
- —
Air-quality risk 4/10 · Minor
- Unhealthy air days now
- 6 days/yr
- Unhealthy air days in 30 yrs
- 6 days/yr
Risk factors via First Street. Map © Google.
Why this score? — see what drove the C+ grade
The composite is a weighted blend of 9 inputs, each scored 0–100. Each bar is that input's sub-score; the figure is the points it added to the 100-point composite (weight × sub-score).
- Cash flow +22.8/30.0
- ARV discount +14.2/15.0
- DSCR +7.3/10.0
- 1% rule +5.4/10.0
- Schools +4.3/10.0
- Rent growth +3.7/5.0
- Livability +3.4/5.0
- Condition / age +2.5/5.0
- Appreciation +0.0/10.0
$169,900
🖨 Deal sheet 📄 Offer letter ✓ Due diligence
Listing remarks
charming three-bedroom, two full bath ranch in Eastlake offering a warm and welcoming setting. This home shows consistent care and features a comfortable, functional layout designed for easy one-floor living. The spacious backyard provides plenty of room to relax, entertain, or enjoy outdoor activities. Includes a one-car garage. A truly inviting place to make your own and feel right at home.
Key facts
- One car garage
- Spacious backyard
- Two full bath
Tags
Neighborhood map
What this means for you Summary
Snapshot
- This is a 3-bed/2.0-bath single-family listed at $170k.
Deal economics
- At list price, monthly cash flow is $296 ($4k/yr) — positive.
- The deal already cash-flows at list — no discount required.
- Meets the 1% rule at list price ($2k rent vs $170k).
- Cap rate 8.4% vs local median 4.8% in Eastlake — top-decile yield for the area; either an underpriced asset or a hidden risk that comps aren't pricing in. Stress-test before assuming the spread holds.
Location & tenants
- Location reads 68/100 on livability (#550 in OH) — a middle-class / working-renter tenant base. Strengths: cost of living A+, housing A+, health & safety A-; Watch: employment D+, amenities F, commute F.
- Willoughby-Eastlake City (suburban): math 42% / reading 58% proficiency, ranked #434 of 656 in OH (top 66%) — acceptable for families but not a draw, mixed tenant base, ~2y average lease.
- Market conditions: Rents rising fast (+4.8%/yr); 129 active listings in the ZIP; 1 comparable units currently listed for rent nearby; 448 units permitted in Lake County in 2024 (0 in 5+ unit buildings).
Forward outlook
- Local home prices are declining (-3.0%/yr); year-one equity from $1k of loan paydown is wiped out by about $5k of value loss. Plan a longer hold.
- Lake County population projected to shrink 8% by 2050 — rents likely to lag national; underwrite the cash flow, not the appreciation.
Negotiation context
- Only 13 days on market — expect competitive offers; lowballing is unlikely to land.
- 2 sale attempts with the ask held roughly flat each time — persistent listings suggest the price (not the market) is what's stuck; bring a comps-based counter.
Risks & watch-outs
- Watch-outs: built in 1953 — expect roof / HVAC / electrical / plumbing capex.
Questions for the listing agent
- Built in 1953 — when were the roof, HVAC, electrical panel, plumbing, and water heater last replaced?
- Is there a deadline driving the sale (1031 exchange, divorce, estate, relocation)? That informs how much negotiation room exists.
- Schools are B-rated — typically a magnet for longer-tenancy family renters. What's the average tenant stay here, and is there a school-zone premium baked into asking?
- What's the average days-on-market for RENTAL listings here right now (not sales)? A rising rental-DOM trend means longer vacancies and softer asking-rent achievability than the comps imply.
- What's the recent tenant-quality profile in this submarket — average credit score on applications, eviction rate, late-payment / NSF rate, and stable-employment percentage? A property-management company in the area should have these aggregated.
- How much new for-sale + rental construction is in the pipeline within 1–3 miles? Heavy new supply typically softens prices + rents 12–24 months out; constrained supply supports both.
Investment metrics
- 1% rule
- 1.04% ✓
- Cap rate
- 8.38%
- Cash-on-cash
- 7.47%
- DSCR
- 1.33
- GRM
- 8.0
CMA / ARV
- ARV (on-the-fly)
- $199,640
- Comps found
- 12
Show comp detail 12 sales within ~0.75 mi
| Address | Dist | Beds/Ba | Sqft | Sold | Price | $/sf | Match |
|---|---|---|---|---|---|---|---|
| 34046 Sylvia Dr | 0.00mi | 3/2.0 | 1,240 (0%) | 1mo | $169,900 | $137 | 99 |
| 760 E 344th St | 0.33mi | 3/2.0 | 1,281 (+3%) | 8mo | $231,200 | $180 | 73 |
| 33973 Willowick Dr | 0.08mi | 4/1.0 (+1) | 1,152 (-7%) | 6mo | $137,000 | $119 | 70 |
| 34622 Iris Ln | 0.53mi | 3/1.5 | 1,222 (-2%) | 7mo | $215,000 | $176 | 65 |
| 34779 Beach Park Ave | 0.55mi | 4/2.0 (+1) | 1,234 (-0%) | 8mo | $205,000 | $166 | 62 |
| 33661 Kenilworth Rd | 0.50mi | 4/2.0 (+1) | 1,339 (+8%) | 1mo | $215,000 | $161 | 58 |
| 476 Woodstock Rd | 0.62mi | 3/1.0 | 1,194 (-4%) | 6mo | $179,900 | $151 | 55 |
| 33986 Iris Ln | 0.39mi | 3/1.5 | 1,389 (+12%) | 7mo | $179,900 | $130 | 54 |
| 650 Mannering Rd | 0.58mi | 3/1.0 | 1,152 (-7%) | 9mo | $140,000 | $122 | 50 |
| 768 E 347th St | 0.48mi | 3/1.5 | 1,104 (-11%) | 10mo | $195,000 | $177 | 49 |
| 336 Waverly Rd | 0.75mi | 3/1.5 | 1,350 (+9%) | 3mo | $192,500 | $143 | 46 |
| 34633 Glen Dr | 0.55mi | 3/1.5 | 1,078 (-13%) | 8mo | $230,000 | $213 | 44 |
Match score weights: distance 35% · size 25% · config 20% · recency 20%. Top-matched comps best support the ARV.
Projected returns pro-forma
-3.0% appreciation · 4.81% rent growth · sell at horizon
- IRR
- -3.0%
- Equity multiple
- 0.89×
- Total profit
- $-5,419
- Equity at exit
- $25,333
- IRR
- 8.5%
- Equity multiple
- 1.70×
- Total profit
- $33,404
- Equity at exit
- $14,690
Cash invested: $47,572 (down + closing). Projections, not guarantees.
Landlord ↔ Tenant lean methodology
- Overall (STATE)
- 73 Landlord-Friendly
- State Ohio
- 73 Landlord-Friendly · R+6
- County
- — inherits STATE
- City
- — inherits STATE
ZIP-level market 44095
- Rents YoY
- 4.8%
- Active inventory
- 129
- Price-to-rent
- 8.0×
Monthly cashflow live
- Estimated rent
- $1,763 medium interval (Pro) →
- Mortgage (P&I)
- −$891
- Tax from tax record
- −$135 /mo · $1,617/yr
- Insurance
- −$71
- HOA
- −$0
- Vacancy / Maint / Mgmt
- −$370
- Net cashflow
- $296
Break-even live
UW: 25.0% down · 7.5% · 30yr · 1.5% tax · 5.0% vac · 8.0% maint · 8.0% mgmt
Financing live
Cash to close
- Down payment
- $42,475
- Closing costs
- $5,097
- Reserves months
- —
- Total cash needed
- —
Loan-product check · same deal, 3 products live
Conventional
25% down · 7.5% · 30yr
- Down + closing
- —
- Monthly P&I
- —
- Monthly cashflow
- —
- DSCR
- —
- Eligible?
- —
Personal DTI + credit; lowest rate.
DSCR
20% down · 8.5% · 30yr
- Down + closing
- —
- Monthly P&I
- —
- Monthly cashflow
- —
- DSCR
- —
- Eligible?
- —
No personal income docs; deal must DSCR.
Hard money
10% down · 12.0% · 12mo
- Down + closing
- —
- Monthly P&I
- —
- Monthly cashflow
- —
- DSCR
- —
- Eligible?
- —
Short-term bridge; refi at stabilization.
Rent comps 1 comps
| Address | Beds | Baths | Sqft | Rent | $/sqft | DOM | Units | Dist |
|---|---|---|---|---|---|---|---|---|
| 360 E 326th St Willowick, OH | 2.0 | 2.0 | 1053 | $1,447 | $1.37 | 2d | 1 | 1.20mi |
Listing history 4 events
-
2026-04-28status Pending
-
2026-04-22status Active
-
2026-04-15status Pending
-
2026-04-08$169,900 Active
ⓘ Source: listings_history table (triggers on properties + properties_extension) + one-shot
backfill from property_details.listing_events for pre-trigger history.
Tax reassessment forecast OH · Partial reset (capped growth)
- Current annual tax
- $1,617 · $135/mo
- Projected year-2 tax
- $2,134 · $178/mo
- Expected delta
- +$517/yr (+$43/mo · 32.0%)
ⓘ Screening estimate from a state-policy table — verify with the county assessor before closing.
Climate risk First Street
- Flood 1/10 Low FEMA zone X (unshaded) · 0% chance over 30 yrs
- Wildfire 1/10 Low
- Heat 3/10 Moderate 7 d/yr ≥93°F today · 18 d/yr by 30 yrs out
- Wind 1/10 Low
- Air quality 4/10 Moderate 6 unhealthy d/yr today · 6 by 30 yrs out
Nearby sold comps map
Loading sold comps map…
Walkable amenities ~0.75 mi
Loading nearby amenities…
Taxation est. · year 1
- Rental income
- $21,155
- − Mortgage interest
- −$9,517
- − Property taxes
- −$1,617
- − Insurance
- −$850
- − Repairs & maintenance
- −$1,692
- − Management
- −$1,692
- − Depreciation
- −$4,943
- Taxable income
- $844
- Est. tax owed @ 24.0%
- −$203
- After-tax cash flow
- $3,352/yr
For passive investors: Depreciation is non-cash, so a rental often shows a tax loss while cash-flowing — sheltering income. Rental losses are passive: they offset passive income freely, and up to $25,000/yr can offset ordinary (W-2) income if you actively participate and your MAGI is under $100k (phasing out to $0 by $150k); unused losses carry forward. On sale, claimed depreciation is recaptured at up to 25%, and gains may owe capital-gains tax (a 1031 exchange can defer both). Figures are a year-1 estimate at your 24.0% rate — not tax advice; consult a CPA.
Schools (NCES district)
- District
- Willoughby-Eastlake City
- NCES district ID
- 3904510
- Math proficiency
- 42% ▼ -21.00%
- Reading proficiency
- 58% ▼ -11.00%
- Median HH income
- $52,500
- Composite
- 42.96/100
- National rank
- #3110
- State rank
- #434 of 656 in OH
Livability — Eastlake
- Score
- 68/100
- State rank
- #550
- US rank
- #9388
Category grades
Schools grade is shown separately in the Schools card above.
Census & demographics
- Census place
- Eastlake, OH
- County
- Lake County · 204,927 people
- City population
- 32,363
- Metro
- Cleveland-Elyria, OH
- Population (ZIP)
- 32,363
- Household income
- $71,543
- Rent vs Own
- Severe rent burden
- 590.0
Population outlook (Lake County) Hauer SSP2
- Today (2025)
- 230,022 people
- By 2030
- 228,151 · -0.8%
- By 2040
- 221,018 · -3.9%
- By 2050
- 212,754 · -7.5%
- By 2075
- 200,309 · -12.9%
- By 2100
- 183,315 · -20.3%
Race, ethnicity, and origin ACS 2023
- Neighborhood character
- Predominantly White (87%)
- Race & ethnicity
- White 87% Black 5% Two or more races 5% Hispanic / Latino 3%
- Common ancestry
- Romanian 8% Slovak 2% Lithuanian 2%
- Foreign-born
- 3% · Canada
- Languages at home
- 94% English-only · Russian/Polish/Slavic 3% Spanish 1% German/W. Germanic 1%
Political lean MEDSL · Lake
- 2024 margin
- R (+14.3) · D 42.4% · R 56.7%
- 2008→2024 swing
- -15.2pp toward R · 2008: 0.8pp · 2024: -14.3pp
- All cycles
- 2024: R+14.3 2020: R+13.6 2016: R+15.6 2012: R+1.7 2008: D+0.8
Not yet ingested
- Civics
- —
Market trends
- HPI YoY
- ▼ -187.78%
- Current HPI
- 171.8121
- Rent YoY
- ▲ 4.81%
- Metro
- Cleveland-Elyria, OH
- State GDP YoY
- ▲ 1.98%
- F500 in state
- 48
Industry mix (Fortune 500 HQ in OH)
| Industry | F500 HQs | Revenue |
|---|---|---|
| Insurance | 3 | $145B |
|
||
| Industrial Machinery | 3 | $49B |
|
||
| Financial Services | 3 | $24B |
|
||
| Consumer Goods | 2 | $93B |
|
||
| Aerospace / Defense | 2 | $47B |
|
||
| Utilities | 2 | $33B |
|
||
Price history
4 events — show timeline
- 2026-04-28 Pending — MLSNOW
- 2026-04-22 Relisted — MLSNOW
- 2026-04-15 Pending — MLSNOW
- 2026-04-08 Listed $169,900 MLSNOW
Property tax history
+0.1%/yrLatest (2025): $1,617 · -29.1% YoY. Source: county tax records.
Cash-flow waterfall
monthlySold comps — $/sqft
last 12 mo · ≤1 miLoading sold comps…