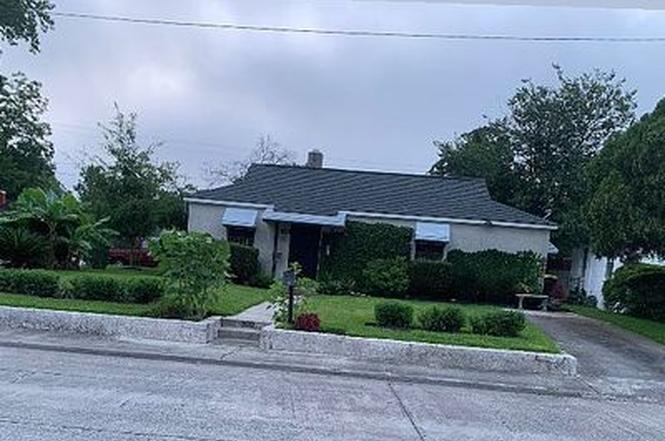
900 Porter St · Savannah, GA
Flood risk 1/10 · Minimal
- FEMA flood zone
- X (unshaded)
- Chance of flooding over 30 yrs
- 0.0%
- Est. flood insurance / yr
- $507 – $1,088
Fire risk 3/10 · Minor
- Est. fire insurance / yr
- $963 – $1,789
Heat risk 9/10 · Severe
- Hot days now (above 109°F)
- 7 days/yr
- Hot days in 30 yrs
- 18 days/yr
Wind risk 9/10 · Severe
- Chance of severe wind over 30 yrs
- 99.0%
Air-quality risk 5/10 · Moderate
- Unhealthy air days now
- 7 days/yr
- Unhealthy air days in 30 yrs
- 8 days/yr
Risk factors via First Street. Map © Google.
Why this score? — see what drove the D+ grade
The composite is a weighted blend of 9 inputs, each scored 0–100. Each bar is that input's sub-score; the figure is the points it added to the 100-point composite (weight × sub-score).
- Cash flow +24.0/30.0
- DSCR +7.7/10.0
- 1% rule +5.0/10.0
- Livability +4.3/5.0
- Rent growth +2.5/5.0
- Condition / age +2.5/5.0
- Schools +2.0/10.0
- ARV discount +0.0/15.0
- Appreciation +0.0/10.0
$177,700
🖨 Deal sheet 📄 Offer letter ✓ Due diligence
Listing remarks
Welcome to your dream home in the heart of Savannah’s historic Carver Village. This remarkable full masonry construction home sits on a generous corner lot, seamlessly blending structural integrity with modern, eco-friendly upgrades. From the moment you arrive, the striking tabby exterior captures the unique coastal heritage of the region, offering unmatched durability. Step inside this turnkey, move-in-ready residence to find a layout featuring three spacious bedrooms and two full bathrooms. Every major system has been recently updated for your peace of mind, including a newer HVAC system, a newer roof, and a newer water heater. These high-ticket improvements ensure year-round comfor
Key facts
- Tabby exterior
- Private backyard
- 5,009 sq ft lot
Tags
Property features AI
Finance
- HOA & community: Curbs
Exterior
- Parking: Detached garage; Carport (2 spaces); On-street parking available; Off-street parking available
- Security: Security lights
- Utilities: Public water; Public sewer; 220-volt electric service; Cable available
- Home design: Single-family residence; 1 story
- Construction: Block and stucco construction; Asphalt/composition roof; Concrete perimeter foundation and slab; Built on a 0.115-acre lot
- Exterior features: Corner lot; Chain link fenced yard; Outbuilding / shed
Interior
- Bathrooms: 2 full bathrooms
- Heating & cooling: Central heating (Forced air, natural gas); Central electric air conditioning
- Interior features: Electric water heater; Security lights
- Laundry & utility: Washer hookup
Neighborhood map
What this means for you Summary
Snapshot
- This is a 3-bed/2.0-bath single-family listed at $178k.
Deal economics
- At list price, monthly cash flow is $347 ($4k/yr) — positive.
- The deal already cash-flows at list — no discount required.
- To meet the 1% rule (rent ≥ 1% of price), the offer needs to be $177k (0.2% below list).
- Recommended offer: $175k (1.5% below list) — sets the bar for market timing.
- Cap rate 8.6% vs local median 4.0% in Savannah — top-decile yield for the area; either an underpriced asset or a hidden risk that comps aren't pricing in. Stress-test before assuming the spread holds.
Location & tenants
- Location reads 86/100 on livability (#1 in GA, #397 nationally) — a professional / high-income tenant draw. Strengths: crime A+, amenities A+, commute A+; Watch: employment D, schools F.
- Savannah-Chatham County (urban): math 20% / reading 26% proficiency, ranked #134 of 174 in GA (top 77%) — low school quality limits family demand, transient renter base, plan for 1-2y turnover.
- Market conditions: 76 active listings in the ZIP; 40 comparable units currently listed for rent nearby; rentals at typical pace (median 24d on market — plan ~3-4 weeks tenant-placement turnaround); 48% of comp listings sitting > 30 days — soft ceiling on asking rent; lower-income renter base — watch delinquency; 2,694 units permitted in Chatham County in 2024 (973 in 5+ unit buildings).
- At $1,774/mo this rent would consume 57% of the median local household income ($37k/yr) (locally 613% of renters already pay >50% of income on rent) — very limited rent-growth headroom before tenants either downsize or default.
Forward outlook
- Local home prices are declining (-3.0%/yr); year-one equity from $1k of loan paydown is wiped out by about $5k of value loss. Plan a longer hold.
- Chatham County population projected at +33% by 2050 — long-run rental-demand tailwind backs the buy-and-hold thesis.
Negotiation context
- It's been on market 26 days — a 2% lower offer ($175k) is reasonable based on typical stale-listing flexibility.
- 2 sale attempts since 14y ago with the ask held roughly flat each time — persistent listings suggest the price (not the market) is what's stuck; bring a comps-based counter.
Risks & watch-outs
- Watch-outs: built in 1948 — expect roof / HVAC / electrical / plumbing capex.
- Climate carrying-cost: severe wind risk, 99% chance of damaging wind over 30y; extreme-heat days projected 7→18/yr by 2055 (HVAC capex compounding) — expect insurance premiums to compound above CPI over the hold.
Questions for the listing agent
- Built in 1948 — when were the roof, HVAC, electrical panel, plumbing, and water heater last replaced?
- Is there a deadline driving the sale (1031 exchange, divorce, estate, relocation)? That informs how much negotiation room exists.
- Schools are F-rated, which usually means shorter tenancies and higher turnover. Who's the typical renter profile here, and what's been the actual vacancy rate?
- The area grade is low — what's the realistic commute time and amenity access for the typical tenant pool here? Any planned neighborhood developments (good or bad) we should know about?
- What's the average days-on-market for RENTAL listings here right now (not sales)? A rising rental-DOM trend means longer vacancies and softer asking-rent achievability than the comps imply.
- What's the recent tenant-quality profile in this submarket — average credit score on applications, eviction rate, late-payment / NSF rate, and stable-employment percentage? A property-management company in the area should have these aggregated.
- How much new for-sale + rental construction is in the pipeline within 1–3 miles? Heavy new supply typically softens prices + rents 12–24 months out; constrained supply supports both.
Investment metrics
- 1% rule
- 1.00% ✗
- Cap rate
- 8.64%
- Cash-on-cash
- 8.37%
- DSCR
- 1.37
- GRM
- 8.3
CMA / ARV
- ARV (on-the-fly)
- $126,976
- Comps found
- 12
Show comp detail 12 sales within ~0.75 mi
| Address | Dist | Beds/Ba | Sqft | Sold | Price | $/sf | Match |
|---|---|---|---|---|---|---|---|
| 1006 Lynah St | 0.14mi | 3/1.0 | 1,008 (+2%) | 8mo | $100,000 | $99 | 80 |
| 914 Bowden St | 0.29mi | 3/1.5 | 1,008 (+2%) | 12mo | $125,000 | $124 | 72 |
| 1002 Lynah St | 0.12mi | 3/1.0 | 1,128 (+14%) | 2mo | $100,000 | $89 | 66 |
| 909 Googe St | 0.08mi | 3/1.0 | 1,116 (+12%) | 8mo | $65,000 | $58 | 65 |
| 1219 Elliott Ave | 0.36mi | 2/1.0 (-1) | 972 (-2%) | 8mo | $160,000 | $165 | 64 |
| 1600 Sylvester Dr | 0.43mi | 3/2.0 | 1,100 (+11%) | 1mo | $98,000 | $89 | 61 |
| 17 Nelson St | 0.19mi | 3/2.0 | 1,122 (+13%) | 11mo | $220,000 | $196 | 60 |
| 1025 Elliott Ave | 0.34mi | 2/2.0 (-1) | 900 (-9%) | 5mo | $115,000 | $128 | 59 |
| 906 Cubbedge St | 0.15mi | 3/2.0 | 1,140 (+15%) | 12mo | $172,000 | $151 | 58 |
| 105 Pitt St | 0.38mi | 3/1.0 | 1,102 (+11%) | 4mo | $35,000 | $32 | 57 |
| 1424 Comer St | 0.70mi | 2/1.0 (-1) | 850 (-14%) | 7mo | $207,000 | $244 | 29 |
| 278 Ferrill St | 0.75mi | 2/1.0 (-1) | 851 (-14%) | 14mo | $160,000 | $188 | 20 |
Match score weights: distance 35% · size 25% · config 20% · recency 20%. Top-matched comps best support the ARV.
Projected returns pro-forma
-3.0% appreciation · 3.0% rent growth · sell at horizon
- IRR
- -3.6%
- Equity multiple
- 0.86×
- Total profit
- $-6,772
- Equity at exit
- $26,496
- IRR
- 6.0%
- Equity multiple
- 1.45×
- Total profit
- $22,240
- Equity at exit
- $15,364
Cash invested: $49,756 (down + closing). Projections, not guarantees.
Landlord ↔ Tenant lean methodology
- Overall (STATE)
- 90 Strongly Landlord-Friendly
- State Georgia
- 90 Strongly Landlord-Friendly · R+3
- County
- — inherits STATE
- City
- — inherits STATE
ZIP-level market 31415
- Home prices YoY
- -21.4%
- Active inventory
- 76
- Price-to-rent
- 8.3×
Monthly cashflow live
- Estimated rent
- $1,774 high interval (Pro) →
- Mortgage (P&I)
- −$932
- Tax from tax record
- −$49 /mo · $584/yr
- Insurance
- −$74
- HOA
- −$0
- Vacancy / Maint / Mgmt
- −$373
- Net cashflow
- $347
Break-even live
UW: 25.0% down · 7.5% · 30yr · 1.5% tax · 5.0% vac · 8.0% maint · 8.0% mgmt
Financing live
Cash to close
- Down payment
- $44,425
- Closing costs
- $5,331
- Reserves months
- —
- Total cash needed
- —
Loan-product check · same deal, 3 products live
Conventional
25% down · 7.5% · 30yr
- Down + closing
- —
- Monthly P&I
- —
- Monthly cashflow
- —
- DSCR
- —
- Eligible?
- —
Personal DTI + credit; lowest rate.
DSCR
20% down · 8.5% · 30yr
- Down + closing
- —
- Monthly P&I
- —
- Monthly cashflow
- —
- DSCR
- —
- Eligible?
- —
No personal income docs; deal must DSCR.
Hard money
10% down · 12.0% · 12mo
- Down + closing
- —
- Monthly P&I
- —
- Monthly cashflow
- —
- DSCR
- —
- Eligible?
- —
Short-term bridge; refi at stabilization.
Rent comps 40 comps
| Address | Beds | Baths | Sqft | Rent | $/sqft | DOM | Units | Dist |
|---|---|---|---|---|---|---|---|---|
| 911 Crosby St Savannah, GA | 3.0 | 2.0 | 1116 | $2,000 | $1.79 | 43d | 1 | 0.18mi |
| 1013 Carroll St Savannah, GA | 2.0 | 1.5 | 768 | $1,400 | $1.82 | 43d | 1 | 0.21mi |
| 17 Dutton St Savannah, GA | 3.0 | 1.0 | 990 | $1,650 | $1.67 | 13d | 1 | 0.32mi |
| 905 Elliott Ave Savannah, GA | 2.0 | 2.0 | 1032 | $1,800 | $1.74 | 43d | 1 | 0.36mi |
| 1437 Audubon Dr Savannah, GA | 3.0 | 1.0 | 925 | $1,575 | $1.70 | 43d | 1 | 0.40mi |
| 1402 Comer St Savannah, GA | 2.0 | 1.0 | 690 | $1,200 | $1.74 | 43d | 1 | 0.72mi |
| 1402 New Castle St Savannah, GA | 2.0 | 1.0 | 928 | $1,500 | $1.62 | 43d | 1 | 0.77mi |
| 1416 Chester St Savannah, GA | 3.0 | 1.0 | 960 | $1,600 | $1.67 | 23d | 1 | 0.82mi |
| 206 Ferrill St Savannah, GA | 3.0 | 1.0 | 936 | $1,450 | $1.55 | 13d | 1 | 0.91mi |
| 40 Eagle St Savannah, GA | 1.0–2.0 | 1.0 | 841 | $1,331 | $1.58 | 23d | 6 | 0.93mi |
| 1415 Richards St Savannah, GA | 2.0 | 1.0 | 672 | $1,200 | $1.79 | 43d | 1 | 0.95mi |
| 1419 Richards St Savannah, GA | 2.0 | 1.0 | 672 | $1,200 | $1.79 | 43d | 1 | 0.95mi |
| 1421 Richards St Savannah, GA | 2.0 | 1.0 | 672 | $1,275 | $1.90 | 43d | 1 | 0.95mi |
| 1423 Richards St Savannah, GA | 2.0 | 1.0 | 672 | $1,275 | $1.90 | 43d | 1 | 0.95mi |
| 226 Fell St Savannah, GA | 3.0 | 1.0 | 1025 | $1,695 | $1.65 | 21d | 1 | 0.97mi |
| 1024 W 39th St Savannah, GA | 2.0 | 1.0 | 860 | $1,399 | $1.63 | 23d | 1 | 0.99mi |
| 1019 W 35th St Unit B Savannah, GA | 3.0 | 2.0 | 1071 | $2,199 | $2.05 | 13d | 1 | 1.00mi |
| 1325 Exley St Savannah, GA | 2.0–3.0 | 1.0–2.5 | 1193 | $1,432 | $1.20 | 21d | 6 | 1.04mi |
| 2100 Patch St Savannah, GA | 2.0 | 1.0 | 672 | $1,525 | $2.27 | 43d | 1 | 1.05mi |
| 2023 Gugel St Savannah, GA | 3.0 | 2.0 | 1008 | $1,900 | $1.88 | 43d | 1 | 1.10mi |
| 120 Jenks St Savannah, GA | 3.0 | 1.0 | 1042 | $1,600 | $1.54 | 43d | 1 | 1.10mi |
| 1109 W 41st St Savannah, GA | 3.0 | 1.0 | 960 | $1,620 | $1.69 | 43d | 1 | 1.13mi |
| 1011 W 40th St Savannah, GA | 3.0 | 2.0 | 1125 | $1,995 | $1.77 | 13d | 1 | 1.15mi |
| 2108 Bulloch St Savannah, GA | 2.0 | 1.0 | 638 | $1,095 | $1.72 | 23d | 1 | 1.16mi |
| 2123 Harden St Savannah, GA | 2.0 | 1.0 | 1000 | $1,550 | $1.55 | 23d | 1 | 1.21mi |
| 540 Selma St Savannah, GA | 2.0–5.0 | 2.0–5.0 | 790 | $1,112 | $1.41 | 23d | 1 | 1.21mi |
| 2203 Harden St Unit A Savannah, GA | 3.0 | 1.0 | 900 | $2,100 | $2.33 | 13d | 1 | 1.22mi |
| 2221 Harden St Savannah, GA | 3.0 | 1.0 | 1000 | $1,550 | $1.55 | 43d | 1 | 1.23mi |
| 620 W 36th St Unit B Savannah, GA | 3.0 | 1.0 | 812 | $1,650 | $2.03 | 43d | 1 | 1.24mi |
| 1005 W Victory Dr Savannah, GA | 3.0 | 2.0 | 1056 | $1,950 | $1.85 | 23d | 1 | 1.27mi |
| 2705 Stevens St Savannah, GA | 3.0 | 1.0 | 900 | $1,585 | $1.76 | 43d | 1 | 1.28mi |
| 620 W 38th St Unit B Savannah, GA | 2.0 | 1.0 | 1076 | $1,600 | $1.49 | 43d | 1 | 1.28mi |
| 528 Selma St Unit B Savannah, GA | 2.0 | 2.0 | 974 | $2,625 | $2.70 | 13d | 1 | 1.30mi |
| 513 W 35th St Savannah, GA | 2.0 | 1.0 | 930 | $1,450 | $1.56 | 13d | 1 | 1.30mi |
| 513 W 35th St Unit A LOWER Savannah, GA | 2.0 | 1.0 | 930 | $1,350 | $1.45 | 13d | 1 | 1.30mi |
| 508 Kline St Savannah, GA | 2.0 | 2.0 | 900 | $2,000 | $2.22 | 13d | 1 | 1.31mi |
| 417 W 32nd St Unit B Savannah, GA | 3.0 | 3.0 | 972 | $2,600 | $2.67 | 43d | 1 | 1.32mi |
| 615 Montgomery St Savannah, GA | 1.0–2.0 | 1.0–2.0 | 902 | $3,164 | $3.51 | 13d | 18 | 1.34mi |
| 323 W 31st St #2 Savannah, GA | 2.0 | 1.0 | 850 | $1,850 | $2.18 | 13d | 1 | 1.36mi |
| 1418 Montgomery St Savannah, GA | 2.0 | 1.0–2.0 | 576 | $1,900 | $3.30 | 13d | 13 | 1.36mi |
Listing history 16 events
-
2026-06-16statusdays on market $177,700 Pending 26 DOM
-
2026-06-15days on market $177,700 Active Under Contract 25 DOM
-
2026-06-14days on market $177,700 Active Under Contract 23 DOM
-
2026-06-13days on market $177,700 Active Under Contract 22 DOM
-
2026-06-10days on market $177,700 Active Under Contract 20 DOM
-
2026-06-09days on market $177,700 Active Under Contract 19 DOM
-
2026-06-08days on market $177,700 Active Under Contract 18 DOM
-
2026-06-07days on market $177,700 Active Under Contract 17 DOM
-
2026-06-05days on market $177,700 Active Under Contract 14 DOM
-
2026-06-03days on market $177,700 Active Under Contract 13 DOM
-
2026-06-02days on market $177,700 Active Under Contract 12 DOM
-
2026-06-01days on market $177,700 Active Under Contract 11 DOM
-
2026-05-31days on market $177,700 Active Under Contract 10 DOM
-
2026-05-30days on market $177,700 Active Under Contract 9 DOM
-
2026-05-12$184,900 Active 595-char remark
-
2012-07-17$49,900
ⓘ Source: listings_history table (triggers on properties + properties_extension) + one-shot
backfill from property_details.listing_events for pre-trigger history.
Tax reassessment forecast GA · Resets to sale price
- Current annual tax
- $584 · $49/mo
- Projected year-2 tax
- $1,635 · $136/mo
- Expected delta
- +$1,051/yr (+$88/mo · 179.9%)
ⓘ Screening estimate from a state-policy table — verify with the county assessor before closing.
Climate risk First Street
- Flood 1/10 Low FEMA zone X (unshaded) · 0% chance over 30 yrs
- Wildfire 3/10 Moderate
- Heat 9/10 Extreme 7 d/yr ≥109°F today · 18 d/yr by 30 yrs out
- Wind 9/10 Extreme 99% chance of damaging wind over 30 yrs
- Air quality 5/10 Major 7 unhealthy d/yr today · 8 by 30 yrs out
Nearby sold comps map
Loading sold comps map…
Walkable amenities ~0.75 mi
Loading nearby amenities…
Taxation est. · year 1
- Rental income
- $21,291
- − Mortgage interest
- −$9,954
- − Property taxes
- −$584
- − Insurance
- −$888
- − Repairs & maintenance
- −$1,703
- − Management
- −$1,703
- − Depreciation
- −$5,169
- Taxable income
- $1,288
- Est. tax owed @ 24.0%
- −$309
- After-tax cash flow
- $3,855/yr
For passive investors: Depreciation is non-cash, so a rental often shows a tax loss while cash-flowing — sheltering income. Rental losses are passive: they offset passive income freely, and up to $25,000/yr can offset ordinary (W-2) income if you actively participate and your MAGI is under $100k (phasing out to $0 by $150k); unused losses carry forward. On sale, claimed depreciation is recaptured at up to 25%, and gains may owe capital-gains tax (a 1031 exchange can defer both). Figures are a year-1 estimate at your 24.0% rate — not tax advice; consult a CPA.
Schools (NCES district)
- District
- Savannah-Chatham County
- NCES district ID
- 1301020
- Math proficiency
- 20% ▼ -11.00%
- Reading proficiency
- 26% ▼ -5.00%
- Median HH income
- $47,443
- Composite
- 20.14/100
- National rank
- #8639
- State rank
- #134 of 174 in GA
Livability — Savannah
- Score
- 86/100
- State rank
- #1
- US rank
- #397
Category grades
Schools grade is shown separately in the Schools card above.
Census & demographics
- Census place
- Savannah, GA
- County
- Chatham County · 271,602 people
- City population
- 216,564
- Metro
- Savannah, GA
- Population (ZIP)
- 11,082
- Household income
- $37,109
- Rent vs Own
- Severe rent burden
- 613.0
Population outlook (Chatham County) Hauer SSP2
- Today (2025)
- 332,584 people
- By 2030
- 355,508 · +6.9%
- By 2040
- 400,030 · +20.3%
- By 2050
- 443,019 · +33.2%
- By 2075
- 534,579 · +60.7%
- By 2100
- 583,863 · +75.6%
Race, ethnicity, and origin ACS 2023
- Neighborhood character
- Predominantly Black (89%)
- Race & ethnicity
- Black 89% White 5% Hispanic / Latino 5% Two or more races 3%
- Foreign-born
- 2% · Canada
- Languages at home
- 95% English-only · Spanish 4%
Political lean MEDSL · Chatham
- 2024 margin
- D (+18.0) · D 58.6% · R 40.6%
- 2008→2024 swing
- +3.6pp toward D · 2008: 14.4pp · 2024: 18.0pp
- All cycles
- 2024: D+18.0 2020: D+18.8 2016: D+14.5 2012: D+12.0 2008: D+14.4
Not yet ingested
- Civics
- —
Market trends
- HPI YoY
- ▼ -55.36%
- Current HPI
- 203.0696
- Rent YoY
- —
- Metro
- Savannah, GA
- State GDP YoY
- ▲ 2.66%
- F500 in state
- 28
Industry mix (Fortune 500 HQ in GA)
| Industry | F500 HQs | Revenue |
|---|---|---|
| Paper / Packaging | 2 | $29B |
|
||
| Retail | 1 | $160B |
|
||
| Transportation / Logistics | 1 | $91B |
|
||
| Airlines | 1 | $62B |
|
||
| Consumer Goods | 1 | $47B |
|
||
| Utilities | 1 | $25B |
|
||
Price history
+256.1% since first listed4 events — show timeline
- 2026-06-16 Pending — Hive MLS
- 2026-05-28 Contingent — Hive MLS
- 2026-05-19 Listed $177,700 Hive MLS
- 2012-07-17 Listed $49,900 Hive MLS
Property tax history
-1.2%/yrLatest (2025): $584 · -0.6% YoY. Source: county tax records.
Cash-flow waterfall
monthlySold comps — $/sqft
last 12 mo · ≤1 miLoading sold comps…