2608 Glasgow Way · Denton, TX
Flood risk 1/10 · Minimal
- FEMA flood zone
- X (unshaded)
- Chance of flooding over 30 yrs
- 0.0%
- Est. flood insurance / yr
- $507 – $1,088
Fire risk 5/10 · Moderate
- Est. fire insurance / yr
- $1,222 – $2,270
Heat risk 7/10 · Major
- Hot days now (above 109°F)
- 7 days/yr
- Hot days in 30 yrs
- 22 days/yr
Wind risk 6/10 · Moderate
- Chance of severe wind over 30 yrs
- 27.0%
Air-quality risk 3/10 · Minor
- Unhealthy air days now
- 3 days/yr
- Unhealthy air days in 30 yrs
- 4 days/yr
Risk factors via First Street. Map © Google.
Why this score? — see what drove the F grade
The composite is a weighted blend of 9 inputs, each scored 0–100. Each bar is that input's sub-score; the figure is the points it added to the 100-point composite (weight × sub-score).
- Cash flow +7.4/30.0
- Livability +4.4/5.0
- ARV discount +4.1/15.0
- Schools +3.5/10.0
- Condition / age +2.5/5.0
- Rent growth +1.9/5.0
- DSCR +1.5/10.0
- 1% rule +0.9/10.0
- Appreciation +0.0/10.0
$435,000
🖨 Deal sheet 📄 Offer letter ✓ Due diligence
Listing remarks
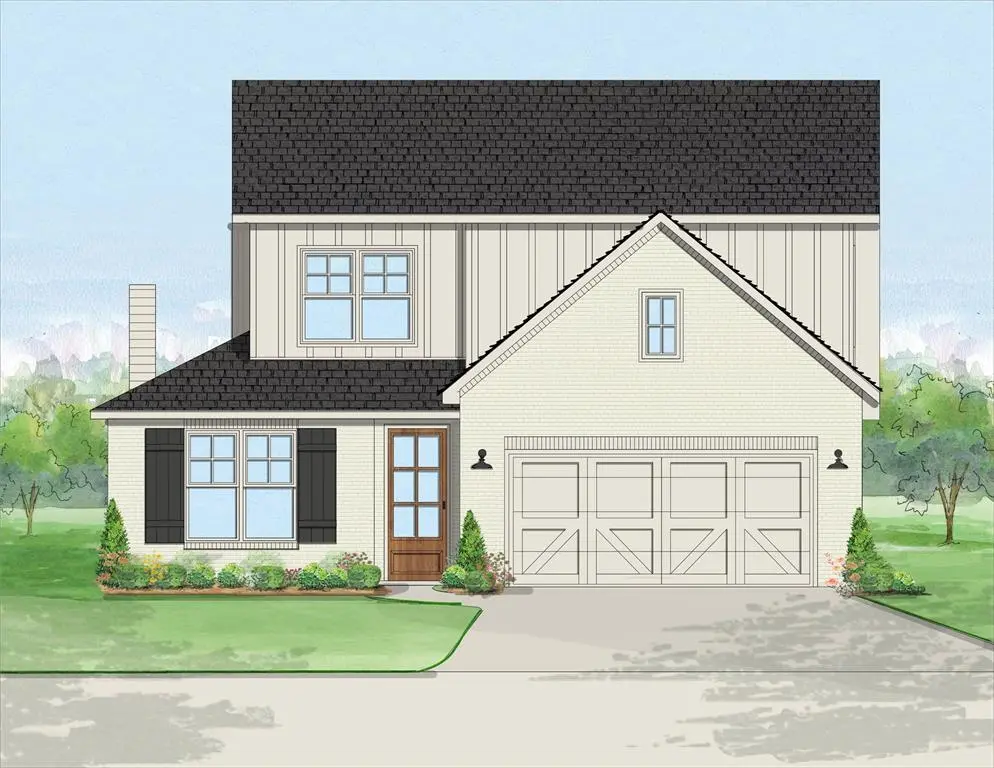
Discover a stunning new construction home in one of Denton’s most desirable communities, The Courts of Bonnie Brae! This beautifully designed two-story home showcases one of Clarity Homes’ newest floor plans, blending modern functionality with timeless farmhouse charm. Featuring 4 spacious bedrooms and 3 full bathrooms, this home offers the perfect layout for both everyday living and entertaining. The open-concept design is enhanced by luxury vinyl wood-style flooring that flows seamlessly through the entry, living, kitchen, mudroom, utility, and main hallways creating a cohesive and elevated look throughout. At the heart of the home, the chef-inspired kitchen boasts an expansiv
Key facts
- Open-concept design
- 1,020 sq ft lot
- 2 garage spots
Tags
Property features AI
Finance
- Other: Utility easement on property; No municipal utility district; Subdivision/community features include curbs and sidewalks
- Financial info: Financing accepted: Cash, Conventional, FHA, VA
- HOA & community: Mandatory homeowners association (Bonnie Brae); Annual HOA fee with maintenance of grounds included; HOA managed by Newroc Services
Exterior
- Parking: Attached 2-car garage with garage door opener and inside entrance; Covered parking for 2 vehicles; Concrete driveway; Lighted parking area; 2-car double doors; garage faces front; kitchen-level access
- Security: Smoke detectors and carbon monoxide detector(s); Security lights
- Utilities: City water and city sewer; Underground utilities; Community mailbox; Curbs and sidewalks; Irrigation equipment
- Home design: Single family residence; Two stories; New construction (completed 2026); Located in the Bonnie Brae planned development
- Construction: Brick construction with radiant barrier; Composition shingle roof; Slab foundation; Smart home features
- Exterior features: Covered porch; Covered patio; Private, landscaped yard with large grassy backyard; Sprinkler system; Gutters and exterior lighting; Fenced backyard with wood privacy fence and gate
Interior
- Kitchen: Electric range; Microwave; Dishwasher; Disposal; Farm sink; Water line to refrigerator; Breakfast bar
- Bedrooms: Primary bedroom on main level with ensuite bath and walk-in closet; Second bedroom on main level with ensuite bath; Two additional bedrooms (one on second level, one on second level)
- Flooring: Luxury vinyl plank; Tile; Carpet
- Bathrooms: Three full bathrooms; Primary bathroom with granite counters, separate shower, double sinks, and built-in cabinets; Additional baths feature granite counters and built-in cabinets
- Heating & cooling: Central heat and air; Heat pump; Electric heating; Ceiling fans; Fireplace(s) contributes to heating
- Interior features: Open floorplan with decorative lighting; Granite counters and kitchen island; Eat-in kitchen; Pantry and walk-in pantry; Cable TV and high-speed internet available; Smart home system; Plantation shutters; Built-in cabinets; Linen closet
- Laundry & utility: Full-size washer/dryer area; Washer and dryer hookups (electric dryer hookup); Utility room and separate utility room; Mud room with utility closet; Electric water heater
Neighborhood map
What this means for you Summary
Snapshot
- This is a 4-bed/3.0-bath land listed at $435k.
Deal economics
- At list price, monthly cash flow is $-560 ($-7k/yr) — negative.
- To cash-flow at today's rent, offer at most $336k (22.8% below list).
- To meet the 1% rule (rent ≥ 1% of price), the offer needs to be $258k (40.6% below list).
- Recommended offer: $258k (40.6% below list) — sets the bar for 1% rule.
- Cap rate 4.7% vs local median 3.4% in Denton — top-decile yield for the area; either an underpriced asset or a hidden risk that comps aren't pricing in. Stress-test before assuming the spread holds.
Location & tenants
- Location reads 88/100 on livability (#2 in TX, #210 nationally) — a professional / high-income tenant draw. Strengths: amenities A+, commute A+, housing A+.
- Denton ISD (urban): math 36% / reading 43% proficiency, ranked #383 of 826 in TX (top 46%) — families likely to look elsewhere, expect single-tenant / working-renter base with shorter leases.
- Zoned schools: Borman El (math 18% / reading 22%, grade F, #3,536 of 4,322 statewide, top 83%, 429 students, 81% FRL) — zoned schools average 81% FRL vs 38% district-wide (43 pts higher); higher-poverty schools than district average — tighter screening recommended.
- Zoned-school proficiency averages 20% at this address vs 40% district-wide (-20 pts) — the specific schools serving this property underperform the Denton ISD average; the district grade overstates school quality for this exact location.
- Market conditions: Rents soft (-2.5%/yr); 306 active listings in the ZIP; 28 comparable units currently listed for rent nearby; rentals at typical pace (median 25d on market — plan ~3-4 weeks tenant-placement turnaround); 43% of comp listings sitting > 30 days — soft ceiling on asking rent; solid renter incomes; 10,531 units permitted in Denton County in 2024 (2,713 in 5+ unit buildings).
- This rent runs 36% of the median local income ($85k/yr) — at the standard rent-burdened threshold; future hikes will face affordability resistance.
Forward outlook
- Local home prices are declining (-3.0%/yr); year-one equity from $3k of loan paydown is wiped out by about $13k of value loss. Plan a longer hold.
- Denton County population projected at +66% by 2050 — long-run rental-demand tailwind backs the buy-and-hold thesis.
Negotiation context
- It's been on market 38 days — a 3% lower offer ($422k) is reasonable based on typical stale-listing flexibility.
Risks & watch-outs
- Climate carrying-cost: major wind risk, 27% chance of damaging wind over 30y; moderate wildfire risk; extreme-heat days projected 7→22/yr by 2055 (HVAC capex compounding) — expect insurance premiums to compound above CPI over the hold.
Questions for the listing agent
- What do current leases actually rent for vs. the listed asking? Can we see a recent rent roll and the last 12 months of T-12 income?
- It's been on market 38 days. Have you received any prior offers? Is the seller open to a 41% concession, seller financing, or rate buy-down credit?
- What does the HOA fee cover, when was the last increase, and are there any pending special assessments or reserve-fund shortfalls?
- Is there a deadline driving the sale (1031 exchange, divorce, estate, relocation)? That informs how much negotiation room exists.
- Schools are B-rated — typically a magnet for longer-tenancy family renters. What's the average tenant stay here, and is there a school-zone premium baked into asking?
- The area grade is low — what's the realistic commute time and amenity access for the typical tenant pool here? Any planned neighborhood developments (good or bad) we should know about?
- What's the average days-on-market for RENTAL listings here right now (not sales)? A rising rental-DOM trend means longer vacancies and softer asking-rent achievability than the comps imply.
- What's the recent tenant-quality profile in this submarket — average credit score on applications, eviction rate, late-payment / NSF rate, and stable-employment percentage? A property-management company in the area should have these aggregated.
- How much new for-sale + rental construction is in the pipeline within 1–3 miles? Heavy new supply typically softens prices + rents 12–24 months out; constrained supply supports both.
Investment metrics
- 1% rule
- 0.59% ✗
- Cap rate
- 4.75%
- Cash-on-cash
- -5.52%
- DSCR
- 0.75
- GRM
- 14.0
CMA / ARV
- ARV (median comp)
- $404,159
- List price
- $435,000
- Delta
- 7.63%
- Verdict
- FAIR
- Comps
- 20 within 1.0 mi
Projected returns pro-forma
-3.0% appreciation · 0.0% rent growth · sell at horizon
- IRR
- -28.6%
- Equity multiple
- 0.06×
- Total profit
- $-113,957
- Equity at exit
- $64,860
- IRR
- -42.0%
- Equity multiple
- -0.44×
- Total profit
- $-175,305
- Equity at exit
- $37,611
Cash invested: $121,800 (down + closing). Projections, not guarantees.
Landlord ↔ Tenant lean methodology
- Overall (STATE)
- 87 Strongly Landlord-Friendly
- State Texas
- 87 Strongly Landlord-Friendly · R+5
- County
- — inherits STATE
- City
- — inherits STATE
ZIP-level market 76207
- Home prices YoY
- -27.6%
- Rents YoY
- -2.5%
- Active inventory
- 306
- Price-to-rent
- 14.0×
Monthly cashflow live
- Estimated rent
- $2,585 high interval (Pro) →
- Mortgage (P&I)
- −$2,281
- Tax from tax record
- −$98 /mo · $1,175/yr
- Insurance
- −$181
- HOA
- −$42
- Vacancy / Maint / Mgmt
- −$543
- Net cashflow
- $-560
Break-even live
UW: 25.0% down · 7.5% · 30yr · 1.5% tax · 5.0% vac · 8.0% maint · 8.0% mgmt
Financing live
Cash to close
- Down payment
- $108,750
- Closing costs
- $13,050
- Reserves months
- —
- Total cash needed
- —
Loan-product check · same deal, 3 products live
Conventional
25% down · 7.5% · 30yr
- Down + closing
- —
- Monthly P&I
- —
- Monthly cashflow
- —
- DSCR
- —
- Eligible?
- —
Personal DTI + credit; lowest rate.
DSCR
20% down · 8.5% · 30yr
- Down + closing
- —
- Monthly P&I
- —
- Monthly cashflow
- —
- DSCR
- —
- Eligible?
- —
No personal income docs; deal must DSCR.
Hard money
10% down · 12.0% · 12mo
- Down + closing
- —
- Monthly P&I
- —
- Monthly cashflow
- —
- DSCR
- —
- Eligible?
- —
Short-term bridge; refi at stabilization.
Rent comps 28 comps
| Address | Beds | Baths | Sqft | Rent | $/sqft | DOM | Units | Dist |
|---|---|---|---|---|---|---|---|---|
| 2704 Donella Dr Denton, TX | 4.0 | 2.0 | 1901 | $2,500 | $1.32 | 43d | 1 | 0.10mi |
| 1709 Sparrow St Denton, TX | 5.0 | 4.0 | 2922 | $3,300 | $1.13 | 1d | 1 | 0.52mi |
| 1513 Woodpecker St Denton, TX | 4.0 | 3.0 | 2733 | $3,500 | $1.28 | 10d | 1 | 0.58mi |
| 2301 Ruff Rd Denton, TX | 4.0 | 2.0 | 1914 | $2,700 | $1.41 | 24d | 1 | 0.63mi |
| 2201 Yellowhammer Rd Denton, TX | 4.0 | 3.0 | 2874 | $3,150 | $1.10 | 24d | 1 | 0.82mi |
| 1403 Kendolph Dr Denton, TX | 3.0 | 2.0 | 1967 | $2,975 | $1.51 | 2d | 1 | 1.05mi |
| 3100 Hornbeam St Argyle, TX | 3.0 | 2.5 | 2572 | $2,550 | $0.99 | 43d | 1 | 1.09mi |
| 4505 Merlot Dr Argyle, TX | 4.0 | 2.5 | 2353 | $2,350 | $1.00 | 43d | 1 | 1.09mi |
| 3121 Hornbeam St Argyle, TX | 3.0 | 2.0 | 1852 | $2,399 | $1.30 | 2d | 1 | 1.12mi |
| 3312 Stonecrop Trl Argyle, TX | 3.0 | 2.0 | 1737 | $2,200 | $1.27 | 24d | 1 | 1.16mi |
| 4512 Remuda Ln Argyle, TX | 3.0 | 2.0 | 1737 | $2,300 | $1.32 | 43d | 1 | 1.18mi |
| 3128 Buckthorn Ln Argyle, TX | 3.0 | 2.0 | 1845 | $2,395 | $1.30 | 43d | 1 | 1.20mi |
| 3401 Aaron Pl Argyle, TX | 3.0 | 2.5 | 1922 | $2,500 | $1.30 | 43d | 1 | 1.22mi |
| 3413 Aaron Pl Argyle, TX | 3.0 | 2.5 | 1684 | $2,250 | $1.34 | 17d | 1 | 1.22mi |
| 3600 Aaron Pl Argyle, TX | 3.0 | 2.5 | 1866 | $2,350 | $1.26 | 17d | 1 | 1.24mi |
| 4008 Vinyard Way Argyle, TX | 3.0 | 2.0 | 1761 | $2,200 | $1.25 | 12d | 1 | 1.24mi |
| 3612 Aaron Pl Argyle, TX | 3.0 | 2.5 | 1684 | $2,350 | $1.40 | 43d | 1 | 1.25mi |
| 4701 Napa Valley Dr Argyle, TX | 3.0 | 2.0 | 1761 | $1,995 | $1.13 | 43d | 1 | 1.26mi |
| 3621 Bonnie Brae St Unit 3621 Argyle, TX | 3.0 | 2.5 | 1866 | $2,195 | $1.18 | 43d | 1 | 1.27mi |
| 4512 Claret Ct Argyle, TX | 4.0 | 2.5 | 2395 | $2,600 | $1.09 | 24d | 1 | 1.28mi |
| 3329 Tamarack Ln Argyle, TX | 4.0 | 2.0 | 1994 | $2,600 | $1.30 | 17d | 1 | 1.34mi |
| 1324 Norman St Denton, TX | 4.0 | 2.0 | 1600 | $1,895 | $1.18 | 43d | 1 | 1.39mi |
| 5200 Woodway Dr Argyle, TX | 4.0 | 3.0 | 2129 | $2,600 | $1.22 | 4d | 1 | 1.40mi |
| 5200 Woodway Dr Argyle, TX | 4.0 | 3.0 | 2129 | $2,900 | $1.36 | 43d | 1 | 1.40mi |
| 4204 Sonoma Dr Argyle, TX | 4.0 | 2.5 | 2105 | $2,100 | $1.00 | 18d | 1 | 1.40mi |
| 5108 Middlestone Ln Argyle, TX | 4.0 | 2.0 | 1913 | $2,750 | $1.44 | 7d | 1 | 1.45mi |
| 1103 Neff St Denton, TX | 4.0 | 2.0 | 1600 | $2,099 | $1.31 | 43d | 1 | 1.46mi |
| 1007 W Collins St Denton, TX | 4.0 | 2.0 | 1696 | $1,850 | $1.09 | 18d | 1 | 1.47mi |
HOA detail
- Monthly dues
- $42 · $504/yr
Listing history 15 events
-
2026-06-18days on market $435,000 Active 38 DOM
-
2026-06-17days on market $435,000 Active 37 DOM
-
2026-06-16days on market $435,000 Active 36 DOM
-
2026-06-15days on market $435,000 Active 35 DOM
-
2026-06-13days on market $435,000 Active 33 DOM
-
2026-06-09days on market $435,000 Active 29 DOM
-
2026-06-08days on market $435,000 Active 28 DOM
-
2026-06-07days on market $435,000 Active 27 DOM
-
2026-06-04days on market $435,000 Active 24 DOM
-
2026-06-03days on market $435,000 Active 23 DOM
-
2026-06-02days on market $435,000 Active 22 DOM
-
2026-06-02price $435,000 Active 21 DOM
-
2026-06-01days on market $449,000 Active 21 DOM
-
2026-05-31days on market $449,000 Active 20 DOM
-
2026-05-11$449,000 Active 1963-char remark
ⓘ Source: listings_history table (triggers on properties + properties_extension) + one-shot
backfill from property_details.listing_events for pre-trigger history.
Tax reassessment forecast TX · Resets to sale price
- Current annual tax
- $1,175 · $98/mo
- Projected year-2 tax
- $7,960 · $663/mo
- Expected delta
- +$6,786/yr (+$565/mo · 577.7%)
ⓘ Screening estimate from a state-policy table — verify with the county assessor before closing.
Climate risk First Street
- Flood 1/10 Low FEMA zone X (unshaded) · 0% chance over 30 yrs
- Wildfire 5/10 Major
- Heat 7/10 Severe 7 d/yr ≥109°F today · 22 d/yr by 30 yrs out
- Wind 6/10 Major 27% chance of damaging wind over 30 yrs
- Air quality 3/10 Moderate 3 unhealthy d/yr today · 4 by 30 yrs out
Nearby sold comps map
Loading sold comps map…
Walkable amenities ~0.75 mi
Loading nearby amenities…
Taxation est. · year 1
- Rental income
- $31,019
- − Mortgage interest
- −$24,367
- − Property taxes
- −$1,175
- − Insurance
- −$2,175
- − Repairs & maintenance
- −$2,481
- − Management
- −$2,481
- − HOA
- −$504
- − Depreciation
- −$12,655
- Taxable loss
- −$14,819
- Est. tax savings @ 24.0%
- +$3,557
- After-tax cash flow
- $-3,167/yr
For passive investors: Depreciation is non-cash, so a rental often shows a tax loss while cash-flowing — sheltering income. Rental losses are passive: they offset passive income freely, and up to $25,000/yr can offset ordinary (W-2) income if you actively participate and your MAGI is under $100k (phasing out to $0 by $150k); unused losses carry forward. On sale, claimed depreciation is recaptured at up to 25%, and gains may owe capital-gains tax (a 1031 exchange can defer both). Figures are a year-1 estimate at your 24.0% rate — not tax advice; consult a CPA.
Schools (NCES district)
- District
- Denton ISD
- NCES district ID
- 4816740
- Math proficiency
- 36% ▼ -18.00%
- Reading proficiency
- 43% ▼ -9.00%
- Median HH income
- $58,913
- Composite
- 34.91/100
- National rank
- #5075
- State rank
- #383 of 826 in TX
Livability — Denton
- Score
- 88/100
- State rank
- #2
- US rank
- #210
Category grades
Schools grade is shown separately in the Schools card above.
Census & demographics
- Census place
- Denton, TX
- County
- Denton County · 901,654 people
- City population
- 127,990
- Metro
- Dallas-Fort Worth-Arlington, TX
- Population (ZIP)
- 19,862
- Household income
- $85,330
- Rent vs Own
- Severe rent burden
- 611.0
Population outlook (Denton County) Hauer SSP2
- Today (2025)
- 1,053,010 people
- By 2030
- 1,192,269 · +13.2%
- By 2040
- 1,472,920 · +39.9%
- By 2050
- 1,746,506 · +65.9%
- By 2075
- 2,358,497 · +124.0%
- By 2100
- 2,779,183 · +163.9%
Race, ethnicity, and origin ACS 2023
- Neighborhood character
- Diverse neighborhood (Simpson 0.55)
- Race & ethnicity
- White 62% Hispanic / Latino 24% Two or more races 12% Black 7% Native American 1% Asian 1%
- Hispanic origin (detail)
- Mexican 18%
- Common ancestry
- Italian 5% Lithuanian 2% Romanian 2%
- Foreign-born
- 12% · Canada
- Languages at home
- 83% English-only · Spanish 15% Other Indo-European 1%
Political lean MEDSL · Denton
- 2024 margin
- R (+13.2) · D 42.7% · R 55.8% · Other 1.5%
- 2008→2024 swing
- +11.0pp toward D · 2008: -24.2pp · 2024: -13.2pp
- All cycles
- 2024: R+13.2 2020: R+8.1 2016: R+20.2 2012: R+31.7 2008: R+24.2
Not yet ingested
- Civics
- —
Market trends
- HPI YoY
- ▼ -83.77%
- Current HPI
- 220.3314
- Rent YoY
- ▼ -2.53%
- Metro
- Dallas-Fort Worth-Arlington, TX
- State GDP YoY
- ▲ 3.95%
- F500 in state
- 110
Industry mix (Fortune 500 HQ in TX)
| Industry | F500 HQs | Revenue |
|---|---|---|
| Energy | 16 | $1,198B |
|
||
| Technology | 5 | $198B |
|
||
| Engineering / Construction | 4 | $72B |
|
||
| Energy Services | 3 | $60B |
|
||
| Utilities | 3 | $41B |
|
||
| Healthcare | 2 | $330B |
|
||
Price history
-3.1% since first listed2 events — show timeline
- 2026-06-01 Price Changed $435,000 NTREIS
- 2026-05-11 Listed $449,000 NTREIS
Property tax history
+28.7%/yrLatest (2025): $1,175 · +12.0% YoY. Source: county tax records.
Cash-flow waterfall
monthlySold comps — $/sqft
last 12 mo · ≤1 miLoading sold comps…