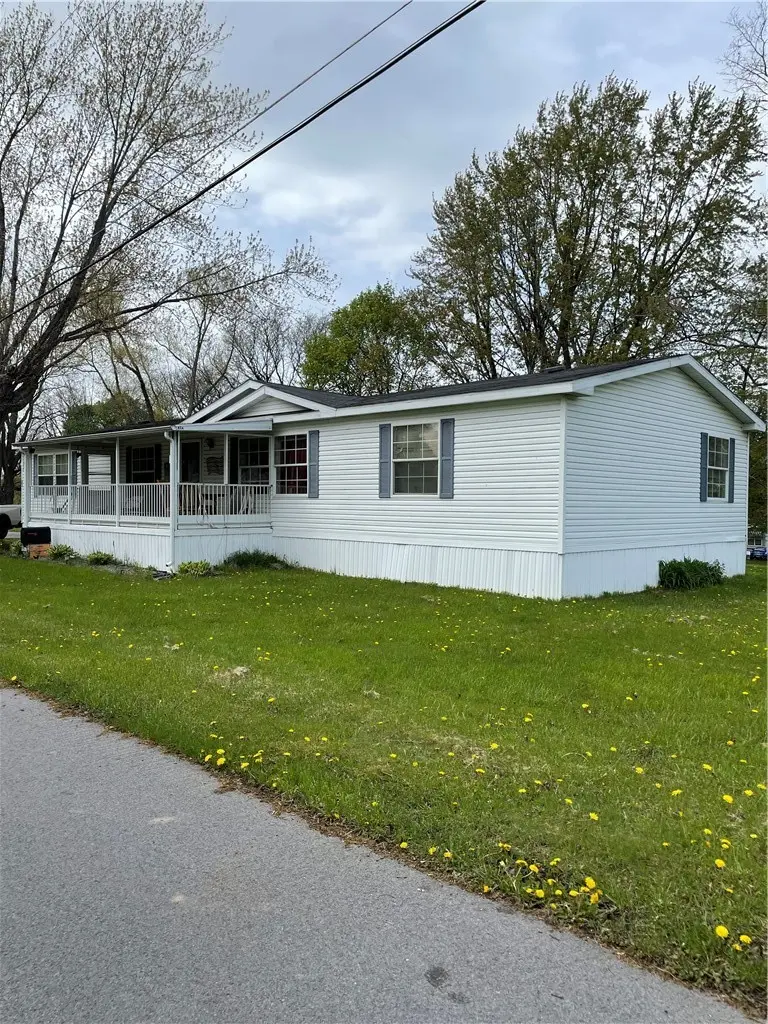
13 Crestline Dr · East Avon, NY
Flood risk 1/10 · Minimal
- FEMA flood zone
- —
- Chance of flooding over 30 yrs
- 0.0%
- Est. flood insurance / yr
- —
Fire risk 1/10 · Minimal
- Est. fire insurance / yr
- $691 – $1,283
Heat risk 2/10 · Minimal
- Hot days now (above 95°F)
- 7 days/yr
- Hot days in 30 yrs
- 15 days/yr
Wind risk 1/10 · Minimal
- Chance of severe wind over 30 yrs
- —
Air-quality risk 2/10 · Minimal
- Unhealthy air days now
- 0 days/yr
- Unhealthy air days in 30 yrs
- 1 days/yr
Risk factors via First Street. Map © Google.
Why this score? — see what drove the B grade
The composite is a weighted blend of 9 inputs, each scored 0–100. Each bar is that input's sub-score; the figure is the points it added to the 100-point composite (weight × sub-score).
- Cash flow +30.0/30.0
- 1% rule +10.0/10.0
- DSCR +10.0/10.0
- ARV discount +8.0/15.0
- Schools +4.5/10.0
- Livability +3.0/5.0
- Rent growth +2.5/5.0
- Condition / age +2.5/5.0
- Appreciation +0.0/10.0
$99,900
🖨 Deal sheet (PDF) 📄 Offer letter ✓ Due diligence
Listing remarks
Well kept home! If you're looking for space, this is it!! Open concept, split bedroom set up, primary bedroom with large walk in closet and ensuite, formal dining opens to large kitchen with island and many cupboards, loads of closets for plenty of storage, covered porch and shed for additional storage. Furnace, hot water tank, flooring and heat tape are all new. All appliances included! Home backs up to the Community Park and no close neighbors. Interested parties must apply to Twin Cedars for park approval.
Key facts
- Split bedroom set up
- Ensuite
- Formal dining
Tags
Property features AI
Finance
- Other: Leased propane tank
- Financial info: Has land lease (monthly land lease payment)
Exterior
- Parking: No garage; Driveway parking
- Utilities: Cable available; High-speed internet available; Public water (connected); Sewer connected; Circuit breaker electrical
- Home design: Single-story (1 story); Double-wide mobile home (Patriot); Resale property; City street frontage; Rectangular residential lot
- Construction: Vinyl siding; Asphalt roof; Shed(s)/storage
- Exterior features: Blacktop driveway; Propane tank (leased); Covered porch
Interior
- Kitchen: Kitchen island; Pantry; Electric oven; Electric range; Dishwasher; Refrigerator
- Bedrooms: 3 main-level bedrooms
- Flooring: Carpet; Ceramic tile; Laminate; Vinyl; Varies
- Bathrooms: 2 full bathrooms (both on the main level)
- Heating & cooling: Propane forced-air heating; Central air conditioning
- Interior features: Ceiling fan(s); Separate/formal dining room; Entrance foyer; Eat-in kitchen; Separate/formal living room; Jetted tub; Kitchen island; Pantry; Skylights; Main level primary; Primary suite; Bedroom on main level
- Laundry & utility: Main-level laundry; Washer; Dryer; Propane water heater
Neighborhood map
What this means for you Summary
Snapshot
- This is a 3-bed/2.0-bath single-family listed at $100k.
Deal economics
- At list price, monthly cash flow is $704 ($8k/yr) — positive.
- The deal already cash-flows at list — no discount required.
- Meets the 1% rule at list price ($2k rent vs $100k).
- Recommended offer: $97k (3.0% below list) — sets the bar for market timing.
Location & tenants
- Location reads 60/100 on livability (#1,004 in NY) — a middle-class / working-renter tenant base. Strengths: housing A+, employment A-, cost of living B; Watch: schools F, crime F, amenities F.
- Avon Central School District (town): math 53% / reading 50% proficiency, ranked #349 of 590 in NY (top 59%) — acceptable for families but not a draw, mixed tenant base, ~2y average lease.
- Market conditions: 37 active listings in the ZIP; 86 units permitted in Livingston County in 2024 (0 in 5+ unit buildings).
Forward outlook
- Local home prices are declining (-3.0%/yr); year-one equity from $691 of loan paydown is wiped out by about $3k of value loss. Plan a longer hold.
- Livingston County population projected at -13% by 2050 — secular population decline; favor cash flow + early exit over multi-decade hold.
- At projected returns (-3.0% appreciation + 3.0% rent growth), your $28k cash investment doubles in ~4 years — after that, you're playing with house money.
Negotiation context
- It's been on market 37 days — a 3% lower offer ($97k) is reasonable based on typical stale-listing flexibility.
- 4 sale attempts since 9y ago with the ask held roughly flat each time — persistent listings suggest the price (not the market) is what's stuck; bring a comps-based counter.
Questions for the listing agent
- It's been on market 37 days. Have you received any prior offers? Is the seller open to a 3% concession, seller financing, or rate buy-down credit?
- Is there a deadline driving the sale (1031 exchange, divorce, estate, relocation)? That informs how much negotiation room exists.
- Schools are F-rated, which usually means shorter tenancies and higher turnover. Who's the typical renter profile here, and what's been the actual vacancy rate?
- Crime grade is F in this area — have there been break-ins, vandalism, or insurance claims at this property in the last 3 years? What carrier currently insures it and at what premium?
- What's the average days-on-market for RENTAL listings here right now (not sales)? A rising rental-DOM trend means longer vacancies and softer asking-rent achievability than the comps imply.
- What's the recent tenant-quality profile in this submarket — average credit score on applications, eviction rate, late-payment / NSF rate, and stable-employment percentage? A property-management company in the area should have these aggregated.
- How much new for-sale + rental construction is in the pipeline within 1–3 miles? Heavy new supply typically softens prices + rents 12–24 months out; constrained supply supports both.
Investment metrics
- 1% rule
- 1.77% ✓
- Cap rate
- 14.75%
- Cash-on-cash
- 30.19%
- DSCR
- 2.34
- GRM
- 4.7
CMA / ARV
- ARV (median comp)
- $101,059
- List price
- $99,900
- Delta
- -1.15%
- Verdict
- FAIR
- Comps
- 2 within 1.0 mi
Projected returns pro-forma
-3.0% appreciation · 3.0% rent growth · sell at horizon
- IRR
- 24.8%
- Equity multiple
- 2.02×
- Total profit
- $28,660
- Equity at exit
- $14,895
- IRR
- 32.6%
- Equity multiple
- 3.96×
- Total profit
- $82,780
- Equity at exit
- $8,638
Cash invested: $27,972 (down + closing). Projections, not guarantees.
Landlord ↔ Tenant lean methodology
- Overall (STATE)
- 15 Strongly Tenant-Friendly
- State New York
- 15 Strongly Tenant-Friendly · D+10
- County
- — inherits STATE
- City
- — inherits STATE
ZIP-level market 14414
- Home prices YoY
- -14.1%
- Active inventory
- 37
- Price-to-rent
- 4.7×
Monthly cashflow live
- Estimated rent
- $1,765 medium interval (Pro) →
- Mortgage (P&I)
- −$524
- Tax est. 1.5%
- −$125 /mo · $1,498/yr
- Insurance
- −$42
- HOA
- −$0
- Vacancy / Maint / Mgmt
- −$371
- Net cashflow
- $704
Break-even live
Sensitivity live
| Price | -10% $773 | -5% $738 | +0% $704 | +5% $669 | +10% $635 |
|---|---|---|---|---|---|
| Rent | -10% $564 | -5% $634 | +0% $704 | +5% $773 | +10% $843 |
| Rate | -1.0pp $754 | -0.5pp $729 | base $704 | +0.5pp $678 | +1.0pp $652 |
UW: 25.0% down · 7.5% · 30yr · 1.5% tax · 5.0% vac · 8.0% maint · 8.0% mgmt
Financing live
Cash to close
- Down payment
- $24,975
- Closing costs
- $2,997
- Reserves months
- —
- Total cash needed
- —
Loan-product check · same deal, 3 products live
Conventional
25% down · 7.5% · 30yr
- Down + closing
- —
- Monthly P&I
- —
- Monthly cashflow
- —
- DSCR
- —
- Eligible?
- —
Personal DTI + credit; lowest rate.
DSCR
20% down · 8.5% · 30yr
- Down + closing
- —
- Monthly P&I
- —
- Monthly cashflow
- —
- DSCR
- —
- Eligible?
- —
No personal income docs; deal must DSCR.
Hard money
10% down · 12.0% · 12mo
- Down + closing
- —
- Monthly P&I
- —
- Monthly cashflow
- —
- DSCR
- —
- Eligible?
- —
Short-term bridge; refi at stabilization.
Listing history 21 events
-
2026-06-18days on market $99,900 Active 37 DOM
-
2026-06-17days on market $99,900 Active 36 DOM
-
2026-06-16days on market $99,900 Active 35 DOM
-
2026-06-15days on market $99,900 Active 34 DOM
-
2026-06-13days on market $99,900 Active 32 DOM
-
2026-06-13days on market $99,900 Active 31 DOM
-
2026-06-10days on market $99,900 Active 29 DOM
-
2026-06-09days on market $99,900 Active 28 DOM
-
2026-06-08days on market $99,900 Active 27 DOM
-
2026-06-07days on market $99,900 Active 26 DOM
-
2026-06-03days on market $99,900 Active 22 DOM
-
2026-06-03days on market $99,900 Active 21 DOM
-
2026-06-01days on market $99,900 Active 20 DOM
-
2026-05-31days on market $99,900 Active 19 DOM
-
2026-05-15status Pending 514-char remark
-
2026-05-04$99,900 Active 514-char remark
-
2020-07-19historical
-
2020-07-17price $59,900
-
2020-07-09$65,000 Active
-
2018-04-22historical
-
2017-04-23$63,900 Active
ⓘ Source: listings_history table (triggers on properties + properties_extension) + one-shot
backfill from property_details.listing_events for pre-trigger history.
Climate risk First Street
- Flood 1/10 Low 0% chance over 30 yrs
- Wildfire 1/10 Low
- Heat 2/10 Low 7 d/yr ≥95°F today · 15 d/yr by 30 yrs out
- Wind 1/10 Low
- Air quality 2/10 Low 0 unhealthy d/yr today · 1 by 30 yrs out
Nearby sold comps map
Loading sold comps map…
Walkable amenities ~0.75 mi
Loading nearby amenities…
Taxation est. · year 1
- Rental income
- $21,177
- − Mortgage interest
- −$5,596
- − Property taxes
- −$1,498
- − Insurance
- −$500
- − Repairs & maintenance
- −$1,694
- − Management
- −$1,694
- − Depreciation
- −$2,906
- Taxable income
- $7,288
- Est. tax owed @ 24.0%
- −$1,749
- After-tax cash flow
- $6,696/yr
For passive investors: Depreciation is non-cash, so a rental often shows a tax loss while cash-flowing — sheltering income. Rental losses are passive: they offset passive income freely, and up to $25,000/yr can offset ordinary (W-2) income if you actively participate and your MAGI is under $100k (phasing out to $0 by $150k); unused losses carry forward. On sale, claimed depreciation is recaptured at up to 25%, and gains may owe capital-gains tax (a 1031 exchange can defer both). Figures are a year-1 estimate at your 24.0% rate — not tax advice; consult a CPA.
Schools (NCES district)
- District
- Avon Central School District
- NCES district ID
- 3603660
- Math proficiency
- 53% ▬ 0.00%
- Reading proficiency
- 50% ▲ 12.00%
- Median HH income
- $55,407
- Composite
- 44.56/100
- National rank
- #2786
- State rank
- #349 of 590 in NY
Livability — East Avon
- Score
- 60/100
- State rank
- #1004
- US rank
- #19541
Category grades
Schools grade is shown separately in the Schools card above.
Census & demographics
- County
- Livingston County · 6,576 people
- Metro
- Rochester, NY
- Population (ZIP)
- 6,576
- Household income
- $72,006
- Rent vs Own
- Severe rent burden
- 100.0
Population outlook (Livingston County) Hauer SSP2
- Today (2025)
- 63,466 people
- By 2030
- 61,966 · -2.4%
- By 2040
- 58,398 · -8.0%
- By 2050
- 54,955 · -13.4%
- By 2075
- 49,958 · -21.3%
- By 2100
- 43,944 · -30.8%
Race, ethnicity, and origin ACS 2023
- Neighborhood character
- Predominantly White (92%)
- Race & ethnicity
- White 92% Two or more races 4% Hispanic / Latino 2% Black 1%
- Common ancestry
- Romanian 6% Italian 4% Lithuanian 2%
- Foreign-born
- 2% · China, Canada
- Languages at home
- 98% English-only · Spanish 1%
Political lean MEDSL · Livingston
- 2024 margin
- Strong R (+21.4) · D 39.3% · R 60.7%
- 2008→2024 swing
- -13.6pp toward R · 2008: -7.9pp · 2024: -21.4pp
- All cycles
- 2024: R+21.4 2020: R+18.2 2016: R+27.8 2012: R+9.4 2008: R+7.9
Not yet ingested
- Civics
- —
Market trends
- HPI YoY
- ▼ -40.57%
- Current HPI
- 247.7027
- Rent YoY
- —
- Metro
- Rochester, NY
- State GDP YoY
- ▲ 2.60%
- F500 in state
- 92
Industry mix (Fortune 500 HQ in NY)
| Industry | F500 HQs | Revenue |
|---|---|---|
| Financial Services | 10 | $950B |
|
||
| Consumer Goods | 9 | $162B |
|
||
| Insurance | 4 | $225B |
|
||
| Telecommunications | 2 | $144B |
|
||
| Pharmaceuticals | 2 | $112B |
|
||
| Media / Entertainment | 2 | $69B |
|
||
Price history
+56.3% since first listed8 events — show timeline
- 2026-05-22 Relisted — UNYREIS
- 2026-05-15 Pending — UNYREIS
- 2026-05-04 Listed $99,900 UNYREIS
- 2020-07-19 Listing Removed — CNYIS
- 2020-07-17 Price Changed $59,900 CNYIS
- 2020-07-09 Listed $65,000 CNYIS
- 2018-04-22 Listing Removed — UNYREIS
- 2017-04-23 Listed $63,900 UNYREIS
Cash-flow waterfall
monthlySold comps — $/sqft
last 12 mo · ≤1 miLoading sold comps…