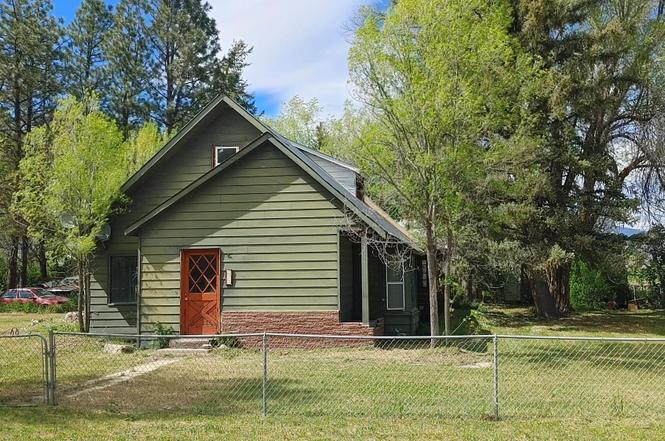
227 Alturas Ave · Fairfield, ID
Flood risk 4/10 · Minor
- FEMA flood zone
- —
- Chance of flooding over 30 yrs
- 0.27%
- Est. flood insurance / yr
- —
Fire risk 1/10 · Minimal
- Est. fire insurance / yr
- $584 – $1,086
Heat risk 2/10 · Minimal
- Hot days now (above 90°F)
- 6 days/yr
- Hot days in 30 yrs
- 15 days/yr
Wind risk 1/10 · Minimal
- Chance of severe wind over 30 yrs
- —
Air-quality risk 8/10 · Major
- Unhealthy air days now
- 16 days/yr
- Unhealthy air days in 30 yrs
- 18 days/yr
Risk factors via First Street. Map © Google.
Why this score? — see what drove the C+ grade
The composite is a weighted blend of 9 inputs, each scored 0–100. Each bar is that input's sub-score; the figure is the points it added to the 100-point composite (weight × sub-score).
- Cash flow +21.0/30.0
- Appreciation +9.5/10.0
- ARV discount +7.5/15.0
- DSCR +6.7/10.0
- 1% rule +4.7/10.0
- Schools +4.0/10.0
- Livability +3.4/5.0
- Rent growth +2.5/5.0
- Condition / age +2.5/5.0
$150,000
🖨 Deal sheet (PDF) 📄 Offer letter ✓ Due diligence
Listing remarks MLS
THIS PROPERTY HAS A STRUCTURE ON THE PROPERTY AND A LARGE SHOP/SHED AND GARAGE. HOME IS NOT HABITABLE. 3 BUILDABLE LOTS. DO YOU NEED STORAGE. BACK BUILDING HAS MULTIPLE ROOMS
Key facts
- 3 lots
- Soldier ski lift
- Fire pit
Tags
Property features AI
Exterior
- Parking: Detached 2-car garage; 2 covered parking spaces
- Home design: Single family residence; Built in 1929
- Construction: Frame construction with metal siding; Crawl space foundation
- Exterior features: Wire fencing; Approximately 10,000 sq. ft. lot (~0.49 acre)
Interior
- Bedrooms: 4 bedrooms (2 on the main level, 2 on the upper level)
- Bathrooms: 1 bathroom
- Heating & cooling: No central heating noted; No central cooling noted
- Interior features: Wood burning stove fireplace
Neighborhood map
What this means for you Summary
Snapshot
- This is a 4-bed/1.0-bath other listed at $150k.
Deal economics
- At list price, monthly cash flow is $211 ($3k/yr) — positive.
- The deal already cash-flows at list — no discount required.
- To meet the 1% rule (rent ≥ 1% of price), the offer needs to be $146k (2.6% below list).
- Recommended offer: $146k (2.6% below list) — sets the bar for 1% rule.
Location & tenants
- Location reads 67/100 on livability (#101 in ID) — a middle-class / working-renter tenant base. Strengths: cost of living A+, housing A+, health & safety A+; Watch: amenities F, commute F, employment F.
- Camas County District (rural): math 40% / reading 50% proficiency, ranked #71 of 133 in ID (top 53%) — families likely to look elsewhere, expect single-tenant / working-renter base with shorter leases.
- Zoned schools: Camas County Elem/Jr High School (math 32% / reading 42%, grade F, #255 of 357 statewide, top 74%, 119 students, 35% FRL); Camas County High School (math 24% / reading 75%, grade D+, #40 of 169 statewide, top 26%, 65 students, 26% FRL) — zoned schools at 31% FRL track the district average.
- Market conditions: 65 active listings in the ZIP; 23 units permitted in Camas County in 2024 (0 in 5+ unit buildings).
Forward outlook
- In year one you build about $15k of equity ($1k loan paydown + $14k appreciation (9.1% local appreciation)).
- Camas County population projected at -33% by 2050 — secular population decline; favor cash flow + early exit over multi-decade hold.
- At projected returns (9.1% appreciation + 3.0% rent growth), your $42k cash investment doubles in ~3 years — after that, you're playing with house money.
- By year 3, paydown + projected appreciation supports a ~$37k cash-out refi (75% LTV) — recoverable capital for the next deal without selling this one.
Negotiation context
- Only 10 days on market — expect competitive offers; lowballing is unlikely to land.
- 3 sale attempts since 19y ago with the ask held roughly flat each time — persistent listings suggest the price (not the market) is what's stuck; bring a comps-based counter.
Risks & watch-outs
- Watch-outs: built in 1929 — expect roof / HVAC / electrical / plumbing capex.
Questions for the listing agent
- Built in 1929 — when were the roof, HVAC, electrical panel, plumbing, and water heater last replaced?
- Is there a deadline driving the sale (1031 exchange, divorce, estate, relocation)? That informs how much negotiation room exists.
- What's the average days-on-market for RENTAL listings here right now (not sales)? A rising rental-DOM trend means longer vacancies and softer asking-rent achievability than the comps imply.
- What's the recent tenant-quality profile in this submarket — average credit score on applications, eviction rate, late-payment / NSF rate, and stable-employment percentage? A property-management company in the area should have these aggregated.
- How much new for-sale + rental construction is in the pipeline within 1–3 miles? Heavy new supply typically softens prices + rents 12–24 months out; constrained supply supports both.
Investment metrics
- 1% rule
- 0.97% ✗
- Cap rate
- 7.98%
- Cash-on-cash
- 6.03%
- DSCR
- 1.27
- GRM
- 8.6
CMA / ARV
No comps found within radius.
Projected returns pro-forma
9.06% appreciation · 3.0% rent growth · sell at horizon
- IRR
- 26.8%
- Equity multiple
- 3.04×
- Total profit
- $85,535
- Equity at exit
- $124,958
- IRR
- 23.7%
- Equity multiple
- 6.70×
- Total profit
- $239,255
- Equity at exit
- $259,338
Cash invested: $42,000 (down + closing). Projections, not guarantees.
Landlord ↔ Tenant lean methodology
- Overall (STATE)
- 91 Strongly Landlord-Friendly
- State Idaho
- 91 Strongly Landlord-Friendly · R+18
- County
- — inherits STATE
- City
- — inherits STATE
ZIP-level market 83327
- Home prices YoY
- 3.8%
- Active inventory
- 65
- Price-to-rent
- 8.6×
Monthly cashflow live
- Estimated rent
- $1,460 medium interval (Pro) →
- Mortgage (P&I)
- −$787
- Tax from tax record
- −$94 /mo · $1,124/yr
- Insurance
- −$62
- HOA
- −$0
- Vacancy / Maint / Mgmt
- −$307
- Net cashflow
- $211
Break-even live
Sensitivity live
| Price | -10% $296 | -5% $253 | +0% $211 | +5% $169 | +10% $126 |
|---|---|---|---|---|---|
| Rent | -10% $96 | -5% $153 | +0% $211 | +5% $269 | +10% $326 |
| Rate | -1.0pp $287 | -0.5pp $249 | base $211 | +0.5pp $172 | +1.0pp $133 |
UW: 25.0% down · 7.5% · 30yr · 1.5% tax · 5.0% vac · 8.0% maint · 8.0% mgmt
Financing live
Cash to close
- Down payment
- $37,500
- Closing costs
- $4,500
- Reserves months
- —
- Total cash needed
- —
Loan-product check · same deal, 3 products live
Conventional
25% down · 7.5% · 30yr
- Down + closing
- —
- Monthly P&I
- —
- Monthly cashflow
- —
- DSCR
- —
- Eligible?
- —
Personal DTI + credit; lowest rate.
DSCR
20% down · 8.5% · 30yr
- Down + closing
- —
- Monthly P&I
- —
- Monthly cashflow
- —
- DSCR
- —
- Eligible?
- —
No personal income docs; deal must DSCR.
Hard money
10% down · 12.0% · 12mo
- Down + closing
- —
- Monthly P&I
- —
- Monthly cashflow
- —
- DSCR
- —
- Eligible?
- —
Short-term bridge; refi at stabilization.
Listing history 6 events
-
2026-06-19days on market $150,000 Active 10 DOM
-
2026-06-18days on market $150,000 Active 9 DOM
-
2026-06-17days on market $150,000 Active 8 DOM
-
2026-06-16days on market $150,000 Active 7 DOM
-
2026-06-16remarks 241-char remark
-
2026-06-16$150,000 Active 6 DOM
ⓘ Source: listings_history table (triggers on properties + properties_extension) + one-shot
backfill from property_details.listing_events for pre-trigger history.
Tax reassessment forecast ID · Resets to sale price
- Current annual tax
- $1,124 · $94/mo
- Projected year-2 tax
- $1,124 · $94/mo
- Expected delta
- $0/yr ($0/mo · 0.0%)
ⓘ Screening estimate from a state-policy table — verify with the county assessor before closing.
Climate risk First Street
- Flood 4/10 Moderate 27% chance over 30 yrs
- Wildfire 1/10 Low
- Heat 2/10 Low 6 d/yr ≥90°F today · 15 d/yr by 30 yrs out
- Wind 1/10 Low
- Air quality 8/10 Severe 16 unhealthy d/yr today · 18 by 30 yrs out
Nearby sold comps map
Loading sold comps map…
Walkable amenities ~0.75 mi
Loading nearby amenities…
Taxation est. · year 1
- Rental income
- $17,526
- − Mortgage interest
- −$8,402
- − Property taxes
- −$1,124
- − Insurance
- −$750
- − Repairs & maintenance
- −$1,402
- − Management
- −$1,402
- − Depreciation
- −$4,364
- Taxable income
- $82
- Est. tax owed @ 24.0%
- −$20
- After-tax cash flow
- $2,513/yr
For passive investors: Depreciation is non-cash, so a rental often shows a tax loss while cash-flowing — sheltering income. Rental losses are passive: they offset passive income freely, and up to $25,000/yr can offset ordinary (W-2) income if you actively participate and your MAGI is under $100k (phasing out to $0 by $150k); unused losses carry forward. On sale, claimed depreciation is recaptured at up to 25%, and gains may owe capital-gains tax (a 1031 exchange can defer both). Figures are a year-1 estimate at your 24.0% rate — not tax advice; consult a CPA.
Schools (NCES district)
- District
- Camas County District
- NCES district ID
- 1600540
- Math proficiency
- 40% ▲ 10.00%
- Reading proficiency
- 50% ▼ -5.00%
- Median HH income
- $41,939
- Composite
- 40.07/100
- National rank
- #7868
- State rank
- #71 of 133 in ID
Livability — Fairfield
- Score
- 67/100
- State rank
- #101
- US rank
- #10915
Category grades
Schools grade is shown separately in the Schools card above.
Census & demographics
- Census place
- Fairfield, ID
- Population (ZIP)
- 1,047
Population outlook (Camas County) Hauer SSP2
- Today (2025)
- 988 people
- By 2030
- 898 · -9.1%
- By 2040
- 745 · -24.6%
- By 2050
- 661 · -33.1%
- By 2075
- 637 · -35.5%
- By 2100
- 750 · -24.1%
Race, ethnicity, and origin ACS 2023
- Neighborhood character
- Predominantly White (74%)
- Race & ethnicity
- White 74% Two or more races 16% Hispanic / Latino 16% Native American 2%
- Hispanic origin (detail)
- Mexican 9%
- Common ancestry
- Slovak 2% Italian 1% Romanian 1%
- Foreign-born
- 0% · Canada
- Languages at home
- 94% English-only · Spanish 6% Other Indo-European 1%
Political lean MEDSL · Camas
- 2024 margin
- Solid R (+54.1) · D 21.0% · R 75.1% · Other 3.9%
- 2008→2024 swing
- -16.1pp toward R · 2008: -38.0pp · 2024: -54.1pp
- All cycles
- 2024: R+54.1 2020: R+47.5 2016: R+50.1 2012: R+42.0 2008: R+38.0
Not yet ingested
- Civics
- —
Market trends
- HPI YoY
- ▲ 9.06%
- Current HPI
- 245.5011
- Rent YoY
- —
- Metro
- —
- State GDP YoY
- ▲ 4.51%
- F500 in state
- 6
Industry mix (Fortune 500 HQ in ID)
| Industry | F500 HQs | Revenue |
|---|---|---|
| Retail | 1 | $79B |
|
||
| Technology | 1 | $25B |
|
||
| Food / Agriculture | 1 | $6B |
|
||
Price history
+106.9% since first listed7 events — show timeline
- 2026-06-09 Listed $150,000 IMLS
- 2012-03-30 Sold (MLS) — SVBOR
- 2012-03-29 Sold (Public Records) — Public Records
- 2012-01-11 Listed $13,900 SVBOR
- 2007-05-29 Sold (MLS) — IMLS
- 2007-04-18 Listed $72,500 IMLS
- 2005-11-23 Sold (Public Records) — Public Records
Property tax history
+3.6%/yrLatest (2025): $1,124 · -4.9% YoY. Source: county tax records.
Cash-flow waterfall
monthlySold comps — $/sqft
last 12 mo · ≤1 miLoading sold comps…