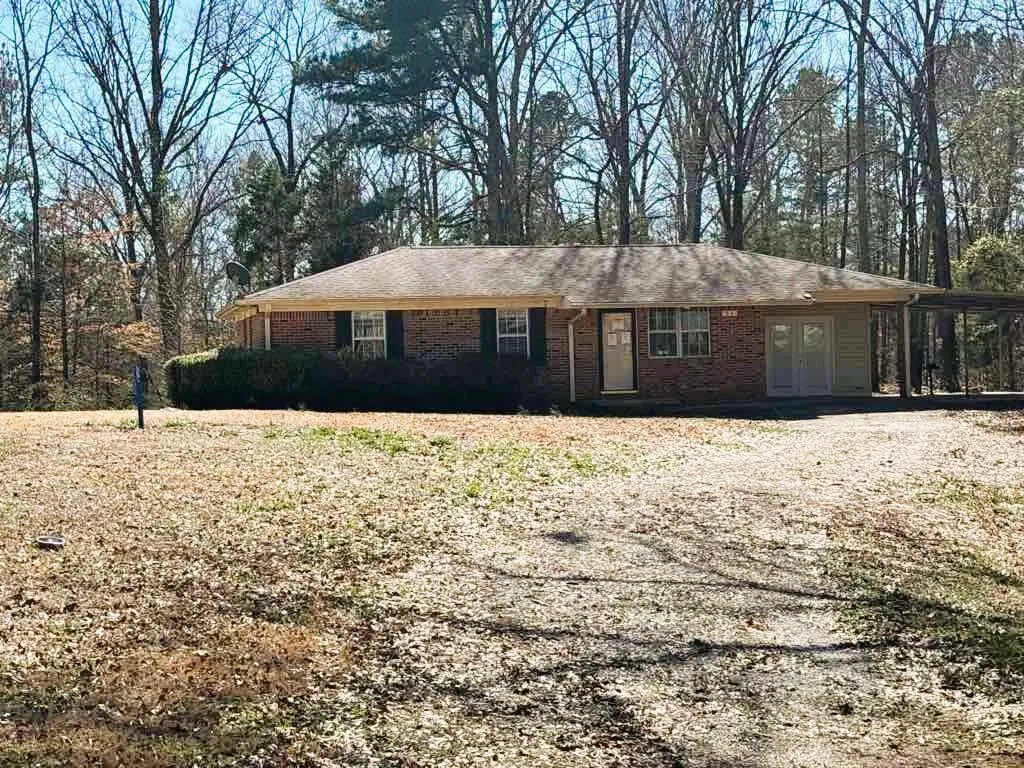
56 Water Tank Dr · Tremont, MS
Flood risk 1/10 · Minimal
- FEMA flood zone
- X (unshaded)
- Chance of flooding over 30 yrs
- 0.0%
- Est. flood insurance / yr
- $507 – $1,088
Fire risk 4/10 · Minor
- Est. fire insurance / yr
- $1,241 – $2,305
Heat risk 6/10 · Moderate
- Hot days now (above 108°F)
- 7 days/yr
- Hot days in 30 yrs
- 20 days/yr
Wind risk 6/10 · Moderate
- Chance of severe wind over 30 yrs
- 27.0%
Air-quality risk 1/10 · Minimal
- Unhealthy air days now
- 0 days/yr
- Unhealthy air days in 30 yrs
- 0 days/yr
Risk factors via First Street. Map © Google.
Why this score? — see what drove the B+ grade
The composite is a weighted blend of 9 inputs, each scored 0–100. Each bar is that input's sub-score; the figure is the points it added to the 100-point composite (weight × sub-score).
- Cash flow +30.0/30.0
- 1% rule +10.0/10.0
- DSCR +10.0/10.0
- Appreciation +8.9/10.0
- ARV discount +7.5/15.0
- Livability +3.1/5.0
- Schools +2.7/10.0
- Rent growth +2.5/5.0
- Condition / age +2.5/5.0
$54,200
🖨 Deal sheet 📄 Offer letter ✓ Due diligence
Listing remarks MLS
US Dept. of HUD Owned. Case#281-489902. Equal Housing Opportunity. Sold As-Is. 3 bed/ 1 bath situated on a . 50 acre lot. Insured Escrow IE, 203K eligible, Subject to FHA Appraisal. Lead Base Paint addendum required. Buyers select closing Agent/Firm. Seller may contribute up to 3% for buyers closing costs upon buyer request. Buyers are responsible for verifying all square footage, taxes & schools before making an offer . Seller and seller's agents make no representations or warranties as to property condition.
Key facts
- 0.5 acre lot
- Built 1976
- Listed 86 days
Neighborhood map
What this means for you Summary
Snapshot
- This is a 3-bed/1.5-bath other listed at $54k.
Deal economics
- At list price, monthly cash flow is $318 ($4k/yr) — positive.
- The deal already cash-flows at list — no discount required.
- Meets the 1% rule at list price ($969 rent vs $54k).
- Recommended offer: $51k (6.0% below list) — sets the bar for market timing.
Location & tenants
- Location reads 62/100 on livability (#180 in MS) — a middle-class / working-renter tenant base. Strengths: cost of living A+, housing A+, crime B; Watch: schools D-, amenities F, commute F.
- Itawamba County School District (rural): math 35% / reading 31% proficiency, ranked #58 of 130 in MS (top 45%) — families likely to look elsewhere, expect single-tenant / working-renter base with shorter leases.
- Market conditions: 5 active listings in the ZIP; 4 units permitted in Itawamba County in 2024 (0 in 5+ unit buildings).
Forward outlook
- In year one you build about $5k of equity ($375 loan paydown + $4k appreciation (7.8% local appreciation)).
- Itawamba County population projected to shrink 4% by 2050 — rents likely to lag national; underwrite the cash flow, not the appreciation.
- At projected returns (7.8% appreciation + 3.0% rent growth), your $15k cash investment doubles in ~2 years — after that, you're playing with house money.
- By year 7, paydown + projected appreciation supports a ~$31k cash-out refi (75% LTV) — recoverable capital for the next deal without selling this one.
Negotiation context
- It's been on market 86 days — a 6% lower offer ($51k) is reasonable based on typical stale-listing flexibility.
- 3 sale attempts since 11y ago; this cycle's ask has dropped $31k (36%) from the opening price — seller is motivated, your offer sets the floor, not the list.
Risks & watch-outs
- Watch-outs: property tax is 3.1% of price.
- Climate carrying-cost: major wind risk, 27% chance of damaging wind over 30y; extreme-heat days projected 7→20/yr by 2055 (HVAC capex compounding) — expect insurance premiums to compound above CPI over the hold.
Questions for the listing agent
- It's been on market 86 days. Have you received any prior offers? Is the seller open to a 6% concession, seller financing, or rate buy-down credit?
- Built in 1976 — when were the roof, HVAC, electrical panel, plumbing, and water heater last replaced?
- Property tax is high relative to price — has the assessment been appealed recently, and will the sale trigger a re-assessment?
- Why hasn't it sold? Are there any deal-killer items the seller is aware of (foundation, flood, title, zoning, code violations)?
- Is there a deadline driving the sale (1031 exchange, divorce, estate, relocation)? That informs how much negotiation room exists.
- Schools are D-rated, which usually means shorter tenancies and higher turnover. Who's the typical renter profile here, and what's been the actual vacancy rate?
- What's the average days-on-market for RENTAL listings here right now (not sales)? A rising rental-DOM trend means longer vacancies and softer asking-rent achievability than the comps imply.
- What's the recent tenant-quality profile in this submarket — average credit score on applications, eviction rate, late-payment / NSF rate, and stable-employment percentage? A property-management company in the area should have these aggregated.
- How much new for-sale + rental construction is in the pipeline within 1–3 miles? Heavy new supply typically softens prices + rents 12–24 months out; constrained supply supports both.
Investment metrics
- 1% rule
- 1.79% ✓
- Cap rate
- 13.34%
- Cash-on-cash
- 25.18%
- DSCR
- 2.12
- GRM
- 4.7
CMA / ARV
No comps found within radius.
Projected returns pro-forma
7.76% appreciation · 3.0% rent growth · sell at horizon
- IRR
- 39.6%
- Equity multiple
- 3.76×
- Total profit
- $41,827
- Equity at exit
- $40,279
- IRR
- 35.5%
- Equity multiple
- 8.01×
- Total profit
- $106,388
- Equity at exit
- $79,113
Cash invested: $15,176 (down + closing). Projections, not guarantees.
Landlord ↔ Tenant lean methodology
- Overall (STATE)
- 90 Strongly Landlord-Friendly
- State Mississippi
- 90 Strongly Landlord-Friendly · R+11
- County
- — inherits STATE
- City
- — inherits STATE
ZIP-level market 38876
- Home prices YoY
- 7.9%
- Active inventory
- 5
- Price-to-rent
- 4.7×
Monthly cashflow live
- Estimated rent
- $969 medium interval (Pro) →
- Mortgage (P&I)
- −$284
- Tax from tax record
- −$141 /mo · $1,687/yr
- Insurance
- −$23
- HOA
- −$0
- Vacancy / Maint / Mgmt
- −$204
- Net cashflow
- $318
Break-even live
UW: 25.0% down · 7.5% · 30yr · 1.5% tax · 5.0% vac · 8.0% maint · 8.0% mgmt
Financing live
Cash to close
- Down payment
- $13,550
- Closing costs
- $1,626
- Reserves months
- —
- Total cash needed
- —
Loan-product check · same deal, 3 products live
Conventional
25% down · 7.5% · 30yr
- Down + closing
- —
- Monthly P&I
- —
- Monthly cashflow
- —
- DSCR
- —
- Eligible?
- —
Personal DTI + credit; lowest rate.
DSCR
20% down · 8.5% · 30yr
- Down + closing
- —
- Monthly P&I
- —
- Monthly cashflow
- —
- DSCR
- —
- Eligible?
- —
No personal income docs; deal must DSCR.
Hard money
10% down · 12.0% · 12mo
- Down + closing
- —
- Monthly P&I
- —
- Monthly cashflow
- —
- DSCR
- —
- Eligible?
- —
Short-term bridge; refi at stabilization.
Listing history 13 events
-
2026-06-05statusdays on market $54,200 Pending 86 DOM
-
2026-06-03price $54,200 Active 85 DOM
-
2026-06-02days on market $61,000 Active 85 DOM
-
2026-06-01days on market $61,000 Active 84 DOM
-
2026-05-31days on market $61,000 Active 83 DOM
-
2026-05-30days on market $61,000 Active 82 DOM
-
2026-04-28price $61,000 521-char remark
Show marketing remark (521 chars)
US Dept. of HUD Owned. Case#281-489902. Equal Housing Opportunity. Sold As-Is. 3 bed/ 1 bath situated on a . 50 acre lot. Insured Escrow IE, 203K eligible, Subject to FHA Appraisal. Lead Base Paint addendum required. Buyers select closing Agent/Firm. Seller may contribute up to 3% for buyers closing costs upon buyer request. Buyers are responsible for verifying all square footage, taxes & schools before making an offer . Seller and seller's agents make no representations or warranties as to property condition.
-
2026-03-28price $72,000 521-char remark
Show marketing remark (521 chars)
US Dept. of HUD Owned. Case#281-489902. Equal Housing Opportunity. Sold As-Is. 3 bed/ 1 bath situated on a . 50 acre lot. Insured Escrow IE, 203K eligible, Subject to FHA Appraisal. Lead Base Paint addendum required. Buyers select closing Agent/Firm. Seller may contribute up to 3% for buyers closing costs upon buyer request. Buyers are responsible for verifying all square footage, taxes & schools before making an offer . Seller and seller's agents make no representations or warranties as to property condition.
-
2026-03-06$85,000 Active 521-char remark
Show marketing remark (521 chars)
US Dept. of HUD Owned. Case#281-489902. Equal Housing Opportunity. Sold As-Is. 3 bed/ 1 bath situated on a . 50 acre lot. Insured Escrow IE, 203K eligible, Subject to FHA Appraisal. Lead Base Paint addendum required. Buyers select closing Agent/Firm. Seller may contribute up to 3% for buyers closing costs upon buyer request. Buyers are responsible for verifying all square footage, taxes & schools before making an offer . Seller and seller's agents make no representations or warranties as to property condition.
-
2019-11-08soldstatus 338-char remark
Show marketing remark (338 chars)
Talk about move in ready! This 3br/2ba home located next to Tremont School is ideal for those looking to downsize or just starting out. This 1200sqft brick home sits on 1/2 an acre, has an attached double carport, sunroom/bonus room and comes with all appliances. New paint and flooring just installed! All info subject to verification.
-
2019-05-20$84,900 338-char remark
Show marketing remark (338 chars)
Talk about move in ready! This 3br/2ba home located next to Tremont School is ideal for those looking to downsize or just starting out. This 1200sqft brick home sits on 1/2 an acre, has an attached double carport, sunroom/bonus room and comes with all appliances. New paint and flooring just installed! All info subject to verification.
-
2015-07-09soldstatus
-
2015-04-29$69,900
ⓘ Source: listings_history table (triggers on properties + properties_extension) + one-shot
backfill from property_details.listing_events for pre-trigger history.
Tax reassessment forecast MS · Resets to sale price
- Current annual tax
- $1,687 · $141/mo
- Projected year-2 tax
- $1,687 · $141/mo
- Expected delta
- $0/yr ($0/mo · 0.0%)
ⓘ Screening estimate from a state-policy table — verify with the county assessor before closing.
Climate risk First Street
- Flood 1/10 Low FEMA zone X (unshaded) · 0% chance over 30 yrs
- Wildfire 4/10 Moderate
- Heat 6/10 Major 7 d/yr ≥108°F today · 20 d/yr by 30 yrs out
- Wind 6/10 Major 27% chance of damaging wind over 30 yrs
- Air quality 1/10 Low 0 unhealthy d/yr today · 0 by 30 yrs out
Nearby sold comps map
Loading sold comps map…
Walkable amenities ~0.75 mi
Loading nearby amenities…
Taxation est. · year 1
- Rental income
- $11,633
- − Mortgage interest
- −$3,036
- − Property taxes
- −$1,687
- − Insurance
- −$271
- − Repairs & maintenance
- −$931
- − Management
- −$931
- − Depreciation
- −$1,577
- Taxable income
- $3,201
- Est. tax owed @ 24.0%
- −$768
- After-tax cash flow
- $3,053/yr
For passive investors: Depreciation is non-cash, so a rental often shows a tax loss while cash-flowing — sheltering income. Rental losses are passive: they offset passive income freely, and up to $25,000/yr can offset ordinary (W-2) income if you actively participate and your MAGI is under $100k (phasing out to $0 by $150k); unused losses carry forward. On sale, claimed depreciation is recaptured at up to 25%, and gains may owe capital-gains tax (a 1031 exchange can defer both). Figures are a year-1 estimate at your 24.0% rate — not tax advice; consult a CPA.
Schools (NCES district)
- District
- Itawamba County School District
- NCES district ID
- 2802100
- Math proficiency
- 35% ▼ -19.00%
- Reading proficiency
- 31% ▼ -14.00%
- Median HH income
- $37,158
- Composite
- 27.48/100
- National rank
- #6956
- State rank
- #58 of 130 in MS
Livability — Tremont
- Score
- 62/100
- State rank
- #180
- US rank
- #16869
Category grades
Schools grade is shown separately in the Schools card above.
Census & demographics
- Census place
- Tremont, MS
- Population (ZIP)
- 1,168
Population outlook (Itawamba County) Hauer SSP2
- Today (2025)
- 24,011 people
- By 2030
- 23,999 · +-0.0%
- By 2040
- 23,738 · -1.1%
- By 2050
- 22,962 · -4.4%
- By 2075
- 20,240 · -15.7%
- By 2100
- 16,503 · -31.3%
Race, ethnicity, and origin ACS 2023
- Neighborhood character
- Predominantly White (100%)
- Race & ethnicity
- White 100%
- Common ancestry
- Italian 5% Slovak 2%
Political lean MEDSL · Itawamba
- 2024 margin
- Solid R (+80.0) · D 9.7% · R 89.7%
- 2008→2024 swing
- -23.9pp toward R · 2008: -56.1pp · 2024: -80.0pp
- All cycles
- 2024: R+80.0 2020: R+75.6 2016: R+75.6 2012: R+61.0 2008: R+56.1
Not yet ingested
- Civics
- —
Market trends
- HPI YoY
- ▲ 7.76%
- Current HPI
- 106.2474
- Rent YoY
- —
- Metro
- —
- State GDP YoY
- —
- F500 in state
- 0
Price history
-12.7% since first listed7 events — show timeline
- 2026-04-28 Price Changed $61,000 NEMSBD
- 2026-03-28 Price Changed $72,000 NEMSBD
- 2026-03-06 Listed $85,000 NEMSBD
- 2019-11-08 Sold (MLS) — NEMSBD
- 2019-05-20 Listed $84,900 NEMSBD
- 2015-07-09 Sold (MLS) — NEMSBD
- 2015-04-29 Listed $69,900 NEMSBD
Property tax history
+15.7%/yrLatest (2025): $1,687 · +107.1% YoY. Source: county tax records.
Cash-flow waterfall
monthlySold comps — $/sqft
last 12 mo · ≤1 miLoading sold comps…