10348 Hwy 90 W · Del Rio, TX
Flood risk 1/10 · Minimal
- FEMA flood zone
- X (unshaded)
- Chance of flooding over 30 yrs
- 0.0%
- Est. flood insurance / yr
- $507 – $1,088
Fire risk 5/10 · Moderate
- Est. fire insurance / yr
- $1,222 – $2,270
Heat risk 8/10 · Major
- Hot days now (above 108°F)
- 7 days/yr
- Hot days in 30 yrs
- 24 days/yr
Wind risk 4/10 · Minor
- Chance of severe wind over 30 yrs
- 17.0%
Air-quality risk 1/10 · Minimal
- Unhealthy air days now
- 0 days/yr
- Unhealthy air days in 30 yrs
- 0 days/yr
Risk factors via First Street. Map © Google.
Why this score? — see what drove the B- grade
The composite is a weighted blend of 9 inputs, each scored 0–100. Each bar is that input's sub-score; the figure is the points it added to the 100-point composite (weight × sub-score).
- Cash flow +30.0/30.0
- 1% rule +10.0/10.0
- DSCR +10.0/10.0
- ARV discount +7.5/15.0
- Livability +3.5/5.0
- Rent growth +2.9/5.0
- Schools +2.4/10.0
- Condition / age +1.0/5.0
- Appreciation +0.0/10.0
$63,000
🖨 Deal sheet (PDF) 📄 Offer letter ✓ Due diligence
Listing remarks MLS
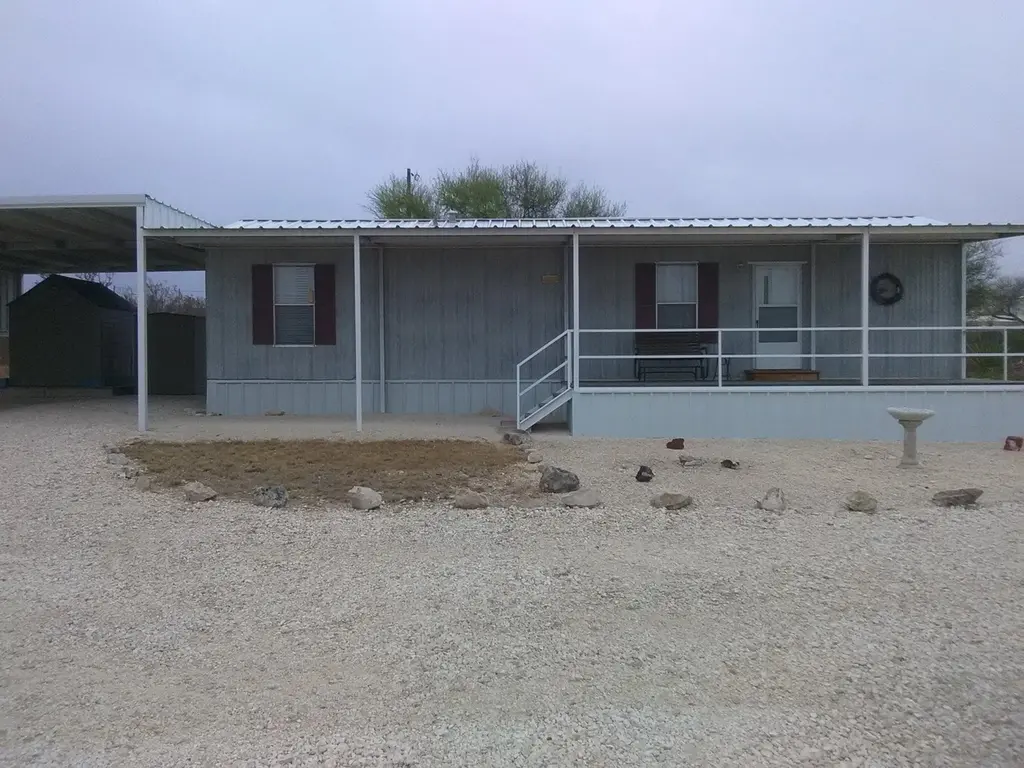
Discover the allure of lakeside living in this charming manufactured home nestled in the heart of American Campground, just across from the picturesque Lake Amistad. This well-maintained property boasts a covered parking space and an enclosed patio, creating the perfect setting for leisurely morning coffees. Featuring 2 bedrooms and 2 bathrooms in impeccable condition, this home is ideal for both fishing enthusiasts and lake lovers alike. Its prime location offers convenient access to the tranquil waters of Lake Amistad, making it a haven for those seeking a serene lakeside lifestyle. Enjoy the additional perks of on-site amenities, including a refreshing pool and clubhouse, enhancing the overall appeal of this delightful lakeside retreat.
Key facts
- Quiet and secluded
- Great views
- Well maintained
Tags
Property features AI
Finance
- HOA & community: Community clubhouse; Community pool
Exterior
- Parking: 2-car garage
- Utilities: Septic tank
- Home design: Residential mobile home
- Construction: Metal roof
- Exterior features: Deck; Patio; Located on a cul-de-sac
Interior
- Kitchen: Electric range; Refrigerator
- Flooring: Carpet; Vinyl
- Bathrooms: 1 full bathroom
- Heating & cooling: Central heating; Cooling via ceiling fan(s)
- Interior features: Ceiling fan(s); Electric water heater
Neighborhood map
What this means for you Summary
Snapshot
- This is a 2-bed/1.0-bath manufactured listed at $63k. Condition is rated poor.
Deal economics
- At list price, monthly cash flow is $400 ($5k/yr) — positive.
- The deal already cash-flows at list — no discount required.
- Meets the 1% rule at list price ($1k rent vs $63k).
Location & tenants
- Location reads 70/100 on livability (#349 in TX) — a middle-class / working-renter tenant base. Strengths: cost of living A+, housing A+, crime A-; Watch: health & safety C-, employment D+, amenities F.
- San Felipe-Del Rio CISD (town): math 25% / reading 32% proficiency, ranked #667 of 826 in TX (top 81%) — low school quality limits family demand, transient renter base, plan for 1-2y turnover; 70% free/reduced lunch — lower-income household profile, screen leases tightly.
- Zoned schools: Buena Vista El (math 30% / reading 38%, grade F, #2,149 of 4,322 statewide, top 50%, 792 students, 57% FRL).
- Market conditions: Rents rising (+1.6%/yr); 549 active listings in the ZIP; 85 units permitted in Val Verde County in 2024 (0 in 5+ unit buildings).
Forward outlook
- Local home prices are declining (-3.0%/yr); year-one equity from $436 of loan paydown is wiped out by about $2k of value loss. Plan a longer hold.
- Val Verde County population projected to shrink 9% by 2050 — rents likely to lag national; underwrite the cash flow, not the appreciation.
- At projected returns (-3.0% appreciation + 1.6% rent growth), your $18k cash investment doubles in ~5 years — after that, you're playing with house money.
Negotiation context
- Only 7 days on market — expect competitive offers; lowballing is unlikely to land.
- 4 sale attempts with the ask held roughly flat each time — persistent listings suggest the price (not the market) is what's stuck; bring a comps-based counter.
Risks & watch-outs
- Climate carrying-cost: moderate wildfire risk; extreme-heat days projected 7→24/yr by 2055 (HVAC capex compounding) — expect insurance premiums to compound above CPI over the hold.
Questions for the listing agent
- Have any recent inspections been done? Can we get a copy of the seller's disclosures and any deferred-maintenance estimates?
- Is there a deadline driving the sale (1031 exchange, divorce, estate, relocation)? That informs how much negotiation room exists.
- Schools are D-rated, which usually means shorter tenancies and higher turnover. Who's the typical renter profile here, and what's been the actual vacancy rate?
- What's the average days-on-market for RENTAL listings here right now (not sales)? A rising rental-DOM trend means longer vacancies and softer asking-rent achievability than the comps imply.
- What's the recent tenant-quality profile in this submarket — average credit score on applications, eviction rate, late-payment / NSF rate, and stable-employment percentage? A property-management company in the area should have these aggregated.
- How much new for-sale + rental construction is in the pipeline within 1–3 miles? Heavy new supply typically softens prices + rents 12–24 months out; constrained supply supports both.
Investment metrics
- 1% rule
- 1.68% ✓
- Cap rate
- 13.90%
- Cash-on-cash
- 27.18%
- DSCR
- 2.21
- GRM
- 5.0
CMA / ARV
No comps found within radius.
Projected returns pro-forma
-3.0% appreciation · 1.55% rent growth · sell at horizon
- IRR
- 19.5%
- Equity multiple
- 1.78×
- Total profit
- $13,735
- Equity at exit
- $9,394
- IRR
- 26.8%
- Equity multiple
- 3.20×
- Total profit
- $38,735
- Equity at exit
- $5,447
Cash invested: $17,640 (down + closing). Projections, not guarantees.
Landlord ↔ Tenant lean methodology
- Overall (STATE)
- 87 Strongly Landlord-Friendly
- State Texas
- 87 Strongly Landlord-Friendly · R+5
- County
- — inherits STATE
- City
- — inherits STATE
ZIP-level market 78840
- Home prices YoY
- -33.6%
- Rents YoY
- 1.6%
- Active inventory
- 549
- Price-to-rent
- 5.0×
Monthly cashflow live
- Estimated rent
- $1,057 medium interval (Pro) →
- Mortgage (P&I)
- −$330
- Tax est. 1.5%
- −$79 /mo · $945/yr
- Insurance
- −$26
- HOA
- −$0
- Vacancy / Maint / Mgmt
- −$222
- Net cashflow
- $400
Break-even live
Sensitivity live
| Price | -10% $443 | -5% $421 | +0% $400 | +5% $378 | +10% $356 |
|---|---|---|---|---|---|
| Rent | -10% $316 | -5% $358 | +0% $400 | +5% $441 | +10% $483 |
| Rate | -1.0pp $431 | -0.5pp $416 | base $400 | +0.5pp $383 | +1.0pp $367 |
UW: 25.0% down · 7.5% · 30yr · 1.5% tax · 5.0% vac · 8.0% maint · 8.0% mgmt
Financing live
Cash to close
- Down payment
- $15,750
- Closing costs
- $1,890
- Reserves months
- —
- Total cash needed
- —
Loan-product check · same deal, 3 products live
Conventional
25% down · 7.5% · 30yr
- Down + closing
- —
- Monthly P&I
- —
- Monthly cashflow
- —
- DSCR
- —
- Eligible?
- —
Personal DTI + credit; lowest rate.
DSCR
20% down · 8.5% · 30yr
- Down + closing
- —
- Monthly P&I
- —
- Monthly cashflow
- —
- DSCR
- —
- Eligible?
- —
No personal income docs; deal must DSCR.
Hard money
10% down · 12.0% · 12mo
- Down + closing
- —
- Monthly P&I
- —
- Monthly cashflow
- —
- DSCR
- —
- Eligible?
- —
Short-term bridge; refi at stabilization.
Listing history 5 events
-
2026-06-12days on market $63,000 Active 7 DOM
-
2026-06-09days on market $63,000 Active 4 DOM
-
2026-06-08days on market $63,000 Active 3 DOM
-
2026-06-07remarks 560-char remark
-
2026-06-07$63,000 Active 2 DOM
ⓘ Source: listings_history table (triggers on properties + properties_extension) + one-shot
backfill from property_details.listing_events for pre-trigger history.
Climate risk First Street
- Flood 1/10 Low FEMA zone X (unshaded) · 0% chance over 30 yrs
- Wildfire 5/10 Major
- Heat 8/10 Severe 7 d/yr ≥108°F today · 24 d/yr by 30 yrs out
- Wind 4/10 Moderate 17% chance of damaging wind over 30 yrs
- Air quality 1/10 Low 0 unhealthy d/yr today · 0 by 30 yrs out
Nearby sold comps map
Loading sold comps map…
Walkable amenities ~0.75 mi
Loading nearby amenities…
Taxation est. · year 1
- Rental income
- $12,683
- − Mortgage interest
- −$3,529
- − Property taxes
- −$945
- − Insurance
- −$315
- − Repairs & maintenance
- −$1,015
- − Management
- −$1,015
- − Depreciation
- −$1,833
- Taxable income
- $4,032
- Est. tax owed @ 24.0%
- −$968
- After-tax cash flow
- $3,827/yr
For passive investors: Depreciation is non-cash, so a rental often shows a tax loss while cash-flowing — sheltering income. Rental losses are passive: they offset passive income freely, and up to $25,000/yr can offset ordinary (W-2) income if you actively participate and your MAGI is under $100k (phasing out to $0 by $150k); unused losses carry forward. On sale, claimed depreciation is recaptured at up to 25%, and gains may owe capital-gains tax (a 1031 exchange can defer both). Figures are a year-1 estimate at your 24.0% rate — not tax advice; consult a CPA.
Condition & rehab AI · 1 photo
This mobile home requires extensive repairs and updates to its exterior, interior, and systems, significantly impacting its value. Immediate action is needed to address the poor condition and improve its resale and rental potential.
Repairs flagged
- Major exterior siding — Weathered and aged appearance
- Major roof — Aged appearance
- Major interior walls/paint — No visible interior, likely bare or in poor condition
- Major bathrooms — No visible bathrooms, likely in poor condition
- Major kitchen — No visible kitchen, likely in poor condition
- Major HVAC/mechanicals — No visible HVAC/mechanicals, likely in poor condition
- Major windows — No visible windows, likely in poor condition
- Major foundation/structure — No visible foundation/structure, likely in poor condition
Value-add opportunities
- Both exterior siding and roof repair — Improves curb appeal and functionality
- Both interior paint and updates — Enhances living space and rental appeal
- Both HVAC and mechanical updates — Improves comfort and energy efficiency
- Both window repairs or replacements — Enhances natural light and security
Renovation cost estimate screening
| Repair item | Severity | Est. cost |
|---|---|---|
| exterior siding · Weathered and aged appearance | Major | $15,000–50,000 |
| roof · Aged appearance | Major | $15,000–50,000 |
| interior walls/paint · No visible interior, likely bare or in poor condition | Major | $15,000–50,000 |
| bathrooms · No visible bathrooms, likely in poor condition | Major | $15,000–50,000 |
| kitchen · No visible kitchen, likely in poor condition | Major | $15,000–50,000 |
| HVAC/mechanicals · No visible HVAC/mechanicals, likely in poor condition | Major | $15,000–50,000 |
| windows · No visible windows, likely in poor condition | Major | $15,000–50,000 |
| foundation/structure · No visible foundation/structure, likely in poor condition | Major | $15,000–50,000 |
| Total estimated repair cost · 8 items | $120,000–400,000 |
Value-add ROI direction
- Both exterior siding and roof repair — Improves curb appeal and functionality ↑
- Both interior paint and updates — Enhances living space and rental appeal ↑
- Both HVAC and mechanical updates — Improves comfort and energy efficiency ↑
- Both window repairs or replacements — Enhances natural light and security ↑
ⓘ Cost ranges are severity-bucket heuristics (US national rule-of-thumb). Get contractor quotes + a written scope before underwriting a rehab budget.
Schools (NCES district)
- District
- San Felipe-Del Rio CISD
- NCES district ID
- 4838900
- Math proficiency
- 25% ▼ -18.00%
- Reading proficiency
- 32% ▼ -5.00%
- Median HH income
- $40,582
- Composite
- 24.04/100
- National rank
- #7766
- State rank
- #667 of 826 in TX
Livability — Del Rio
- Score
- 70/100
- State rank
- #349
- US rank
- #7531
Category grades
Schools grade is shown separately in the Schools card above.
Census & demographics
- Census place
- Del Rio, TX
- County
- Val Verde County · 47,256 people
- City population
- 47,256
- Metro
- Del Rio, TX
- Population (ZIP)
- 47,256
- Household income
- $66,084
- Rent vs Own
- Severe rent burden
- 1111.0
Population outlook (Val Verde County) Hauer SSP2
- Today (2025)
- 48,073 people
- By 2030
- 47,468 · -1.3%
- By 2040
- 45,930 · -4.5%
- By 2050
- 43,904 · -8.7%
- By 2075
- 38,126 · -20.7%
- By 2100
- 26,217 · -45.5%
Race, ethnicity, and origin ACS 2023
- Neighborhood character
- Predominantly Hispanic (82%)
- Race & ethnicity
- Hispanic / Latino 82% Two or more races 24% White 15% Black 1%
- Hispanic origin (detail)
- Mexican 75%
- Common ancestry
- Italian 1% Lithuanian 1% Slovak 1%
- Foreign-born
- 19% · Canada
- Languages at home
- 36% English-only · Spanish 63%
Political lean MEDSL · Val Verde
- 2024 margin
- Strong R (+26.6) · D 36.2% · R 62.9%
- 2008→2024 swing
- -36.2pp toward R · 2008: 9.6pp · 2024: -26.6pp
- All cycles
- 2024: R+26.6 2020: R+9.9 2016: D+7.9 2012: D+5.4 2008: D+9.6
Not yet ingested
- Civics
- —
Market trends
- HPI YoY
- ▼ -81.95%
- Current HPI
- 161.762
- Rent YoY
- ▲ 1.55%
- Metro
- Del Rio, TX
- State GDP YoY
- ▲ 3.95%
- F500 in state
- 110
Industry mix (Fortune 500 HQ in TX)
| Industry | F500 HQs | Revenue |
|---|---|---|
| Energy | 16 | $1,198B |
|
||
| Technology | 5 | $198B |
|
||
| Engineering / Construction | 4 | $72B |
|
||
| Energy Services | 3 | $60B |
|
||
| Utilities | 3 | $41B |
|
||
| Healthcare | 2 | $330B |
|
||
Price history
+37.0% since first listed10 events — show timeline
- 2026-06-05 Listed $63,000 DRBORMLS
- 2026-01-28 Sold (MLS) — DRBORMLS
- 2026-01-03 Pending — DRBORMLS
- 2025-11-10 Listed $40,000 DRBORMLS
- 2025-10-15 Sold (MLS) — DRBORMLS
- 2025-09-25 Pending — DRBORMLS
- 2025-07-30 Price Changed $40,000 DRBORMLS
- 2025-07-08 Price Changed $38,000 DRBORMLS
- 2025-04-22 Listed $45,000 DRBORMLS
- 2025-04-01 Listed $46,000 DRBORMLS
Cash-flow waterfall
monthlySold comps — $/sqft
last 12 mo · ≤1 miLoading sold comps…