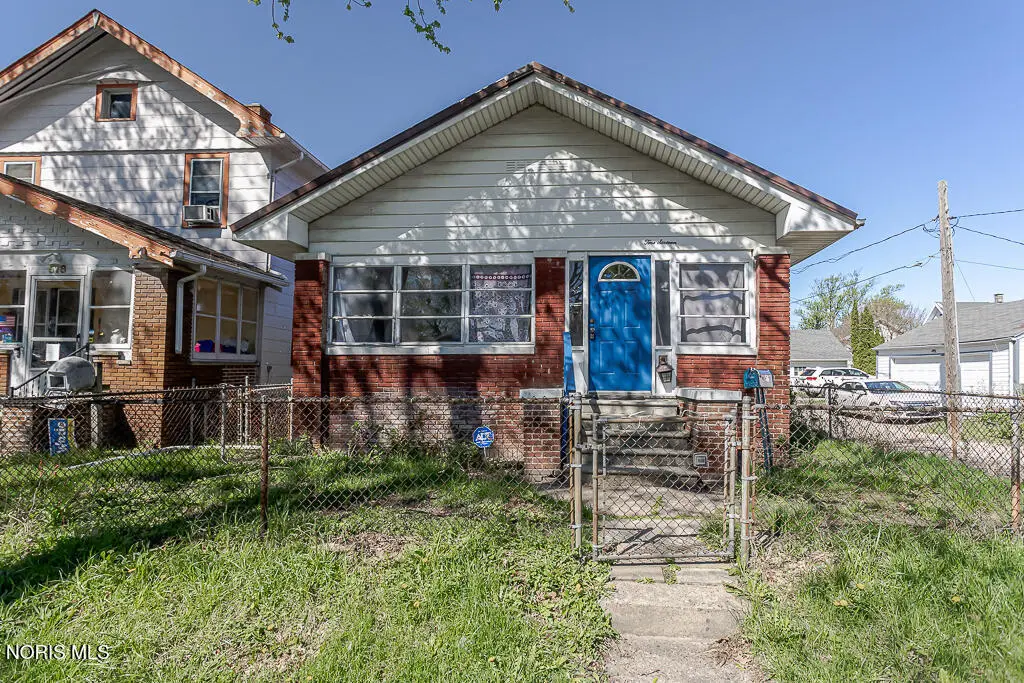
516 Geneva Ave · Toledo, OH
Flood risk 1/10 · Minimal
- FEMA flood zone
- X (unshaded)
- Chance of flooding over 30 yrs
- 0.0%
- Est. flood insurance / yr
- $473 – $860
Fire risk 1/10 · Minimal
- Est. fire insurance / yr
- $713 – $1,323
Heat risk 3/10 · Minor
- Hot days now (above 101°F)
- 7 days/yr
- Hot days in 30 yrs
- 16 days/yr
Wind risk 2/10 · Minimal
- Chance of severe wind over 30 yrs
- —
Air-quality risk 2/10 · Minimal
- Unhealthy air days now
- 1 days/yr
- Unhealthy air days in 30 yrs
- 2 days/yr
Risk factors via First Street. Map © Google.
Why this score? — see what drove the B grade
The composite is a weighted blend of 9 inputs, each scored 0–100. Each bar is that input's sub-score; the figure is the points it added to the 100-point composite (weight × sub-score).
- Cash flow +30.0/30.0
- 1% rule +10.0/10.0
- DSCR +10.0/10.0
- ARV discount +7.5/15.0
- Appreciation +5.4/10.0
- Rent growth +4.5/5.0
- Livability +3.3/5.0
- Condition / age +2.5/5.0
- Schools +1.6/10.0
$34,000
🖨 Deal sheet 📄 Offer letter ✓ Due diligence
Listing remarks
More than meets the eye - transform this home and make it complete. The home needs work but you get a great start with a NEW Boiler , New Metal Roof , Newer Hot Water Tank and most of the windows are replacements. Kitchen and Bathroom need COMPLETE rebuild - main floor laundry setup in place and a large bedroom - the home has enough space to be transformed to a two bedroom. Attached garage of the back could be repaired or removed -The possibilities are great! Great bones and a great potential in the highland park neighborhood! NO SELLER OR CREATIVE FINANCING !! NO ASSIGNMENTS !! SOLD AS-IS , WHERE-IS everything in the home goes with the sale.
Key facts
- New boiler
- New metal roof
- Large bedroom
Tags
Property features AI
Finance
- Other: Residential zoning: 10-RD6
- HOA & community: Park nearby / community park
Exterior
- Parking: Attached garage with alley access; 1-car garage
- Utilities: Public water; Public sewer; Electricity connected (100 Amp service); Natural gas connected; Cable, internet and WiFi available
- Home design: Single-family residence (house); One level / single-story; Not attached to other structures; No common walls
- Construction: Aluminum siding and brick exterior; Block foundation; Public records listed year built
- Exterior features: Metal roof; Corner lot; City street frontage; Asphalt road
Interior
- Kitchen: Kitchen on main level (20 x 10)
- Bedrooms: Primary bedroom on main level (14 x 12)
- Flooring: Hardwood floors
- Bathrooms: 1 full bathroom
- Heating & cooling: Boiler heating
- Interior features: No interior steps; Double-pane windows; Living room fireplace
- Laundry & utility: Main level laundry with gas dryer hookup
Neighborhood map
What this means for you Summary
Snapshot
- This is a 1-bed/1.0-bath single-family listed at $34k.
Deal economics
- At list price, monthly cash flow is $335 ($4k/yr) — positive.
- The deal already cash-flows at list — no discount required.
- Meets the 1% rule at list price ($821 rent vs $34k).
- Recommended offer: $33k (1.5% below list) — sets the bar for market timing.
- Cap rate 18.1% vs local median 7.6% in Toledo — top-decile yield for the area; either an underpriced asset or a hidden risk that comps aren't pricing in. Stress-test before assuming the spread holds.
Location & tenants
- Location reads 66/100 on livability (#645 in OH) — a middle-class / working-renter tenant base. Strengths: cost of living A+, housing A+, health & safety A+; Watch: amenities C-, crime F, commute F.
- Toledo City (urban): math 15% / reading 24% proficiency, ranked #634 of 656 in OH (top 97%) — low school quality limits family demand, transient renter base, plan for 1-2y turnover; 72% free/reduced lunch — lower-income household profile, screen leases tightly.
- Zoned schools: Arlington Elementary School (math 12% / reading 14%, grade F, #1,429 of 1,584 statewide, top 90%, 327 students, 0% FRL); Bowsher High School (math 23% / reading 45%, grade F, #596 of 781 statewide, top 76%, 1,240 students, 49% FRL) — zoned schools average 25% FRL vs 72% district-wide (47 pts lower); this property's tenant base skews higher-income than the district average.
- Market conditions: Rents rising fast (+7.8%/yr); 99 active listings in the ZIP; 17 comparable units currently listed for rent nearby; rentals lingering (median 44d on market — plan ~5-8 weeks vacancy on turnover, expect pricing pressure); 53% of comp listings sitting > 30 days — soft ceiling on asking rent; lower-income renter base — watch delinquency; 415 units permitted in Lucas County in 2024 (122 in 5+ unit buildings).
Forward outlook
- In year one you build about $490 of equity ($235 loan paydown + $255 appreciation (0.8% local appreciation)).
- Lucas County population projected at -16% by 2050 — secular population decline; favor cash flow + early exit over multi-decade hold.
- At projected returns (0.8% appreciation + 7.8% rent growth), your $10k cash investment doubles in ~2 years — after that, you're playing with house money.
Negotiation context
- It's been on market 17 days — a 2% lower offer ($33k) is reasonable based on typical stale-listing flexibility.
Risks & watch-outs
- Watch-outs: property tax is 4.3% of price; built in 1922 — expect roof / HVAC / electrical / plumbing capex.
Questions for the listing agent
- Built in 1922 — when were the roof, HVAC, electrical panel, plumbing, and water heater last replaced?
- Property tax is high relative to price — has the assessment been appealed recently, and will the sale trigger a re-assessment?
- Is there a deadline driving the sale (1031 exchange, divorce, estate, relocation)? That informs how much negotiation room exists.
- Schools are D-rated, which usually means shorter tenancies and higher turnover. Who's the typical renter profile here, and what's been the actual vacancy rate?
- Crime grade is F in this area — have there been break-ins, vandalism, or insurance claims at this property in the last 3 years? What carrier currently insures it and at what premium?
- What's the average days-on-market for RENTAL listings here right now (not sales)? A rising rental-DOM trend means longer vacancies and softer asking-rent achievability than the comps imply.
- What's the recent tenant-quality profile in this submarket — average credit score on applications, eviction rate, late-payment / NSF rate, and stable-employment percentage? A property-management company in the area should have these aggregated.
- How much new for-sale + rental construction is in the pipeline within 1–3 miles? Heavy new supply typically softens prices + rents 12–24 months out; constrained supply supports both.
Investment metrics
- 1% rule
- 2.42% ✓
- Cap rate
- 18.11%
- Cash-on-cash
- 42.22%
- DSCR
- 2.88
- GRM
- 3.5
CMA / ARV
- ARV (median comp)
- $81,632
- List price
- $34,000
- Delta
- -58.35%
- Verdict
- UNDERPRICED
- Comps
- 20 within 1.0 mi
Show comp detail 12 sales within ~0.75 mi
| Address | Dist | Beds/Ba | Sqft | Sold | Price | $/sf | Match |
|---|---|---|---|---|---|---|---|
| 1922 Heatherdale Dr | 0.34mi | 2/1.0 (+1) | 946 (-1%) | 2mo | $111,000 | $117 | 76 |
| 502 Brighton Ave | 0.18mi | 2/1.0 (+1) | 884 (-8%) | 1mo | $123,900 | $140 | 74 |
| 530 Toronto Ave | 0.06mi | 2/1.0 (+1) | 1,030 (+8%) | 10mo | $84,500 | $82 | 71 |
| 648 Carlton St | 0.39mi | 2/1.0 (+1) | 880 (-8%) | 2mo | $86,000 | $98 | 62 |
| 713 Geneva Ave | 0.22mi | 2/1.0 (+1) | 843 (-12%) | 5mo | $52,500 | $62 | 61 |
| 516 Lodge Ave | 0.24mi | 2/1.0 (+1) | 873 (-9%) | 11mo | $82,000 | $94 | 61 |
| 424 Mayberry St | 0.58mi | 2/1.0 (+1) | 920 (-4%) | 5mo | $58,740 | $64 | 57 |
| 864 Hampton Ave | 0.44mi | 2/1.0 (+1) | 878 (-8%) | 9mo | $90,000 | $103 | 53 |
| 933 Wright Ave | 0.56mi | 2/1.0 (+1) | 864 (-10%) | 3mo | $60,500 | $70 | 50 |
| 230 Somerset St | 0.54mi | 2/1.0 (+1) | 864 (-10%) | 12mo | $75,000 | $87 | 44 |
| 1011 National Ave | 0.68mi | 2/1.0 (+1) | 833 (-13%) | 8mo | $81,000 | $97 | 36 |
| 1043 Atlantic Ave | 0.71mi | 2/1.0 (+1) | 812 (-15%) | 8mo | $103,500 | $127 | 30 |
Match score weights: distance 35% · size 25% · config 20% · recency 20%. Top-matched comps best support the ARV.
Projected returns pro-forma
0.75% appreciation · 7.8% rent growth · sell at horizon
- IRR
- 49.7%
- Equity multiple
- 3.71×
- Total profit
- $25,771
- Equity at exit
- $11,166
- IRR
- 54.0%
- Equity multiple
- 8.87×
- Total profit
- $74,880
- Equity at exit
- $14,503
Cash invested: $9,520 (down + closing). Projections, not guarantees.
Landlord ↔ Tenant lean methodology
- Overall (STATE)
- 73 Landlord-Friendly
- State Ohio
- 73 Landlord-Friendly · R+6
- County
- — inherits STATE
- City
- — inherits STATE
ZIP-level market 43609
- Home prices YoY
- 0.3%
- Rents YoY
- 7.8%
- Active inventory
- 99
- Price-to-rent
- 3.5×
Monthly cashflow live
- Estimated rent
- $821 high interval (Pro) →
- Mortgage (P&I)
- −$178
- Tax from tax record
- −$121 /mo · $1,457/yr
- Insurance
- −$14
- HOA
- −$0
- Vacancy / Maint / Mgmt
- −$172
- Net cashflow
- $335
Break-even live
UW: 25.0% down · 7.5% · 30yr · 1.5% tax · 5.0% vac · 8.0% maint · 8.0% mgmt
Financing live
Cash to close
- Down payment
- $8,500
- Closing costs
- $1,020
- Reserves months
- —
- Total cash needed
- —
Loan-product check · same deal, 3 products live
Conventional
25% down · 7.5% · 30yr
- Down + closing
- —
- Monthly P&I
- —
- Monthly cashflow
- —
- DSCR
- —
- Eligible?
- —
Personal DTI + credit; lowest rate.
DSCR
20% down · 8.5% · 30yr
- Down + closing
- —
- Monthly P&I
- —
- Monthly cashflow
- —
- DSCR
- —
- Eligible?
- —
No personal income docs; deal must DSCR.
Hard money
10% down · 12.0% · 12mo
- Down + closing
- —
- Monthly P&I
- —
- Monthly cashflow
- —
- DSCR
- —
- Eligible?
- —
Short-term bridge; refi at stabilization.
Rent comps 17 comps
| Address | Beds | Baths | Sqft | Rent | $/sqft | DOM | Units | Dist |
|---|---|---|---|---|---|---|---|---|
| 707 Toronto Ave Toledo, OH | 1.0 | 1.0 | 750 | $775 | $1.03 | 23d | 1 | 0.20mi |
| 538 Nicholas St Unit B Toledo, OH | 1.0 | 1.0 | 600 | $600 | $1.00 | 43d | 1 | 0.29mi |
| 705 Nicholas St Toledo, OH | 2.0 | 1.0 | 1037 | $900 | $0.87 | 43d | 1 | 0.36mi |
| 1521 Emma St Unit LABS 1521 Emma St, B 43051619729 Toledo, OH | 1.0 | 1.0 | 975 | $900 | $0.92 | 43d | 1 | 0.44mi |
| 1734 Arlington Ave Toledo, OH | 2.0 | 1.0 | 700 | $800 | $1.14 | 14d | 1 | 0.45mi |
| 2044 Arlington Ave Toledo, OH | 2.0 | 1.0 | 800 | $825 | $1.03 | 21d | 1 | 0.62mi |
| 307 Danberry St Toledo, OH | 2.0 | 1.0 | 988 | $950 | $0.96 | 43d | 1 | 0.66mi |
| 2594 Broadway St Toledo, OH | 2.0 | 1.0 | 1076 | $825 | $0.77 | 43d | 1 | 0.82mi |
| 1037 Orchard St Toledo, OH | 2.0 | 1.0 | 696 | $820 | $1.18 | 21d | 1 | 0.97mi |
| 581 Colima Dr Toledo, OH | 2.0 | 1.0 | 900 | $1,100 | $1.22 | 14d | 1 | 1.00mi |
| 1785 Tecumseh St Toledo, OH | 2.0 | 1.0 | 930 | $900 | $0.97 | 43d | 1 | 1.00mi |
| 2820 Airport Hwy Toledo, OH | 1.0 | 1.0 | 580 | $679 | $1.17 | 43d | 1 | 1.29mi |
| 2820 Airport Hwy Toledo, OH | 1.0 | 1.0 | 580 | $704 | $1.21 | 23d | 1 | 1.29mi |
| 2820 Airport Hwy Toledo, OH | 1.0 | 1.0 | 580 | $679 | $1.17 | 14d | 1 | 1.29mi |
| 827 Colburn St Toledo, OH | 2.0 | 1.0 | 1092 | $750 | $0.69 | 43d | 1 | 1.32mi |
| 223 Charles St Toledo, OH | 2.0 | 1.0 | 612 | $875 | $1.43 | 43d | 1 | 1.37mi |
| 771 Orchard St Unit 7715 Toledo, OH | 2.0 | 1.0 | 1086 | $645 | $0.59 | 23d | 1 | 1.37mi |
Listing history 6 events
-
2026-05-12status Pending 651-char remark
-
2026-05-04price $34,000 651-char remark
-
2026-04-24$49,000 Active 651-char remark
-
2003-07-01soldstatus $65,000
-
1990-04-04soldstatus $25,000
-
1982-09-27soldstatus $41,500
ⓘ Source: listings_history table (triggers on properties + properties_extension) + one-shot
backfill from property_details.listing_events for pre-trigger history.
Tax reassessment forecast OH · Partial reset (capped growth)
- Current annual tax
- $1,457 · $121/mo
- Projected year-2 tax
- $1,457 · $121/mo
- Expected delta
- $0/yr ($0/mo · 0.0%)
ⓘ Screening estimate from a state-policy table — verify with the county assessor before closing.
Climate risk First Street
- Flood 1/10 Low FEMA zone X (unshaded) · 0% chance over 30 yrs
- Wildfire 1/10 Low
- Heat 3/10 Moderate 7 d/yr ≥101°F today · 16 d/yr by 30 yrs out
- Wind 2/10 Low
- Air quality 2/10 Low 1 unhealthy d/yr today · 2 by 30 yrs out
Nearby sold comps map
Loading sold comps map…
Walkable amenities ~0.75 mi
Loading nearby amenities…
Taxation est. · year 1
- Rental income
- $9,855
- − Mortgage interest
- −$1,905
- − Property taxes
- −$1,457
- − Insurance
- −$170
- − Repairs & maintenance
- −$788
- − Management
- −$788
- − Depreciation
- −$989
- Taxable income
- $3,758
- Est. tax owed @ 24.0%
- −$902
- After-tax cash flow
- $3,117/yr
For passive investors: Depreciation is non-cash, so a rental often shows a tax loss while cash-flowing — sheltering income. Rental losses are passive: they offset passive income freely, and up to $25,000/yr can offset ordinary (W-2) income if you actively participate and your MAGI is under $100k (phasing out to $0 by $150k); unused losses carry forward. On sale, claimed depreciation is recaptured at up to 25%, and gains may owe capital-gains tax (a 1031 exchange can defer both). Figures are a year-1 estimate at your 24.0% rate — not tax advice; consult a CPA.
Schools (NCES district)
- District
- Toledo City
- NCES district ID
- 3904490
- Math proficiency
- 15% ▼ -16.00%
- Reading proficiency
- 24% ▼ -13.00%
- Median HH income
- $32,137
- Composite
- 15.76/100
- National rank
- #9276
- State rank
- #634 of 656 in OH
Livability — Toledo
- Score
- 66/100
- State rank
- #645
- US rank
- #11442
Category grades
Schools grade is shown separately in the Schools card above.
Census & demographics
- Census place
- Toledo, OH
- County
- Lucas County · 380,724 people
- City population
- 280,811
- Metro
- Toledo, OH
- Population (ZIP)
- 21,404
- Household income
- $42,313
- Rent vs Own
- Severe rent burden
- 1603.0
Population outlook (Lucas County) Hauer SSP2
- Today (2025)
- 420,751 people
- By 2030
- 410,187 · -2.5%
- By 2040
- 384,019 · -8.7%
- By 2050
- 355,125 · -15.6%
- By 2075
- 291,683 · -30.7%
- By 2100
- 233,670 · -44.5%
Race, ethnicity, and origin ACS 2023
- Neighborhood character
- Diverse neighborhood (Simpson 0.66)
- Race & ethnicity
- White 47% Black 29% Hispanic / Latino 17% Two or more races 9%
- Hispanic origin (detail)
- Mexican 15%
- Common ancestry
- Romanian 5% Lithuanian 2% Italian 1%
- Foreign-born
- 4% · Canada, China
- Languages at home
- 92% English-only · Spanish 5% Arabic 1% French/Haitian/Cajun 1%
Political lean MEDSL · Lucas
- 2024 margin
- D (+12.6) · D 55.8% · R 43.2%
- 2008→2024 swing
- -18.9pp toward R · 2008: 31.4pp · 2024: 12.6pp
- All cycles
- 2024: D+12.6 2020: D+16.8 2016: D+17.4 2012: D+30.4 2008: D+31.4
Not yet ingested
- Civics
- —
Market trends
- HPI YoY
- ▲ 0.75%
- Current HPI
- 235.2515
- Rent YoY
- ▲ 7.80%
- Metro
- Toledo, OH
- State GDP YoY
- ▲ 1.98%
- F500 in state
- 48
Industry mix (Fortune 500 HQ in OH)
| Industry | F500 HQs | Revenue |
|---|---|---|
| Insurance | 3 | $145B |
|
||
| Industrial Machinery | 3 | $49B |
|
||
| Financial Services | 3 | $24B |
|
||
| Consumer Goods | 2 | $93B |
|
||
| Aerospace / Defense | 2 | $47B |
|
||
| Utilities | 2 | $33B |
|
||
Price history
-18.1% since first listed6 events — show timeline
- 2026-05-12 Pending — NORIS
- 2026-05-04 Price Changed $34,000 NORIS
- 2026-04-24 Listed $49,000 NORIS
- 2003-07-01 Sold (Public Records) $65,000 Public Records
- 1990-04-04 Sold (Public Records) $25,000 Public Records
- 1982-09-27 Sold (Public Records) $41,500 Public Records
Property tax history
+7.7%/yrLatest (2025): $1,457 · +0.7% YoY. Source: county tax records.
Cash-flow waterfall
monthlySold comps — $/sqft
last 12 mo · ≤1 miLoading sold comps…