 🏗️ New Construction
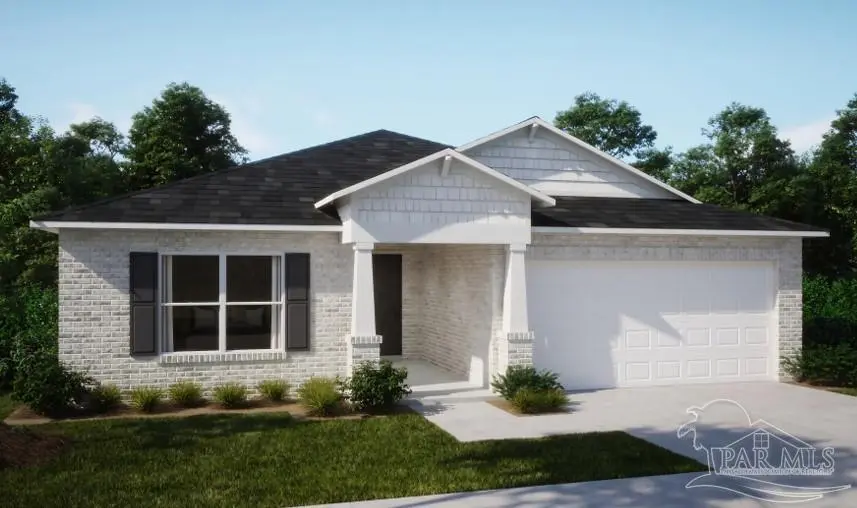
6116 Bellview Pointe Ln · Bellview, FL
Flood risk No data
- FEMA flood zone
- —
- Chance of flooding over 30 yrs
- —
- Est. flood insurance / yr
- —
Fire risk No data
- Est. fire insurance / yr
- —
Heat risk No data
- Hot days now (above threshold)
- —
- Hot days in 30 yrs
- —
Wind risk No data
- Chance of severe wind over 30 yrs
- —
Air-quality risk No data
- Unhealthy air days now
- —
- Unhealthy air days in 30 yrs
- —
Risk factors via First Street. Map © Google.
Why this score? — see what drove the F grade
The composite is a weighted blend of 9 inputs, each scored 0–100. Each bar is that input's sub-score; the figure is the points it added to the 100-point composite (weight × sub-score).
- Cash flow +7.8/30.0
- ARV discount +7.5/15.0
- Rent growth +3.6/5.0
- Schools +3.6/10.0
- Livability +3.4/5.0
- Condition / age +2.5/5.0
- 1% rule +2.4/10.0
- DSCR +1.9/10.0
- Appreciation +0.0/10.0
$312,900
🖨 Deal sheet (PDF) 📄 Offer letter ✓ Due diligence
Listing remarks
The Maple presents a fresh, well-balanced design that blends space, function, and modern comfort from the moment you step inside. A bright open-concept layout seamlessly connects the living, dining, and kitchen areas, creating an inviting setting for both everyday living and entertaining. Expansive 9' ceilings enhance the sense of space while allowing natural light to flow throughout. At the heart of the home, the kitchen features sleek quartz countertops that bring together durability and contemporary style. Just beyond, a spacious rear flex area adds versatility, ideal for a formal dining room, home office, fitness space, or playroom. French double doors lead to the rear patio, extending
Key facts
- Quartz countertops
- Walk-in closet
- French double doors
Tags
Property features AI
Finance
- Other: Road responsibility: See remarks
- HOA & community: HOA with an annual fee of $260
Exterior
- Parking: Attached 2-car garage; 2 covered parking spaces (total 2 parking spaces)
- Security: Smoke detector(s)
- Utilities: Public water; Public sewer; Circuit breaker electric; Cable available
- Home design: One story; Under construction / New construction; ENERGY STAR certified home; Not attached to another property
- Construction: Frame construction; Shingle roof; Slab foundation; Built as new construction
- Exterior features: Patio; Located on a cul-de-sac
Interior
- Kitchen: Kitchen island; Pantry; Microwave; Disposal
- Bedrooms: Master bedroom on the first floor; Additional bedrooms on the first floor
- Flooring: Carpet
- Bathrooms: 2 full bathrooms
- Heating & cooling: Central heating; Central air conditioning
- Interior features: Insulated doors; Smart thermostat
- Laundry & utility: Laundry inside; Electric water heater; ENERGY STAR qualified water heater
Neighborhood map
What this means for you Summary
Snapshot
- This is a 4-bed/2.0-bath land listed at $313k.
Deal economics
- At list price, monthly cash flow is $-348 ($-4k/yr) — negative.
- To cash-flow at today's rent, offer at most $263k (16.1% below list).
- To meet the 1% rule (rent ≥ 1% of price), the offer needs to be $232k (25.7% below list).
- Recommended offer: $232k (25.7% below list) — sets the bar for 1% rule.
Location & tenants
- Location reads 67/100 on livability (#561 in FL) — a middle-class / working-renter tenant base. Strengths: cost of living A+, housing A+; Watch: amenities F, commute F, health & safety F.
- Escambia (suburban): math 40% / reading 45% proficiency, ranked #56 of 73 in FL (top 77%) — families likely to look elsewhere, expect single-tenant / working-renter base with shorter leases.
- Zoned schools: Longleaf Elementary School (math 37% / reading 43%, grade F, #1,491 of 2,144 statewide, top 70%, 548 students, 77% FRL); Bellview Middle School (math 17% / reading 23%, grade F, #558 of 571 statewide, top 98%, 992 students, 76% FRL); Pine Forest High School (math 20% / reading 32%, grade F, #494 of 667 statewide, top 75%, 1,870 students, 62% FRL).
- Zoned-school proficiency averages 29% at this address vs 42% district-wide (-14 pts) — the specific schools serving this property underperform the Escambia average; the district grade overstates school quality for this exact location.
- Market conditions: Rents rising fast (+4.4%/yr); 422 active listings in the ZIP; 12 comparable units currently listed for rent nearby; rentals at typical pace (median 26d on market — plan ~3-4 weeks tenant-placement turnaround); solid renter incomes; 1,479 units permitted in Escambia County in 2024 (0 in 5+ unit buildings).
- This rent runs 37% of the median local income ($75k/yr) — at the standard rent-burdened threshold; future hikes will face affordability resistance.
Forward outlook
- Local home prices are declining (-3.0%/yr); year-one equity from $2k of loan paydown is wiped out by about $9k of value loss. Plan a longer hold.
- Escambia County population projected at +13% by 2050 — modest demand growth; plan on rents tracking national, not racing it.
Negotiation context
- Only 11 days on market — expect competitive offers; lowballing is unlikely to land.
Questions for the listing agent
- What do current leases actually rent for vs. the listed asking? Can we see a recent rent roll and the last 12 months of T-12 income?
- What does the HOA fee cover, when was the last increase, and are there any pending special assessments or reserve-fund shortfalls?
- Is there a deadline driving the sale (1031 exchange, divorce, estate, relocation)? That informs how much negotiation room exists.
- Schools are D-rated, which usually means shorter tenancies and higher turnover. Who's the typical renter profile here, and what's been the actual vacancy rate?
- The area grade is low — what's the realistic commute time and amenity access for the typical tenant pool here? Any planned neighborhood developments (good or bad) we should know about?
- What's the average days-on-market for RENTAL listings here right now (not sales)? A rising rental-DOM trend means longer vacancies and softer asking-rent achievability than the comps imply.
- What's the recent tenant-quality profile in this submarket — average credit score on applications, eviction rate, late-payment / NSF rate, and stable-employment percentage? A property-management company in the area should have these aggregated.
- How much new for-sale + rental construction is in the pipeline within 1–3 miles? Heavy new supply typically softens prices + rents 12–24 months out; constrained supply supports both.
Investment metrics
- 1% rule
- 0.74% ✗
- Cap rate
- 4.96%
- Cash-on-cash
- -4.76%
- DSCR
- 0.79
- GRM
- 11.2
CMA / ARV
No comps found within radius.
Projected returns pro-forma
-3.0% appreciation · 4.42% rent growth · sell at horizon
- IRR
- -22.8%
- Equity multiple
- 0.21×
- Total profit
- $-69,427
- Equity at exit
- $46,654
- IRR
- -13.9%
- Equity multiple
- 0.15×
- Total profit
- $-74,538
- Equity at exit
- $27,054
Cash invested: $87,612 (down + closing). Projections, not guarantees.
Landlord ↔ Tenant lean methodology
- Overall (STATE)
- 87 Strongly Landlord-Friendly
- State Florida
- 87 Strongly Landlord-Friendly · R+3
- County
- — inherits STATE
- City
- — inherits STATE
ZIP-level market 32526
- Home prices YoY
- -28.3%
- Rents YoY
- 4.4%
- Active inventory
- 422
- Price-to-rent
- 11.2×
Monthly cashflow live
- Estimated rent
- $2,325 high interval (Pro) →
- Mortgage (P&I)
- −$1,641
- Tax est. 1.5%
- −$391 /mo · $4,694/yr
- Insurance
- −$130
- HOA
- −$22
- Lot rent
- −$0
- Vacancy / Maint / Mgmt
- −$488
- Net cashflow
- $-348
Break-even live
Sensitivity live
| Price | -10% $-131 | -5% $-240 | +0% $-348 | +5% $-456 | +10% $-564 |
|---|---|---|---|---|---|
| Rent | -10% $-531 | -5% $-439 | +0% $-348 | +5% $-256 | +10% $-164 |
| Rate | -1.0pp $-190 | -0.5pp $-268 | base $-348 | +0.5pp $-429 | +1.0pp $-511 |
UW: 25.0% down · 7.5% · 30yr · 1.5% tax · 5.0% vac · 8.0% maint · 8.0% mgmt
Financing live
Cash to close
- Down payment
- $78,225
- Closing costs
- $9,387
- Reserves months
- —
- Total cash needed
- —
Loan-product check · same deal, 3 products live
Conventional
25% down · 7.5% · 30yr
- Down + closing
- —
- Monthly P&I
- —
- Monthly cashflow
- —
- DSCR
- —
- Eligible?
- —
Personal DTI + credit; lowest rate.
DSCR
20% down · 8.5% · 30yr
- Down + closing
- —
- Monthly P&I
- —
- Monthly cashflow
- —
- DSCR
- —
- Eligible?
- —
No personal income docs; deal must DSCR.
Hard money
10% down · 12.0% · 12mo
- Down + closing
- —
- Monthly P&I
- —
- Monthly cashflow
- —
- DSCR
- —
- Eligible?
- —
Short-term bridge; refi at stabilization.
Rent comps 12 comps
| Address | Beds | Baths | Sqft | Rent | $/sqft | DOM | Units | Dist |
|---|---|---|---|---|---|---|---|---|
| 6740 Scotts Pl Pensacola, FL | 3.0 | 2.5 | 1663 | $2,350 | $1.41 | 16d | 1 | 0.18mi |
| 6740 Scotts Pl Pensacola, FL | 3.0 | 2.5 | 1663 | $2,350 | $1.41 | 26d | 1 | 0.18mi |
| 6379 Mers Ln Pensacola, FL | 3.0 | 2.5 | 1811 | $1,900 | $1.05 | 23d | 1 | 0.99mi |
| 6225 Mobile Hwy Pensacola, FL | 1.0–3.0 | 1.0–2.0 | 1036 | $2,595 | $2.50 | 16d | 15 | 1.14mi |
| 5877 Tryton Cir Pensacola, FL | 4.0 | 2.0 | 1419 | $1,825 | $1.29 | 26d | 1 | 1.18mi |
| 2143 Yardley Cir Pensacola, FL | 3.0 | 2.0 | 1725 | $2,300 | $1.33 | 16d | 1 | 1.19mi |
| 7095 N Blue Angel Pkwy Pensacola, FL | 3.0 | 2.0–2.5 | 2168 | $1,875 | $0.86 | 26d | 2 | 1.30mi |
| 7045 Pine Forest Rd Pensacola, FL | 1.0–3.0 | 1.0–2.0 | 1011 | $2,174 | $2.15 | 16d | 27 | 1.32mi |
| 1472 Wingfoot Way Pensacola, FL | 3.0 | 2.0 | 1284 | $1,595 | $1.24 | 26d | 1 | 1.32mi |
| 6081 Royal Port Ct Pensacola, FL | 3.0 | 2.5 | 1428 | $1,850 | $1.30 | 26d | 1 | 1.38mi |
| 6077 Royal Port Ct Pensacola, FL | 3.0 | 2.5 | 1542 | $1,775 | $1.15 | 26d | 1 | 1.39mi |
| 6111 Enterprise Dr Pensacola, FL | 1.0–3.0 | 1.0–2.0 | 1224 | $1,688 | $1.38 | 16d | 19 | 1.46mi |
HOA detail
- Monthly dues
- $22 · $264/yr
Listing history 2 events
-
2026-05-02status Pending
-
2026-04-21$312,900 Active
ⓘ Source: listings_history table (triggers on properties + properties_extension) + one-shot
backfill from property_details.listing_events for pre-trigger history.
Nearby sold comps map
Loading sold comps map…
Walkable amenities ~0.75 mi
Loading nearby amenities…
Taxation est. · year 1
- Rental income
- $27,900
- − Mortgage interest
- −$17,527
- − Property taxes
- −$4,694
- − Insurance
- −$1,564
- − Repairs & maintenance
- −$2,232
- − Management
- −$2,232
- − HOA
- −$264
- − Depreciation
- −$9,103
- Taxable loss
- −$9,716
- Est. tax savings @ 24.0%
- +$2,332
- After-tax cash flow
- $-1,840/yr
For passive investors: Depreciation is non-cash, so a rental often shows a tax loss while cash-flowing — sheltering income. Rental losses are passive: they offset passive income freely, and up to $25,000/yr can offset ordinary (W-2) income if you actively participate and your MAGI is under $100k (phasing out to $0 by $150k); unused losses carry forward. On sale, claimed depreciation is recaptured at up to 25%, and gains may owe capital-gains tax (a 1031 exchange can defer both). Figures are a year-1 estimate at your 24.0% rate — not tax advice; consult a CPA.
Schools (NCES district)
- District
- Escambia
- NCES district ID
- 1200510
- Math proficiency
- 40% ▼ -9.00%
- Reading proficiency
- 45% ▼ -4.00%
- Median HH income
- $44,649
- Composite
- 36.04/100
- National rank
- #4773
- State rank
- #56 of 73 in FL
Livability — Bellview
- Score
- 67/100
- State rank
- #561
- US rank
- #10731
Category grades
Schools grade is shown separately in the Schools card above.
Census & demographics
- Census place
- Bellview, FL
- County
- Escambia County · 301,722 people
- Metro
- Pensacola-Ferry Pass-Brent, FL
- Population (ZIP)
- 44,680
- Household income
- $75,098
- Rent vs Own
- Severe rent burden
- 1166.0
Population outlook (Escambia County) Hauer SSP2
- Today (2025)
- 334,637 people
- By 2030
- 345,779 · +3.3%
- By 2040
- 364,828 · +9.0%
- By 2050
- 378,514 · +13.1%
- By 2075
- 403,220 · +20.5%
- By 2100
- 386,125 · +15.4%
Race, ethnicity, and origin ACS 2023
- Neighborhood character
- Predominantly White (66%)
- Race & ethnicity
- White 66% Black 19% Two or more races 8% Hispanic / Latino 5% Asian 3%
- Common ancestry
- Lithuanian 2% Slovak 2% Serbian 2%
- Foreign-born
- 5% · Canada, China
- Languages at home
- 94% English-only · Spanish 2% Tagalog/Filipino 1% Other Indo-European 1%
Political lean MEDSL · Escambia
- 2024 margin
- R (+19.5) · D 39.7% · R 59.2% · Other 1.1%
- 2008→2024 swing
- -0.2pp no change · 2008: -19.3pp · 2024: -19.5pp
- All cycles
- 2024: R+19.5 2020: R+15.1 2016: R+20.6 2012: R+20.6 2008: R+19.3
Not yet ingested
- Civics
- —
Market trends
- HPI YoY
- ▼ -99.68%
- Current HPI
- 252.6406
- Rent YoY
- ▲ 4.42%
- Metro
- Pensacola-Ferry Pass-Brent, FL
- State GDP YoY
- ▲ 3.28%
- F500 in state
- 36
Industry mix (Fortune 500 HQ in FL)
| Industry | F500 HQs | Revenue |
|---|---|---|
| Industrial Technology | 2 | $29B |
|
||
| Insurance | 2 | $17B |
|
||
| Retail | 1 | $60B |
|
||
| Technology Distribution | 1 | $58B |
|
||
| Homebuilding | 1 | $35B |
|
||
| Technology Manufacturing | 1 | $35B |
|
||
Price history
2 events — show timeline
- 2026-05-02 Pending — PARMLS
- 2026-04-21 Listed $312,900 PARMLS
Cash-flow waterfall
monthlySold comps — $/sqft
last 12 mo · ≤1 miLoading sold comps…