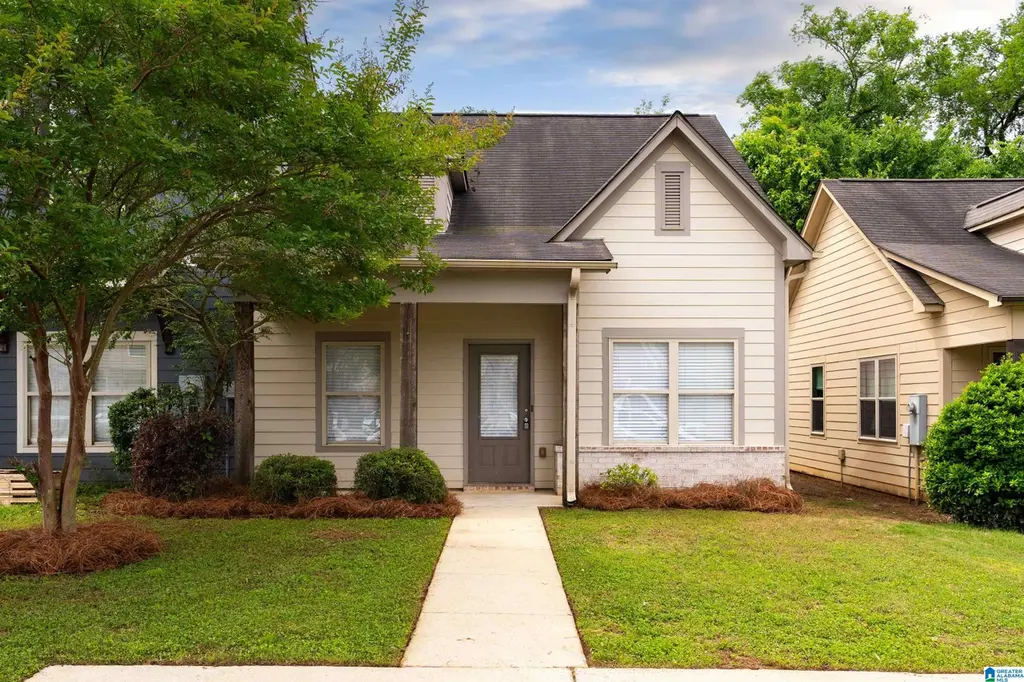
237 The Heights Dr · Calera, AL
Flood risk 1/10 · Minimal
- FEMA flood zone
- X (unshaded)
- Chance of flooding over 30 yrs
- 0.0%
- Est. flood insurance / yr
- $507 – $1,088
Fire risk 4/10 · Minor
- Est. fire insurance / yr
- $916 – $1,700
Heat risk 7/10 · Major
- Hot days now (above 106°F)
- 7 days/yr
- Hot days in 30 yrs
- 21 days/yr
Wind risk 6/10 · Moderate
- Chance of severe wind over 30 yrs
- 55.0%
Air-quality risk 2/10 · Minimal
- Unhealthy air days now
- 2 days/yr
- Unhealthy air days in 30 yrs
- 2 days/yr
Risk factors via First Street. Map © Google.
Why this score? — see what drove the C grade
The composite is a weighted blend of 9 inputs, each scored 0–100. Each bar is that input's sub-score; the figure is the points it added to the 100-point composite (weight × sub-score).
- Cash flow +19.0/30.0
- ARV discount +12.7/15.0
- DSCR +6.0/10.0
- 1% rule +4.7/10.0
- Schools +3.9/10.0
- Rent growth +3.4/5.0
- Livability +3.0/5.0
- Condition / age +2.5/5.0
- Appreciation +0.0/10.0
$179,999
🖨 Deal sheet (PDF) 📄 Offer letter ✓ Due diligence
Listing remarks MLS
Ideally situated in a superb location, Townside Square is a real family community offering easy access to Interstate 65, Grand shopping and just minutes from the University of Montevallo. Perfect for entertaining. It's nearly impossible to not fall in love with this open floor plan. Offering 3 bedrooms and 2 baths with a true laundry room.
Key facts
- $25 HOA
- Built 2015
- Listed 38 days
Property features AI
Finance
- Other: Library fee included
- Financial info: Has down payment assistance
- HOA & community: Yearly association fee of $300 (covers common grounds maintenance)
Exterior
- Parking: Driveway parking; On-street parking; Uncovered parking
- Utilities: Public water; Connected sewer; Electric water heater; Underground utilities; Internet service available; Ceiling fans; LED lighting
- Home design: Existing construction; Siding (Hardiplank); Slab foundation; Tri-level: No (split-level home); Subdivision: Townside Square
- Construction: Hardiplank siding; Slab foundation
- Exterior features: Covered patio; Porch; Sidewalks; No pool; Not waterfront
Interior
- Kitchen: Laminate countertops; Island; Dishwasher (built-in); Electric oven; Electric stove
- Bedrooms: Master bedroom on main level; Additional bedrooms on main level
- Flooring: Carpet; Hardwood laminate; Tile flooring
- Bathrooms: Two full bathrooms; Tub/shower combo
- Heating & cooling: Central heating; Central cooling
- Interior features: Smooth ceilings; Recessed lighting; Island in kitchen; All window treatments remain; Split-level layout; Attic
- Laundry & utility: Laundry room on main level; Washer hookup; Electric dryer hookup
Neighborhood map
What this means for you Summary
Snapshot
- This is a 3-bed/2.0-bath townhouse listed at $180k.
Deal economics
- At list price, monthly cash flow is $189 ($2k/yr) — positive.
- The deal already cash-flows at list — no discount required.
- To meet the 1% rule (rent ≥ 1% of price), the offer needs to be $174k (3.5% below list).
- Recommended offer: $174k (3.5% below list) — sets the bar for 1% rule.
- Cap rate 7.6% vs local median 4.5% in Calera — top-decile yield for the area; either an underpriced asset or a hidden risk that comps aren't pricing in. Stress-test before assuming the spread holds.
Location & tenants
- Location reads 59/100 on livability (#325 in AL) — a working-class tenant base; expect higher turnover. Strengths: cost of living A+, housing A+, employment A-; Watch: amenities F, commute F, health & safety F.
- Shelby County (suburban): math 30% / reading 58% proficiency, ranked #16 of 129 in AL (top 12%) — families likely to look elsewhere, expect single-tenant / working-renter base with shorter leases.
- Zoned schools: Calera Elementary (752 students, 64% FRL); Calera Middle (math 9% / reading 45%, grade F, #147 of 257 statewide, top 58%, 755 students, 61% FRL); Calera High (math 18% / reading 21%, grade F, #169 of 305 statewide, top 59%, 1,066 students, 59% FRL) — zoned schools average 62% FRL vs 26% district-wide (36 pts higher); higher-poverty schools than district average — tighter screening recommended.
- Zoned-school proficiency averages 23% at this address vs 44% district-wide (-21 pts) — the specific schools serving this property underperform the Shelby County average; the district grade overstates school quality for this exact location.
- Market conditions: Rents rising (+3.7%/yr); 373 active listings in the ZIP; 8 comparable units currently listed for rent nearby; rentals leasing fast (median 12d on market — plan ~1-2 weeks tenant-placement turnaround); solid renter incomes; 987 units permitted in Shelby County in 2024 (0 in 5+ unit buildings).
Forward outlook
- Local home prices are declining (-3.0%/yr); year-one equity from $1k of loan paydown is wiped out by about $5k of value loss. Plan a longer hold.
- Shelby County population projected at +23% by 2050 — long-run rental-demand tailwind backs the buy-and-hold thesis.
Negotiation context
- It's been on market 38 days — a 3% lower offer ($175k) is reasonable based on typical stale-listing flexibility.
- 2 sale attempts since 11y ago with the ask held roughly flat each time — persistent listings suggest the price (not the market) is what's stuck; bring a comps-based counter.
- Current owner paid $129k; 40% above their basis — modest negotiation headroom, anchor on the comps not their cost.
Risks & watch-outs
- Climate carrying-cost: major wind risk, 55% chance of damaging wind over 30y; extreme-heat days projected 7→21/yr by 2055 (HVAC capex compounding) — expect insurance premiums to compound above CPI over the hold.
Questions for the listing agent
- It's been on market 38 days. Have you received any prior offers? Is the seller open to a 3% concession, seller financing, or rate buy-down credit?
- What does the HOA fee cover, when was the last increase, and are there any pending special assessments or reserve-fund shortfalls?
- Is there a deadline driving the sale (1031 exchange, divorce, estate, relocation)? That informs how much negotiation room exists.
- Schools are D-rated, which usually means shorter tenancies and higher turnover. Who's the typical renter profile here, and what's been the actual vacancy rate?
- What's the average days-on-market for RENTAL listings here right now (not sales)? A rising rental-DOM trend means longer vacancies and softer asking-rent achievability than the comps imply.
- What's the recent tenant-quality profile in this submarket — average credit score on applications, eviction rate, late-payment / NSF rate, and stable-employment percentage? A property-management company in the area should have these aggregated.
- How much new for-sale + rental construction is in the pipeline within 1–3 miles? Heavy new supply typically softens prices + rents 12–24 months out; constrained supply supports both.
Investment metrics
- 1% rule
- 0.97% ✗
- Cap rate
- 7.55%
- Cash-on-cash
- 4.50%
- DSCR
- 1.20
- GRM
- 8.6
CMA / ARV
- ARV (median comp)
- $203,723
- List price
- $179,999
- Delta
- -11.65%
- Verdict
- UNDERPRICED
- Comps
- 20 within 1.0 mi
Show comp detail 12 sales within ~0.75 mi
| Address | Dist | Beds/Ba | Sqft | Sold | Price | $/sf | Match |
|---|---|---|---|---|---|---|---|
| 204 The Heights Dr | 0.05mi | 2/2.0 (-1) | 1,107 (-0%) | 0mo | $185,000 | $167 | 92 |
| 169 The Heights Dr | 0.09mi | 3/2.0 | 1,080 (-3%) | 1mo | $179,900 | $167 | 90 |
| 213 The Heights Dr | 0.03mi | 3/2.0 | 1,095 (-2%) | 11mo | $195,000 | $178 | 87 |
| 558 The Heights Ln | 0.15mi | 3/2.0 | 1,080 (-3%) | 3mo | $185,000 | $171 | 86 |
| 578 The Heights Ln | 0.13mi | 3/2.0 | 1,080 (-3%) | 9mo | $183,000 | $169 | 82 |
| 554 The Heights Ln | 0.15mi | 3/2.0 | 1,080 (-3%) | 9mo | $190,000 | $176 | 80 |
| 212 The Heights Dr | 0.04mi | 2/2.0 (-1) | 1,087 (-2%) | 14mo | $197,000 | $181 | 78 |
| 225 The Heights Dr | 0.02mi | 3/2.5 | 1,244 (+12%) | 11mo | $191,500 | $154 | 68 |
| 2047 Rossburg Pl | 0.37mi | 2/2.0 (-1) | 1,072 (-4%) | 10mo | $183,000 | $171 | 63 |
| 651 The Heights Ln | 0.06mi | 2/2.5 (-1) | 1,184 (+6%) | 21mo | $199,900 | $169 | 62 |
| 639 The Heights Ln | 0.06mi | 2/2.5 (-1) | 1,230 (+11%) | 18mo | $189,900 | $154 | 58 |
| 100 Little John Cir | 0.30mi | 2/2.0 (-1) | 1,264 (+14%) | 4mo | $189,900 | $150 | 54 |
Match score weights: distance 35% · size 25% · config 20% · recency 20%. Top-matched comps best support the ARV.
Projected returns pro-forma
-3.0% appreciation · 3.67% rent growth · sell at horizon
- IRR
- -8.6%
- Equity multiple
- 0.68×
- Total profit
- $-15,971
- Equity at exit
- $26,838
- IRR
- 1.7%
- Equity multiple
- 1.13×
- Total profit
- $6,443
- Equity at exit
- $15,563
Cash invested: $50,400 (down + closing). Projections, not guarantees.
Landlord ↔ Tenant lean methodology
- Overall (STATE)
- 90 Strongly Landlord-Friendly
- State Alabama
- 90 Strongly Landlord-Friendly · R+15
- County
- — inherits STATE
- City
- — inherits STATE
ZIP-level market 35040
- Home prices YoY
- -16.5%
- Rents YoY
- 3.7%
- Active inventory
- 373
- Price-to-rent
- 8.6×
Monthly cashflow live
- Estimated rent
- $1,738 high interval (Pro) →
- Mortgage (P&I)
- −$944
- Tax from tax record
- −$140 /mo · $1,680/yr
- Insurance
- −$75
- HOA
- −$25
- Vacancy / Maint / Mgmt
- −$365
- Net cashflow
- $189
Break-even live
Sensitivity live
| Price | -10% $291 | -5% $240 | +0% $189 | +5% $138 | +10% $87 |
|---|---|---|---|---|---|
| Rent | -10% $52 | -5% $120 | +0% $189 | +5% $257 | +10% $326 |
| Rate | -1.0pp $279 | -0.5pp $235 | base $189 | +0.5pp $142 | +1.0pp $95 |
UW: 25.0% down · 7.5% · 30yr · 1.5% tax · 5.0% vac · 8.0% maint · 8.0% mgmt
Financing live
Cash to close
- Down payment
- $45,000
- Closing costs
- $5,400
- Reserves months
- —
- Total cash needed
- —
Loan-product check · same deal, 3 products live
Conventional
25% down · 7.5% · 30yr
- Down + closing
- —
- Monthly P&I
- —
- Monthly cashflow
- —
- DSCR
- —
- Eligible?
- —
Personal DTI + credit; lowest rate.
DSCR
20% down · 8.5% · 30yr
- Down + closing
- —
- Monthly P&I
- —
- Monthly cashflow
- —
- DSCR
- —
- Eligible?
- —
No personal income docs; deal must DSCR.
Hard money
10% down · 12.0% · 12mo
- Down + closing
- —
- Monthly P&I
- —
- Monthly cashflow
- —
- DSCR
- —
- Eligible?
- —
Short-term bridge; refi at stabilization.
Rent comps 8 comps
| Address | Beds | Baths | Sqft | Rent | $/sqft | DOM | Units | Dist |
|---|---|---|---|---|---|---|---|---|
| 699 The Heights Ln Calera, AL | 2.0 | 2.5 | 1100 | $1,400 | $1.27 | 12d | 1 | 0.06mi |
| 680 The Heights Ln Calera, AL | 3.0 | 2.5 | 1397 | $1,750 | $1.25 | 3d | 1 | 0.08mi |
| 192 Stonecreek Pl Calera, AL | 3.0 | 2.0 | 1220 | $1,738 | $1.42 | 5d | 1 | 0.11mi |
| 2027 Rossburg Pl Calera, AL | 2.0 | 2.0 | 1073 | $1,300 | $1.21 | 25d | 1 | 0.37mi |
| 2000 Rossburg Pl Calera, AL | 2.0 | 2.0 | 1142 | $1,500 | $1.31 | 5d | 1 | 0.38mi |
| 115 Charlton Ln Calera, AL | 3.0 | 2.0 | 1367 | $1,695 | $1.24 | 45d | 1 | 0.63mi |
| 916 Daventry Trl Calera, AL | 3.0 | 2.0 | 1331 | $1,550 | $1.16 | 3d | 1 | 0.66mi |
| 446 Savannah Cv Calera, AL | 3.0 | 2.0 | 1492 | $1,800 | $1.21 | 25d | 1 | 1.01mi |
HOA detail
- Monthly dues
- $25 · $300/yr
Listing history 25 events
-
2026-06-21days on market $179,999 Active 38 DOM
-
2026-06-18days on market $179,999 Active 35 DOM
-
2026-06-17days on market $179,999 Active 34 DOM
-
2026-06-16days on market $179,999 Active 33 DOM
-
2026-06-15days on market $179,999 Active 32 DOM
-
2026-06-13days on market $179,999 Active 30 DOM
-
2026-06-13days on market $179,999 Active 29 DOM
-
2026-06-10days on market $179,999 Active 27 DOM
-
2026-06-09days on market $179,999 Active 26 DOM
-
2026-06-08days on market $179,999 Active 25 DOM
-
2026-06-07days on market $179,999 Active 24 DOM
-
2026-06-05days on market $179,999 Active 21 DOM
-
2026-06-03days on market $179,999 Active 20 DOM
-
2026-06-02days on market $179,999 Active 19 DOM
-
2026-06-01days on market $179,999 Active 18 DOM
-
2026-05-31days on market $179,999 Active 17 DOM
-
2026-05-14$179,999 Active 484-char remark
-
2026-05-07historical $179,999 484-char remark
-
2026-01-30price $176,000
-
2026-01-21price $181,000
-
2022-12-06historical
-
2020-01-08soldstatus $129,000
-
2015-04-21soldstatus $110,775
Show marketing remark (341 chars)
Ideally situated in a superb location, Townside Square is a real family community offering easy access to Interstate 65, Grand shopping and just minutes from the University of Montevallo. Perfect for entertaining. It's nearly impossible to not fall in love with this open floor plan. Offering 3 bedrooms and 2 baths with a true laundry room.
-
2015-02-12historical
Show marketing remark (341 chars)
Ideally situated in a superb location, Townside Square is a real family community offering easy access to Interstate 65, Grand shopping and just minutes from the University of Montevallo. Perfect for entertaining. It's nearly impossible to not fall in love with this open floor plan. Offering 3 bedrooms and 2 baths with a true laundry room.
-
2015-01-01$109,575
Show marketing remark (341 chars)
Ideally situated in a superb location, Townside Square is a real family community offering easy access to Interstate 65, Grand shopping and just minutes from the University of Montevallo. Perfect for entertaining. It's nearly impossible to not fall in love with this open floor plan. Offering 3 bedrooms and 2 baths with a true laundry room.
ⓘ Source: listings_history table (triggers on properties + properties_extension) + one-shot
backfill from property_details.listing_events for pre-trigger history.
Tax reassessment forecast AL · Resets to sale price
- Current annual tax
- $1,680 · $140/mo
- Projected year-2 tax
- $1,680 · $140/mo
- Expected delta
- $0/yr ($0/mo · 0.0%)
ⓘ Screening estimate from a state-policy table — verify with the county assessor before closing.
Climate risk First Street
- Flood 1/10 Low FEMA zone X (unshaded) · 0% chance over 30 yrs
- Wildfire 4/10 Moderate
- Heat 7/10 Severe 7 d/yr ≥106°F today · 21 d/yr by 30 yrs out
- Wind 6/10 Major 55% chance of damaging wind over 30 yrs
- Air quality 2/10 Low 2 unhealthy d/yr today · 2 by 30 yrs out
Nearby sold comps map
Loading sold comps map…
Walkable amenities ~0.75 mi
Loading nearby amenities…
Taxation est. · year 1
- Rental income
- $20,853
- − Mortgage interest
- −$10,083
- − Property taxes
- −$1,680
- − Insurance
- −$900
- − Repairs & maintenance
- −$1,668
- − Management
- −$1,668
- − HOA
- −$300
- − Depreciation
- −$5,236
- Taxable loss
- −$683
- Est. tax savings @ 24.0%
- +$164
- After-tax cash flow
- $2,430/yr
For passive investors: Depreciation is non-cash, so a rental often shows a tax loss while cash-flowing — sheltering income. Rental losses are passive: they offset passive income freely, and up to $25,000/yr can offset ordinary (W-2) income if you actively participate and your MAGI is under $100k (phasing out to $0 by $150k); unused losses carry forward. On sale, claimed depreciation is recaptured at up to 25%, and gains may owe capital-gains tax (a 1031 exchange can defer both). Figures are a year-1 estimate at your 24.0% rate — not tax advice; consult a CPA.
Schools (NCES district)
- District
- Shelby County
- NCES district ID
- 0103030
- Math proficiency
- 30% ▼ -28.00%
- Reading proficiency
- 58% ▲ 2.00%
- Median HH income
- $66,672
- Composite
- 39.29/100
- National rank
- #3995
- State rank
- #16 of 129 in AL
Livability — Calera
- Score
- 59/100
- State rank
- #325
- US rank
- #19917
Category grades
Schools grade is shown separately in the Schools card above.
Census & demographics
- Census place
- Calera, AL
- County
- Shelby County · 188,970 people
- City population
- 19,304
- Metro
- Birmingham-Hoover, AL
- Population (ZIP)
- 19,304
- Household income
- $84,554
- Rent vs Own
- Severe rent burden
- 388.0
Population outlook (Shelby County) Hauer SSP2
- Today (2025)
- 237,024 people
- By 2030
- 249,868 · +5.4%
- By 2040
- 272,778 · +15.1%
- By 2050
- 291,062 · +22.8%
- By 2075
- 326,049 · +37.6%
- By 2100
- 335,870 · +41.7%
Race, ethnicity, and origin ACS 2023
- Neighborhood character
- Diverse neighborhood (Simpson 0.56)
- Race & ethnicity
- White 59% Black 30% Hispanic / Latino 9% Two or more races 3%
- Hispanic origin (detail)
- Mexican 7%
- Common ancestry
- Slovak 3% Italian 1% Serbian 1%
- Foreign-born
- 6% · Canada, China
- Languages at home
- 91% English-only · Spanish 6% Arabic 1% Chinese 1%
Political lean MEDSL · Shelby
- 2024 margin
- Solid R (+40.9) · D 29.0% · R 69.9% · Other 1.1%
- 2008→2024 swing
- +12.6pp toward D · 2008: -53.4pp · 2024: -40.9pp
- All cycles
- 2024: R+40.9 2020: R+40.4 2016: R+50.3 2012: R+55.6 2008: R+53.4
Not yet ingested
- Civics
- —
Market trends
- HPI YoY
- ▼ -43.58%
- Current HPI
- 220.2843
- Rent YoY
- ▲ 3.67%
- Metro
- Birmingham-Hoover, AL
- State GDP YoY
- ▲ 2.94%
- F500 in state
- 4
Industry mix (Fortune 500 HQ in AL)
| Industry | F500 HQs | Revenue |
|---|---|---|
| Financial Services | 1 | $8B |
|
||
| Healthcare | 1 | $5B |
|
||
Price history
+64.3% since first listed9 events — show timeline
- 2026-05-14 Listed $179,999 Greater Alabama MLS
- 2026-05-07 Coming Soon $179,999 Greater Alabama MLS
- 2026-01-30 Price Changed $176,000 Greater Alabama MLS
- 2026-01-21 Price Changed $181,000 Greater Alabama MLS
- 2022-12-06 Rental Removed — RENT.
- 2020-01-08 Sold (Public Records) $129,000 Public Records
- 2015-04-21 Sold (MLS) $110,775 Greater Alabama MLS
- 2015-02-12 Delisted — Greater Alabama MLS
- 2015-01-01 Listed $109,575 Greater Alabama MLS
Property tax history
+6.1%/yrLatest (2025): $1,680 · +1.1% YoY. Source: county tax records.
Cash-flow waterfall
monthlySold comps — $/sqft
last 12 mo · ≤1 miLoading sold comps…