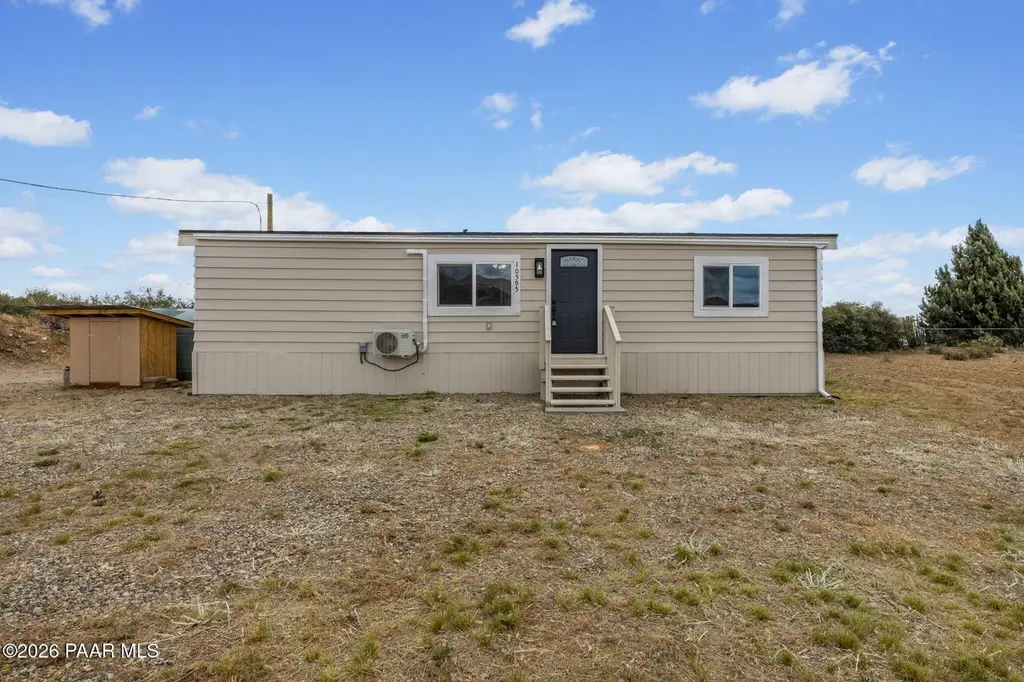
10595 S Saguaro Dr · Mayer, AZ
Flood risk 1/10 · Minimal
- FEMA flood zone
- X (unshaded)
- Chance of flooding over 30 yrs
- 0.0%
- Est. flood insurance / yr
- $507 – $1,088
Fire risk 7/10 · Major
- Est. fire insurance / yr
- $610 – $1,132
Heat risk 5/10 · Moderate
- Hot days now (above 97°F)
- 7 days/yr
- Hot days in 30 yrs
- 18 days/yr
Wind risk 1/10 · Minimal
- Chance of severe wind over 30 yrs
- —
Air-quality risk 1/10 · Minimal
- Unhealthy air days now
- 0 days/yr
- Unhealthy air days in 30 yrs
- 0 days/yr
Risk factors via First Street. Map © Google.
Why this score? — see what drove the D+ grade
The composite is a weighted blend of 9 inputs, each scored 0–100. Each bar is that input's sub-score; the figure is the points it added to the 100-point composite (weight × sub-score).
- Cash flow +13.7/30.0
- Appreciation +10.0/10.0
- ARV discount +7.8/15.0
- DSCR +4.2/10.0
- 1% rule +3.9/10.0
- Livability +3.1/5.0
- Rent growth +2.5/5.0
- Condition / age +2.5/5.0
- Schools +2.0/10.0
$214,000
🖨 Deal sheet (PDF) 📄 Offer letter ✓ Due diligence
Listing remarks
Welcome to 10595 S Saguaro Drive! A beautifully renovated 3 bedroom, 2 bathroom home packed with upgrades and move-in ready! Featuring a brand new roof, fresh interior and exterior paint, new windows and sliding glass door, and stylish LPV flooring throughout. The stunning kitchen offers quartz countertops, brand new stainless steel appliances and flows perfectly into the living spaces, while the luxurious bathrooms add a modern touch you'll love. Situated on a spacious . 42-acre lot with plenty of room to enjoy, all offered at an incredible price!
Key facts
- 0.42 acre lot
- Built 1980
- Listed 45 days
Property features AI
Finance
- Other: Lot size approximately 0.42 acre; County road frontage with dirt road surface; Zoned R1-18
- HOA & community: Not a senior community
Exterior
- Parking: Driveway parking
- Security: Smoke detectors
- Utilities: Electric water heater; Electricity available; Hauled water; Septic system (conventional); Cistern water source
- Home design: Residential manufactured home; Double wide; Single-story
- Construction: Frame construction; Composition roof; Piers foundation
- Exterior features: Enclosed patio/porch; Dirt driveway; Native landscaping; Shed(s); Partial fencing; Level lot with rural views
Interior
- Kitchen: Electric cooktop; Electric range; Microwave; Refrigerator
- Flooring: Laminate flooring
- Bathrooms: 2 full bathrooms
- Heating & cooling: Mini-split heating; Ceiling fan cooling
- Interior features: Ceiling fans; Formal dining area; Kitchen/dining combo; Living/dining combo; Single-level living; Pantry; Quartz countertops; Washer/dryer connection
- Laundry & utility: Dedicated laundry room; Washer/dryer connection
Neighborhood map
What this means for you Summary
Snapshot
- This is a 3-bed/2.0-bath manufactured listed at $214k.
Deal economics
- At list price, monthly cash flow is $17 ($209/yr) — positive.
- The deal already cash-flows at list — no discount required.
- To meet the 1% rule (rent ≥ 1% of price), the offer needs to be $189k (11.5% below list).
- Recommended offer: $189k (11.5% below list) — sets the bar for 1% rule.
Location & tenants
- Location reads 62/100 on livability (#147 in AZ) — a middle-class / working-renter tenant base. Strengths: cost of living A+, housing A, crime A-; Watch: amenities F, commute F, employment F.
- Mayer Unified School District (4473) (rural): math 23% / reading 26% proficiency, ranked #165 of 249 in AZ (top 66%) — low school quality limits family demand, transient renter base, plan for 1-2y turnover; 80% free/reduced lunch — lower-income household profile, screen leases tightly.
- Zoned schools: Mayer Elementary School (math 26% / reading 32%, grade F, #570 of 1,109 statewide, top 52%, 373 students, 93% FRL); Mayer High School (math 5% / reading 5%, grade F, #364 of 381 statewide, top 100%, 200 students, 66% FRL) — zoned schools at 79% FRL track the district average.
- Market conditions: 244 active listings in the ZIP; 2,062 units permitted in Yavapai County in 2024 (98 in 5+ unit buildings).
Forward outlook
- In year one you build about $23k of equity ($1k loan paydown + $21k appreciation (10.0% local appreciation)).
- Yavapai County population projected at +10% by 2050 — modest demand growth; plan on rents tracking national, not racing it.
- At projected returns (10.0% appreciation + 3.0% rent growth), your $60k cash investment doubles in ~3 years — after that, you're playing with house money.
- By year 2, paydown + projected appreciation supports a ~$37k cash-out refi (75% LTV) — recoverable capital for the next deal without selling this one.
Negotiation context
- It's been on market 45 days — a 3% lower offer ($208k) is reasonable based on typical stale-listing flexibility.
- Current owner paid $32k; list at $214k implies a 569% gain — meaningful room to come down on a strong offer.
Risks & watch-outs
- Climate carrying-cost: major wildfire risk; extreme-heat days projected 7→18/yr by 2055 (HVAC capex compounding) — expect insurance premiums to compound above CPI over the hold.
Questions for the listing agent
- It's been on market 45 days. Have you received any prior offers? Is the seller open to a 11% concession, seller financing, or rate buy-down credit?
- Is there a deadline driving the sale (1031 exchange, divorce, estate, relocation)? That informs how much negotiation room exists.
- Schools are F-rated, which usually means shorter tenancies and higher turnover. Who's the typical renter profile here, and what's been the actual vacancy rate?
- The area grade is low — what's the realistic commute time and amenity access for the typical tenant pool here? Any planned neighborhood developments (good or bad) we should know about?
- What's the average days-on-market for RENTAL listings here right now (not sales)? A rising rental-DOM trend means longer vacancies and softer asking-rent achievability than the comps imply.
- What's the recent tenant-quality profile in this submarket — average credit score on applications, eviction rate, late-payment / NSF rate, and stable-employment percentage? A property-management company in the area should have these aggregated.
- How much new for-sale + rental construction is in the pipeline within 1–3 miles? Heavy new supply typically softens prices + rents 12–24 months out; constrained supply supports both.
Investment metrics
- 1% rule
- 0.89% ✗
- Cap rate
- 6.39%
- Cash-on-cash
- 0.35%
- DSCR
- 1.02
- GRM
- 9.4
CMA / ARV
- ARV (on-the-fly)
- $215,424
- Comps found
- 3
Show comp detail 3 sales within ~0.75 mi
| Address | Dist | Beds/Ba | Sqft | Sold | Price | $/sf | Match |
|---|---|---|---|---|---|---|---|
| 13667 E Scooter Ln | 0.33mi | 2/2.0 (-1) | 1,056 (0%) | 19mo | $215,000 | $204 | 64 |
| 12871 E Central Ave | 0.75mi | 3/2.0 | 1,107 (+5%) | 21mo | $179,900 | $163 | 39 |
| 12854 E Main St | 0.73mi | 2/2.0 (-1) | 900 (-15%) | 14mo | $227,000 | $252 | 24 |
Match score weights: distance 35% · size 25% · config 20% · recency 20%. Top-matched comps best support the ARV.
Projected returns pro-forma
10.0% appreciation · 3.0% rent growth · sell at horizon
- IRR
- 24.5%
- Equity multiple
- 2.96×
- Total profit
- $117,688
- Equity at exit
- $192,788
- IRR
- 21.7%
- Equity multiple
- 6.77×
- Total profit
- $345,757
- Equity at exit
- $415,755
Cash invested: $59,920 (down + closing). Projections, not guarantees.
Landlord ↔ Tenant lean methodology
- Overall (STATE)
- 87 Strongly Landlord-Friendly
- State Arizona
- 87 Strongly Landlord-Friendly · R+3
- County
- — inherits STATE
- City
- — inherits STATE
ZIP-level market 86333
- Home prices YoY
- 17.3%
- Active inventory
- 244
- Price-to-rent
- 9.4×
Monthly cashflow live
- Estimated rent
- $1,894 medium interval (Pro) →
- Mortgage (P&I)
- −$1,122
- Tax est. 1.5%
- −$268 /mo · $3,210/yr
- Insurance
- −$89
- HOA
- −$0
- Vacancy / Maint / Mgmt
- −$398
- Net cashflow
- $17
Break-even live
Sensitivity live
| Price | -10% $165 | -5% $91 | +0% $17 | +5% $-57 | +10% $-130 |
|---|---|---|---|---|---|
| Rent | -10% $-132 | -5% $-57 | +0% $17 | +5% $92 | +10% $167 |
| Rate | -1.0pp $125 | -0.5pp $72 | base $17 | +0.5pp $-38 | +1.0pp $-94 |
UW: 25.0% down · 7.5% · 30yr · 1.5% tax · 5.0% vac · 8.0% maint · 8.0% mgmt
Financing live
Cash to close
- Down payment
- $53,500
- Closing costs
- $6,420
- Reserves months
- —
- Total cash needed
- —
Loan-product check · same deal, 3 products live
Conventional
25% down · 7.5% · 30yr
- Down + closing
- —
- Monthly P&I
- —
- Monthly cashflow
- —
- DSCR
- —
- Eligible?
- —
Personal DTI + credit; lowest rate.
DSCR
20% down · 8.5% · 30yr
- Down + closing
- —
- Monthly P&I
- —
- Monthly cashflow
- —
- DSCR
- —
- Eligible?
- —
No personal income docs; deal must DSCR.
Hard money
10% down · 12.0% · 12mo
- Down + closing
- —
- Monthly P&I
- —
- Monthly cashflow
- —
- DSCR
- —
- Eligible?
- —
Short-term bridge; refi at stabilization.
Listing history 20 events
-
2026-06-22days on market $214,000 Active 45 DOM
-
2026-06-18days on market $214,000 Active 42 DOM
-
2026-06-17price $214,000 Active 41 DOM
-
2026-06-17days on market $219,000 Active 41 DOM
-
2026-06-16days on market $219,000 Active 40 DOM
-
2026-06-15days on market $219,000 Active 39 DOM
-
2026-06-14days on market $219,000 Active 37 DOM
-
2026-06-13days on market $219,000 Active 36 DOM
-
2026-06-10days on market $219,000 Active 34 DOM
-
2026-06-09days on market $219,000 Active 33 DOM
-
2026-06-08days on market $219,000 Active 32 DOM
-
2026-06-07pricedays on market $219,000 Active 31 DOM
-
2026-06-03days on market $224,000 Active 27 DOM
-
2026-06-02days on market $224,000 Active 26 DOM
-
2026-06-01days on market $224,000 Active 25 DOM
-
2026-05-31days on market $224,000 Active 24 DOM
-
2026-05-30days on market $224,000 Active 23 DOM
-
2026-05-21price $224,000
-
2026-05-07$229,000 Active
-
2024-11-08soldstatus $32,000
ⓘ Source: listings_history table (triggers on properties + properties_extension) + one-shot
backfill from property_details.listing_events for pre-trigger history.
Climate risk First Street
- Flood 1/10 Low FEMA zone X (unshaded) · 0% chance over 30 yrs
- Wildfire 7/10 Severe
- Heat 5/10 Major 7 d/yr ≥97°F today · 18 d/yr by 30 yrs out
- Wind 1/10 Low
- Air quality 1/10 Low 0 unhealthy d/yr today · 0 by 30 yrs out
Nearby sold comps map
Loading sold comps map…
Walkable amenities ~0.75 mi
Loading nearby amenities…
Taxation est. · year 1
- Rental income
- $22,729
- − Mortgage interest
- −$11,987
- − Property taxes
- −$3,210
- − Insurance
- −$1,070
- − Repairs & maintenance
- −$1,818
- − Management
- −$1,818
- − Depreciation
- −$6,225
- Taxable loss
- −$3,400
- Est. tax savings @ 24.0%
- +$816
- After-tax cash flow
- $1,025/yr
For passive investors: Depreciation is non-cash, so a rental often shows a tax loss while cash-flowing — sheltering income. Rental losses are passive: they offset passive income freely, and up to $25,000/yr can offset ordinary (W-2) income if you actively participate and your MAGI is under $100k (phasing out to $0 by $150k); unused losses carry forward. On sale, claimed depreciation is recaptured at up to 25%, and gains may owe capital-gains tax (a 1031 exchange can defer both). Figures are a year-1 estimate at your 24.0% rate — not tax advice; consult a CPA.
Schools (NCES district)
- District
- Mayer Unified School District (4473)
- NCES district ID
- 0404820
- Math proficiency
- 23% ▼ -11.00%
- Reading proficiency
- 26% ▼ -13.00%
- Median HH income
- $35,108
- Composite
- 20.22/100
- National rank
- #8627
- State rank
- #165 of 249 in AZ
Livability — Mayer
- Score
- 62/100
- State rank
- #147
- US rank
- #17284
Category grades
Schools grade is shown separately in the Schools card above.
Census & demographics
- Census place
- Mayer, AZ
- Population (ZIP)
- 6,425
Population outlook (Yavapai County) Hauer SSP2
- Today (2025)
- 241,389 people
- By 2030
- 249,523 · +3.4%
- By 2040
- 259,966 · +7.7%
- By 2050
- 264,736 · +9.7%
- By 2075
- 269,334 · +11.6%
- By 2100
- 256,505 · +6.3%
Race, ethnicity, and origin ACS 2023
- Neighborhood character
- Predominantly White (77%)
- Race & ethnicity
- White 77% Two or more races 15% Hispanic / Latino 14%
- Hispanic origin (detail)
- Mexican 11% Puerto Rican 1%
- Common ancestry
- Lithuanian 6% Iranian 3% Romanian 3%
- Foreign-born
- 5% · Canada
- Languages at home
- 93% English-only · Spanish 6% Russian/Polish/Slavic 1%
Political lean MEDSL · Yavapai
- 2024 margin
- Solid R (+33.9) · D 32.6% · R 66.5%
- 2008→2024 swing
- -9.5pp toward R · 2008: -24.4pp · 2024: -33.9pp
- All cycles
- 2024: R+33.9 2020: R+29.3 2016: R+31.4 2012: R+30.7 2008: R+24.4
Not yet ingested
- Civics
- —
Market trends
- HPI YoY
- ▲ 55.51%
- Current HPI
- 376.0374
- Rent YoY
- —
- Metro
- —
- State GDP YoY
- ▲ 4.54%
- F500 in state
- 20
Industry mix (Fortune 500 HQ in AZ)
| Industry | F500 HQs | Revenue |
|---|---|---|
| Technology | 2 | $13B |
|
||
| Mining / Metals | 1 | $23B |
|
||
| Environmental Services | 1 | $16B |
|
||
| Metals / Steel | 1 | $14B |
|
||
| Technology Distribution | 1 | $9B |
|
||
| Homebuilding | 1 | $8B |
|
||
Price history
+600.0% since first listed3 events — show timeline
- 2026-05-21 Price Changed $224,000 PAARMLS as Distributed by MLS Grid
- 2026-05-07 Listed $229,000 PAARMLS as Distributed by MLS Grid
- 2024-11-08 Sold (Public Records) $32,000 Public Records
Property tax history
+4.5%/yrLatest (2025): $116 · +24.1% YoY. Source: county tax records.
Cash-flow waterfall
monthlySold comps — $/sqft
last 12 mo · ≤1 miLoading sold comps…