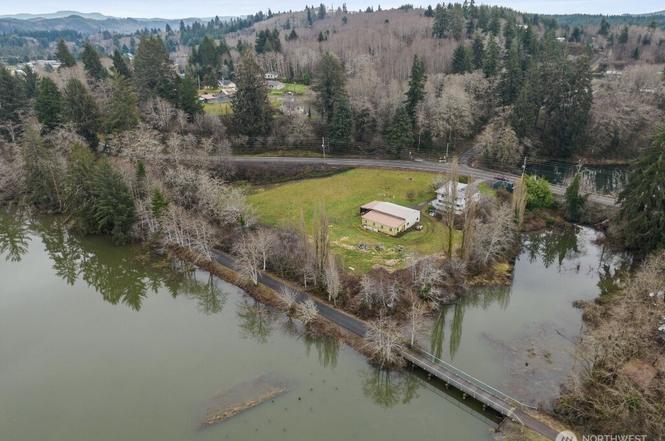
1632 Henkle St · Raymond, WA
Flood risk 7/10 · Major
- FEMA flood zone
- X (unshaded)
- Chance of flooding over 30 yrs
- 0.74%
- Est. flood insurance / yr
- $473 – $860
Fire risk 1/10 · Minimal
- Est. fire insurance / yr
- $604 – $1,122
Heat risk 1/10 · Minimal
- Hot days now (above 82°F)
- 7 days/yr
- Hot days in 30 yrs
- 14 days/yr
Wind risk 1/10 · Minimal
- Chance of severe wind over 30 yrs
- —
Air-quality risk 6/10 · Moderate
- Unhealthy air days now
- 6 days/yr
- Unhealthy air days in 30 yrs
- 7 days/yr
Risk factors via First Street. Map © Google.
Why this score? — see what drove the C- grade
The composite is a weighted blend of 9 inputs, each scored 0–100. Each bar is that input's sub-score; the figure is the points it added to the 100-point composite (weight × sub-score).
- ARV discount +15.0/15.0
- Cash flow +14.9/30.0
- DSCR +4.6/10.0
- Livability +3.6/5.0
- Schools +3.5/10.0
- 1% rule +3.3/10.0
- Rent growth +2.5/5.0
- Condition / age +2.5/5.0
- Appreciation +1.1/10.0
$249,900
🖨 Deal sheet 📄 Offer letter ✓ Due diligence
Listing remarks
2.33 acres close to downtown Raymond. Situated in the city limits of Raymond this piece of waterfront is waiting for a new vision. The home is in need of much repair, it boasts 3096 sq ft of space. 1980 sq. Ft shop. Offers views of the Willapa River and tidelands. Short distance to downtown. All city utilities available.
Key facts
- Tidelands
- 2.33 acre lot
- Garage
Tags
Property features AI
Finance
- Financial info: Listing terms: Cash-out or Conventional
Exterior
- Parking: Attached carport; Detached garage; Covered parking for 4 vehicles; Garage area approximately 1,980 square feet
- Security: Partially fenced
- Utilities: Public water (City of Raymond); Sewer connected (City of Raymond); Electric service (PUD #2); Internet: Xfinity
- Home design: Single family residence; Two stories with basement; Built on lot; House structure; Built circa 1910 (effective year); Has a view; Main entry
- Construction: Wood construction; Composition roof; Foundation: block and pillar/post/pier
- Exterior features: Wood exterior; Wood products; Fruit trees and garden space; High-speed internet available; Paved site
Interior
- Kitchen: Kitchen with eating space
- Bedrooms: 5 bedrooms (4 upper, 1 main); Bonus room on lower level
- Flooring: Softwood; Vinyl; Carpet
- Bathrooms: 2 full bathrooms; 2 bathtubs; 2 showers
- Heating & cooling: Baseboard heating; No cooling
- Interior features: Water heater; Partially finished basement; Partially fenced
- Laundry & utility: Utility room (main level); Electric water heater in basement
Neighborhood map
What this means for you Summary
Snapshot
- This is a 5-bed/3.0-bath single-family listed at $250k.
Deal economics
- At list price, monthly cash flow is $19 ($231/yr) — positive.
- The deal already cash-flows at list — no discount required.
- To meet the 1% rule (rent ≥ 1% of price), the offer needs to be $208k (16.9% below list).
- Recommended offer: $208k (16.9% below list) — sets the bar for 1% rule.
- Cap rate 6.7% vs local median 4.0% in Raymond — top-decile yield for the area; either an underpriced asset or a hidden risk that comps aren't pricing in. Stress-test before assuming the spread holds.
Location & tenants
- Location reads 72/100 on livability (#212 in WA) — a middle-class / working-renter tenant base. Strengths: crime A+, cost of living A+, housing A+; Watch: schools D+, commute F.
- Raymond School District (rural): math 30% / reading 48% proficiency, ranked #231 of 291 in WA (top 79%) — families likely to look elsewhere, expect single-tenant / working-renter base with shorter leases.
- Market conditions: 91 active listings in the ZIP; 90 units permitted in Pacific County in 2024 (0 in 5+ unit buildings).
Forward outlook
- Local home prices are declining (-3.0%/yr); year-one equity from $2k of loan paydown is wiped out by about $7k of value loss. Plan a longer hold.
- Pacific County population projected at -10% by 2050 — secular population decline; favor cash flow + early exit over multi-decade hold.
Negotiation context
- It's been on market 156 days — a 12% lower offer ($220k) is reasonable based on typical stale-listing flexibility.
Risks & watch-outs
- Watch-outs: flood insurance adds $56/mo; built in 1910 — expect roof / HVAC / electrical / plumbing capex.
- Climate carrying-cost: major flood risk — expect insurance premiums to compound above CPI over the hold.
Questions for the listing agent
- It's been on market 156 days. Have you received any prior offers? Is the seller open to a 17% concession, seller financing, or rate buy-down credit?
- Built in 1910 — when were the roof, HVAC, electrical panel, plumbing, and water heater last replaced?
- What's the actual annual flood-insurance premium (NFIP or private), and is the property in a SFHA with mandatory coverage?
- Why hasn't it sold? Are there any deal-killer items the seller is aware of (foundation, flood, title, zoning, code violations)?
- Is there a deadline driving the sale (1031 exchange, divorce, estate, relocation)? That informs how much negotiation room exists.
- Schools are D-rated, which usually means shorter tenancies and higher turnover. Who's the typical renter profile here, and what's been the actual vacancy rate?
- What's the average days-on-market for RENTAL listings here right now (not sales)? A rising rental-DOM trend means longer vacancies and softer asking-rent achievability than the comps imply.
- What's the recent tenant-quality profile in this submarket — average credit score on applications, eviction rate, late-payment / NSF rate, and stable-employment percentage? A property-management company in the area should have these aggregated.
- How much new for-sale + rental construction is in the pipeline within 1–3 miles? Heavy new supply typically softens prices + rents 12–24 months out; constrained supply supports both.
Investment metrics
- 1% rule
- 0.83% ✗
- Cap rate
- 6.65%
- Cash-on-cash
- 1.28%
- DSCR
- 1.06
- GRM
- 10.0
CMA / ARV
- ARV (on-the-fly)
- $427,248
- Comps found
- 2
Show comp detail 2 sales within ~0.75 mi
| Address | Dist | Beds/Ba | Sqft | Sold | Price | $/sf | Match |
|---|---|---|---|---|---|---|---|
| 2225 Henkle St | 0.46mi | 5/3.0 | 2,940 (-5%) | 24mo | $400,000 | $136 | 50 |
| 421 12th St | 0.71mi | 4/2.0 (-1) | 3,258 (+5%) | 22mo | $450,000 | $138 | 31 |
Match score weights: distance 35% · size 25% · config 20% · recency 20%. Top-matched comps best support the ARV.
Projected returns pro-forma
-3.0% appreciation · 3.0% rent growth · sell at horizon
- IRR
- -15.8%
- Equity multiple
- 0.44×
- Total profit
- $-39,300
- Equity at exit
- $37,261
- IRR
- -7.4%
- Equity multiple
- 0.53×
- Total profit
- $-32,775
- Equity at exit
- $21,607
Cash invested: $69,972 (down + closing). Projections, not guarantees.
Landlord ↔ Tenant lean methodology
- Overall (STATE)
- 28 Tenant-Leaning
- State Washington
- 28 Tenant-Leaning · D+8
- County
- — inherits STATE
- City
- — inherits STATE
ZIP-level market 98577
- Home prices YoY
- -2.8%
- Active inventory
- 91
- Price-to-rent
- 10.0×
Monthly cashflow live
- Estimated rent
- $2,078 medium interval (Pro) →
- Mortgage (P&I)
- −$1,311
- Tax from tax record
- −$152 /mo · $1,822/yr
- Insurance
- −$104
- Flood insurance flood zone
- −$56 /mo · $666/yr
- HOA
- −$0
- Vacancy / Maint / Mgmt
- −$436
- Net cashflow
- $19
Break-even live
UW: 25.0% down · 7.5% · 30yr · 1.5% tax · 5.0% vac · 8.0% maint · 8.0% mgmt
Financing live
Cash to close
- Down payment
- $62,475
- Closing costs
- $7,497
- Reserves months
- —
- Total cash needed
- —
Loan-product check · same deal, 3 products live
Conventional
25% down · 7.5% · 30yr
- Down + closing
- —
- Monthly P&I
- —
- Monthly cashflow
- —
- DSCR
- —
- Eligible?
- —
Personal DTI + credit; lowest rate.
DSCR
20% down · 8.5% · 30yr
- Down + closing
- —
- Monthly P&I
- —
- Monthly cashflow
- —
- DSCR
- —
- Eligible?
- —
No personal income docs; deal must DSCR.
Hard money
10% down · 12.0% · 12mo
- Down + closing
- —
- Monthly P&I
- —
- Monthly cashflow
- —
- DSCR
- —
- Eligible?
- —
Short-term bridge; refi at stabilization.
Listing history 16 events
-
2026-06-18days on market $249,900 Active 156 DOM
-
2026-06-17days on market $249,900 Active 155 DOM
-
2026-06-16days on market $249,900 Active 154 DOM
-
2026-06-15days on market $249,900 Active 153 DOM
-
2026-06-15days on market $249,900 Active 152 DOM
-
2026-06-13days on market $249,900 Active 151 DOM
-
2026-06-12days on market $249,900 Active 150 DOM
-
2026-06-09days on market $249,900 Active 147 DOM
-
2026-06-08days on market $249,900 Active 146 DOM
-
2026-06-08days on market $249,900 Active 145 DOM
-
2026-06-05days on market $249,900 Active 143 DOM
-
2026-06-03days on market $249,900 Active 141 DOM
-
2026-06-02days on market $249,900 Active 140 DOM
-
2026-06-01days on market $249,900 Active 139 DOM
-
2026-05-31days on market $249,900 Active 138 DOM
-
2026-01-12$249,900 Active
ⓘ Source: listings_history table (triggers on properties + properties_extension) + one-shot
backfill from property_details.listing_events for pre-trigger history.
Tax reassessment forecast WA · Resets to sale price
- Current annual tax
- $1,822 · $152/mo
- Projected year-2 tax
- $2,449 · $204/mo
- Expected delta
- +$627/yr (+$52/mo · 34.4%)
ⓘ Screening estimate from a state-policy table — verify with the county assessor before closing.
Climate risk First Street
- Flood 7/10 Severe FEMA zone X (unshaded) · 74% chance over 30 yrs
- Wildfire 1/10 Low
- Heat 1/10 Low 7 d/yr ≥82°F today · 14 d/yr by 30 yrs out
- Wind 1/10 Low
- Air quality 6/10 Major 6 unhealthy d/yr today · 7 by 30 yrs out
Nearby sold comps map
Loading sold comps map…
Walkable amenities ~0.75 mi
Loading nearby amenities…
Taxation est. · year 1
- Rental income
- $24,931
- − Mortgage interest
- −$13,998
- − Property taxes
- −$1,822
- − Insurance
- −$1,916
- − Repairs & maintenance
- −$1,994
- − Management
- −$1,994
- − Depreciation
- −$7,270
- Taxable loss
- −$4,064
- Est. tax savings @ 24.0%
- +$975
- After-tax cash flow
- $1,207/yr
For passive investors: Depreciation is non-cash, so a rental often shows a tax loss while cash-flowing — sheltering income. Rental losses are passive: they offset passive income freely, and up to $25,000/yr can offset ordinary (W-2) income if you actively participate and your MAGI is under $100k (phasing out to $0 by $150k); unused losses carry forward. On sale, claimed depreciation is recaptured at up to 25%, and gains may owe capital-gains tax (a 1031 exchange can defer both). Figures are a year-1 estimate at your 24.0% rate — not tax advice; consult a CPA.
Schools (NCES district)
- District
- Raymond School District
- NCES district ID
- 5307140
- Math proficiency
- 30% ▲ 5.00%
- Reading proficiency
- 48% ▲ 2.00%
- Median HH income
- $38,441
- Composite
- 34.99/100
- National rank
- #9951
- State rank
- #231 of 291 in WA
Livability — Raymond
- Score
- 72/100
- State rank
- #212
- US rank
- #6045
Category grades
Schools grade is shown separately in the Schools card above.
Census & demographics
- Census place
- Raymond, WA
- Population (ZIP)
- 7,458
Population outlook (Pacific County) Hauer SSP2
- Today (2025)
- 20,636 people
- By 2030
- 20,137 · -2.4%
- By 2040
- 19,041 · -7.7%
- By 2050
- 18,504 · -10.3%
- By 2075
- 17,403 · -15.7%
- By 2100
- 16,241 · -21.3%
Race, ethnicity, and origin ACS 2023
- Neighborhood character
- Predominantly White (78%)
- Race & ethnicity
- White 78% Hispanic / Latino 11% Two or more races 7% Native American 2% Asian 1%
- Hispanic origin (detail)
- Mexican 11%
- Common ancestry
- Portuguese 5% Scotch-Irish 3% Romanian 3%
- Foreign-born
- 7% · Canada, South Korea
- Languages at home
- 89% English-only · Spanish 8% German/W. Germanic 2%
Political lean MEDSL · Pacific
- 2024 margin
- Toss-up / Even · D 48.1% · R 49.4% · Other 2.4%
- 2008→2024 swing
- -15.4pp toward R · 2008: 14.1pp · 2024: -1.3pp
- All cycles
- 2024: R+1.3 2020: R+1.1 2016: R+6.9 2012: D+11.4 2008: D+14.1
Not yet ingested
- Civics
- —
Market trends
- HPI YoY
- ▼ -7.88%
- Current HPI
- 271.0583
- Rent YoY
- —
- Metro
- —
- State GDP YoY
- ▲ 4.65%
- F500 in state
- 22
Industry mix (Fortune 500 HQ in WA)
| Industry | F500 HQs | Revenue |
|---|---|---|
| Retail | 2 | $269B |
|
||
| Technology / Retail | 1 | $638B |
|
||
| Technology | 1 | $245B |
|
||
| Telecommunications | 1 | $38B |
|
||
| Food / Beverage | 1 | $36B |
|
||
| Automotive / Trucks | 1 | $34B |
|
||
Price history
1 event — show timeline
- 2026-01-12 Listed $249,900 NWMLS as Distributed by MLS Grid
Property tax history
-1.5%/yrLatest (2026): $1,822 · +8.7% YoY. Source: county tax records.
Cash-flow waterfall
monthlySold comps — $/sqft
last 12 mo · ≤1 miLoading sold comps…