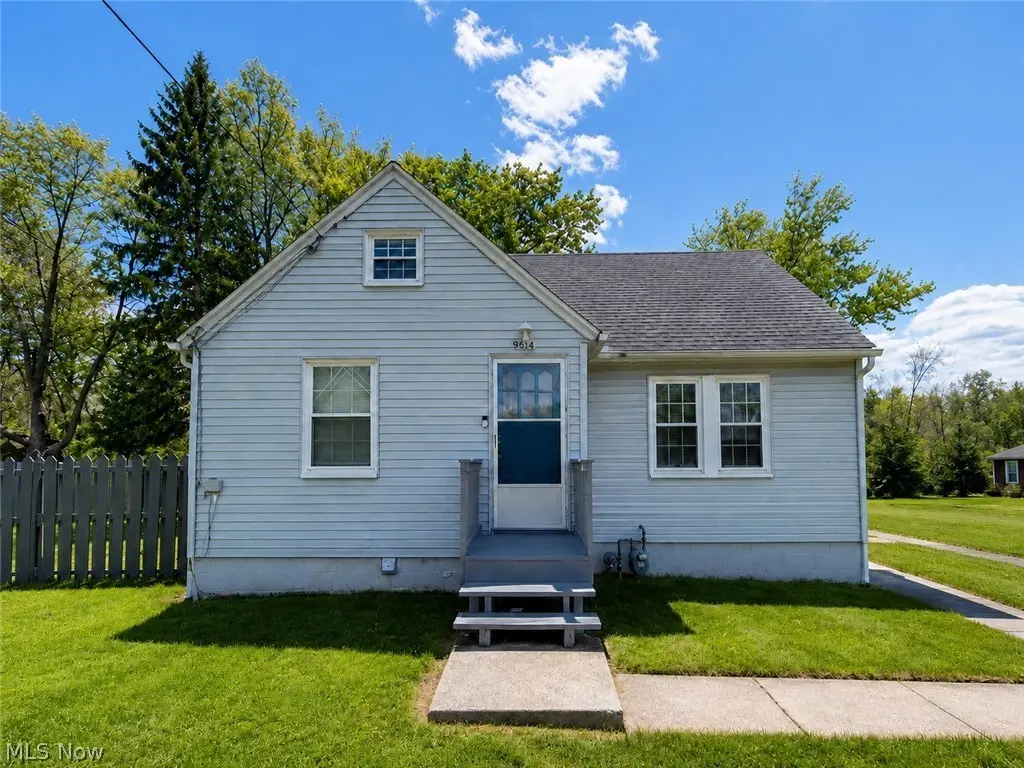
9614 Ravenna Rd · Twinsburg, OH
Flood risk 4/10 · Minor
- FEMA flood zone
- X (unshaded)
- Chance of flooding over 30 yrs
- 0.22%
- Est. flood insurance / yr
- $473 – $860
Fire risk 1/10 · Minimal
- Est. fire insurance / yr
- $713 – $1,323
Heat risk 2/10 · Minimal
- Hot days now (above 96°F)
- 7 days/yr
- Hot days in 30 yrs
- 17 days/yr
Wind risk 1/10 · Minimal
- Chance of severe wind over 30 yrs
- —
Air-quality risk 3/10 · Minor
- Unhealthy air days now
- 2 days/yr
- Unhealthy air days in 30 yrs
- 3 days/yr
Risk factors via First Street. Map © Google.
Why this score? — see what drove the C grade
The composite is a weighted blend of 9 inputs, each scored 0–100. Each bar is that input's sub-score; the figure is the points it added to the 100-point composite (weight × sub-score).
- Cash flow +18.6/30.0
- ARV discount +15.0/15.0
- Schools +6.2/10.0
- DSCR +5.9/10.0
- 1% rule +4.8/10.0
- Livability +4.0/5.0
- Rent growth +2.5/5.0
- Condition / age +2.5/5.0
- Appreciation +0.0/10.0
$225,000
🖨 Deal sheet 📄 Offer letter ✓ Due diligence
Listing remarks
Lovely 3-bedroom, 1.5 bath Bungalow that is close to the center of the city. It is currently a residence, but it is also zoned Community Commercial if you choose to have a business. The inviting 0.73 acre backyard is ready for your large gatherings or intimate bonfires. There is a circular driveway that runs behind the house, which provides easy exits to the street or plenty of parking for you or your guests. The home has been updated with new windows, new flooring throughout the house and modern wiring. The kitchen has refaced shaker cabinets with modern hardware on the uppers and new shaker style cabinets with modern hardware on the lowers. The counter tops are new, as well. You will find
Key facts
- New flooring
- Circular driveway
- 0.73 acre backyard
Tags
Property features AI
Exterior
- Parking: Detached 2-car garage
- Utilities: Public water; Public sewer
- Home design: Single-family property; Shingle roof; Vinyl siding
- Construction: Built (year per public records); Vinyl siding construction; Shingle roof
- Exterior features: Lot approximately 0.73 acres
Interior
- Kitchen: Microwave; Range; Refrigerator
- Bedrooms: 2 main-level bedrooms
- Bathrooms: 1 full bathroom; 1 half bathroom
- Heating & cooling: Forced air heating; Central air conditioning
- Interior features: Full basement
Neighborhood map
What this means for you Summary
Snapshot
- This is a 3-bed/1.5-bath single-family listed at $225k.
Deal economics
- At list price, monthly cash flow is $220 ($3k/yr) — positive.
- The deal already cash-flows at list — no discount required.
- To meet the 1% rule (rent ≥ 1% of price), the offer needs to be $220k (2.4% below list).
- Recommended offer: $220k (2.4% below list) — sets the bar for 1% rule.
- Cap rate 7.5% vs local median 3.7% in Twinsburg — top-decile yield for the area; either an underpriced asset or a hidden risk that comps aren't pricing in. Stress-test before assuming the spread holds.
Location & tenants
- Location reads 81/100 on livability (#95 in OH, #1,475 nationally) — a professional / high-income tenant draw. Strengths: schools A+, crime A+, employment A+; Watch: amenities F, commute F.
- Twinsburg City (suburban): math 67% / reading 75% proficiency, ranked #119 of 656 in OH (top 18%) — strong family-tenant draw, lease renewals of 3-5y typical; only 14% free/reduced lunch — higher-income household profile.
- Market conditions: 67 active listings in the ZIP; 2 comparable units currently listed for rent nearby; solid renter incomes; 1,114 units permitted in Summit County in 2024 (397 in 5+ unit buildings).
Forward outlook
- Local home prices are declining (-3.0%/yr); year-one equity from $2k of loan paydown is wiped out by about $7k of value loss. Plan a longer hold.
- Summit County population projected to shrink 6% by 2050 — rents likely to lag national; underwrite the cash flow, not the appreciation.
Negotiation context
- Only 6 days on market — expect competitive offers; lowballing is unlikely to land.
- 4 sale attempts since 19y ago with the ask held roughly flat each time — persistent listings suggest the price (not the market) is what's stuck; bring a comps-based counter.
- Current owner paid $105k; list at $225k implies a 114% gain — meaningful room to come down on a strong offer.
Risks & watch-outs
- Watch-outs: built in 1946 — expect roof / HVAC / electrical / plumbing capex.
Questions for the listing agent
- Built in 1946 — when were the roof, HVAC, electrical panel, plumbing, and water heater last replaced?
- Is there a deadline driving the sale (1031 exchange, divorce, estate, relocation)? That informs how much negotiation room exists.
- Schools are A-rated — typically a magnet for longer-tenancy family renters. What's the average tenant stay here, and is there a school-zone premium baked into asking?
- What's the average days-on-market for RENTAL listings here right now (not sales)? A rising rental-DOM trend means longer vacancies and softer asking-rent achievability than the comps imply.
- What's the recent tenant-quality profile in this submarket — average credit score on applications, eviction rate, late-payment / NSF rate, and stable-employment percentage? A property-management company in the area should have these aggregated.
- How much new for-sale + rental construction is in the pipeline within 1–3 miles? Heavy new supply typically softens prices + rents 12–24 months out; constrained supply supports both.
Investment metrics
- 1% rule
- 0.98% ✗
- Cap rate
- 7.47%
- Cash-on-cash
- 4.20%
- DSCR
- 1.19
- GRM
- 8.5
CMA / ARV
- ARV (median comp)
- $298,285
- List price
- $225,000
- Delta
- -24.57%
- Verdict
- UNDERPRICED
- Comps
- 20 within 1.0 mi
Show comp detail 1 sale within ~0.75 mi
| Address | Dist | Beds/Ba | Sqft | Sold | Price | $/sf | Match |
|---|---|---|---|---|---|---|---|
| 2999 Cannon Rd | 0.25mi | 3/1.5 | 1,168 (+14%) | 4mo | $235,000 | $201 | 61 |
Match score weights: distance 35% · size 25% · config 20% · recency 20%. Top-matched comps best support the ARV.
Projected returns pro-forma
-3.0% appreciation · 3.0% rent growth · sell at horizon
- IRR
- -9.7%
- Equity multiple
- 0.64×
- Total profit
- $-22,419
- Equity at exit
- $33,548
- IRR
- -0.3%
- Equity multiple
- 0.98×
- Total profit
- $-1,419
- Equity at exit
- $19,454
Cash invested: $63,000 (down + closing). Projections, not guarantees.
Landlord ↔ Tenant lean methodology
- Overall (STATE)
- 73 Landlord-Friendly
- State Ohio
- 73 Landlord-Friendly · R+6
- County
- — inherits STATE
- City
- — inherits STATE
ZIP-level market 44087
- Active inventory
- 67
- Price-to-rent
- 8.5×
Monthly cashflow live
- Estimated rent
- $2,197 medium interval (Pro) →
- Mortgage (P&I)
- −$1,180
- Tax from tax record
- −$242 /mo · $2,899/yr
- Insurance
- −$94
- HOA
- −$0
- Vacancy / Maint / Mgmt
- −$461
- Net cashflow
- $220
Break-even live
UW: 25.0% down · 7.5% · 30yr · 1.5% tax · 5.0% vac · 8.0% maint · 8.0% mgmt
Financing live
Cash to close
- Down payment
- $56,250
- Closing costs
- $6,750
- Reserves months
- —
- Total cash needed
- —
Loan-product check · same deal, 3 products live
Conventional
25% down · 7.5% · 30yr
- Down + closing
- —
- Monthly P&I
- —
- Monthly cashflow
- —
- DSCR
- —
- Eligible?
- —
Personal DTI + credit; lowest rate.
DSCR
20% down · 8.5% · 30yr
- Down + closing
- —
- Monthly P&I
- —
- Monthly cashflow
- —
- DSCR
- —
- Eligible?
- —
No personal income docs; deal must DSCR.
Hard money
10% down · 12.0% · 12mo
- Down + closing
- —
- Monthly P&I
- —
- Monthly cashflow
- —
- DSCR
- —
- Eligible?
- —
Short-term bridge; refi at stabilization.
Rent comps 2 comps
| Address | Beds | Baths | Sqft | Rent | $/sqft | DOM | Units | Dist |
|---|---|---|---|---|---|---|---|---|
| 2639 Arbor Glen Dr Twinsburg, OH | 1.0–2.0 | 1.0–2.0 | 1019 | $1,735 | $1.70 | 1d | 17 | 0.69mi |
| 2617 Aubrey Ln Twinsburg, OH | 2.0 | 2.0 | 1326 | $2,328 | $1.76 | 16d | 1 | 0.87mi |
Listing history 17 events
-
2026-06-18days on market $225,000 Active 6 DOM
-
2026-06-17days on market $225,000 Active 5 DOM
-
2026-06-16days on market $225,000 Active 4 DOM
-
2026-06-15days on market $225,000 Active 3 DOM
-
2026-06-14days on market $225,000 Active 1 DOM
-
2026-06-03days on market $225,000 Active 23 DOM
-
2026-06-02days on market $225,000 Active 22 DOM
-
2026-06-01days on market $225,000 Active 21 DOM
-
2026-05-31days on market $225,000 Active 20 DOM
-
2026-05-31days on market $225,000 Active 19 DOM
-
2026-05-11$225,000 Active 2006-char remark
-
2026-04-04historical
-
2026-03-17$240,000 Active
-
2020-03-19soldstatus $105,000
-
2012-12-12soldstatus $80,400
-
2008-07-08historical
-
2007-07-08$499,000
ⓘ Source: listings_history table (triggers on properties + properties_extension) + one-shot
backfill from property_details.listing_events for pre-trigger history.
Tax reassessment forecast OH · Partial reset (capped growth)
- Current annual tax
- $2,899 · $242/mo
- Projected year-2 tax
- $3,205 · $267/mo
- Expected delta
- +$305/yr (+$25/mo · 10.5%)
ⓘ Screening estimate from a state-policy table — verify with the county assessor before closing.
Climate risk First Street
- Flood 4/10 Moderate FEMA zone X (unshaded) · 22% chance over 30 yrs
- Wildfire 1/10 Low
- Heat 2/10 Low 7 d/yr ≥96°F today · 17 d/yr by 30 yrs out
- Wind 1/10 Low
- Air quality 3/10 Moderate 2 unhealthy d/yr today · 3 by 30 yrs out
Nearby sold comps map
Loading sold comps map…
Walkable amenities ~0.75 mi
Loading nearby amenities…
Taxation est. · year 1
- Rental income
- $26,363
- − Mortgage interest
- −$12,603
- − Property taxes
- −$2,899
- − Insurance
- −$1,125
- − Repairs & maintenance
- −$2,109
- − Management
- −$2,109
- − Depreciation
- −$6,545
- Taxable loss
- −$1,028
- Est. tax savings @ 24.0%
- +$247
- After-tax cash flow
- $2,890/yr
For passive investors: Depreciation is non-cash, so a rental often shows a tax loss while cash-flowing — sheltering income. Rental losses are passive: they offset passive income freely, and up to $25,000/yr can offset ordinary (W-2) income if you actively participate and your MAGI is under $100k (phasing out to $0 by $150k); unused losses carry forward. On sale, claimed depreciation is recaptured at up to 25%, and gains may owe capital-gains tax (a 1031 exchange can defer both). Figures are a year-1 estimate at your 24.0% rate — not tax advice; consult a CPA.
Schools (NCES district)
- District
- Twinsburg City
- NCES district ID
- 3905007
- Math proficiency
- 67% ▼ -17.00%
- Reading proficiency
- 75% ▼ -8.00%
- Median HH income
- $70,356
- Composite
- 62.11/100
- National rank
- #711
- State rank
- #119 of 656 in OH
Livability — Twinsburg
- Score
- 81/100
- State rank
- #95
- US rank
- #1475
Category grades
Schools grade is shown separately in the Schools card above.
Census & demographics
- Census place
- Twinsburg, OH
- County
- Summit County · 440,783 people
- City population
- 22,185
- Metro
- Akron, OH
- Population (ZIP)
- 22,185
- Household income
- $99,270
- Rent vs Own
- Severe rent burden
- 607.0
Population outlook (Summit County) Hauer SSP2
- Today (2025)
- 546,583 people
- By 2030
- 544,028 · -0.5%
- By 2040
- 531,363 · -2.8%
- By 2050
- 514,923 · -5.8%
- By 2075
- 481,765 · -11.9%
- By 2100
- 432,265 · -20.9%
Race, ethnicity, and origin ACS 2023
- Neighborhood character
- Diverse neighborhood (Simpson 0.55)
- Race & ethnicity
- White 63% Black 20% Asian 9% Two or more races 4% Hispanic / Latino 2%
- Common ancestry
- Romanian 5% Italian 1% Lithuanian 1%
- Foreign-born
- 9% · China, Canada, Vietnam
- Languages at home
- 91% English-only · Other Indo-European 4% Russian/Polish/Slavic 1% Tagalog/Filipino 1%
Political lean MEDSL · Summit
- 2024 margin
- Lean D (+7.0) · D 53.0% · R 46.0%
- 2008→2024 swing
- -9.6pp toward R · 2008: 16.6pp · 2024: 7.0pp
- All cycles
- 2024: D+7.0 2020: D+9.6 2016: D+8.2 2012: D+14.8 2008: D+16.6
Not yet ingested
- Civics
- —
Market trends
- HPI YoY
- ▼ -175.18%
- Current HPI
- 193.7614
- Rent YoY
- —
- Metro
- Akron, OH
- State GDP YoY
- ▲ 1.98%
- F500 in state
- 48
Industry mix (Fortune 500 HQ in OH)
| Industry | F500 HQs | Revenue |
|---|---|---|
| Insurance | 3 | $145B |
|
||
| Industrial Machinery | 3 | $49B |
|
||
| Financial Services | 3 | $24B |
|
||
| Consumer Goods | 2 | $93B |
|
||
| Aerospace / Defense | 2 | $47B |
|
||
| Utilities | 2 | $33B |
|
||
Price history
-54.9% since first listed9 events — show timeline
- 2026-06-12 Listed $225,000 MLSNOW
- 2026-06-03 Listing Removed — MLSNOW
- 2026-05-11 Listed $225,000 MLSNOW
- 2026-04-04 Listing Removed — MLSNOW
- 2026-03-17 Listed $240,000 MLSNOW
- 2020-03-19 Sold (Public Records) $105,000 Public Records
- 2012-12-12 Sold (Public Records) $80,400 Public Records
- 2008-07-08 Listing Removed — MLSNOW
- 2007-07-08 Listed $499,000 MLSNOW
Property tax history
+3.5%/yrLatest (2025): $2,899 · -6.7% YoY. Source: county tax records.
Cash-flow waterfall
monthlySold comps — $/sqft
last 12 mo · ≤1 miLoading sold comps…