 Multi-family
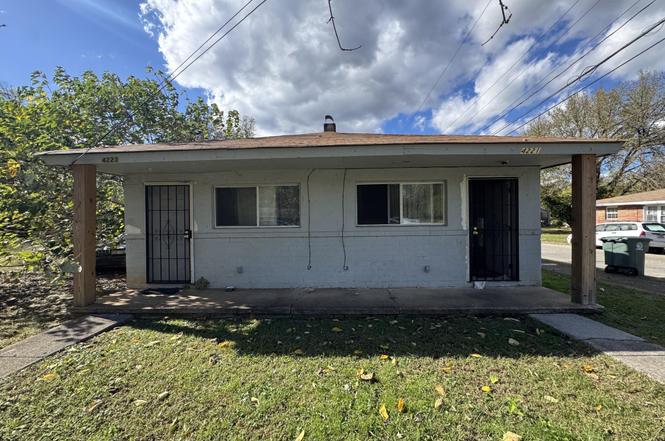
4221 Quinn Adams St · Chattanooga, TN
Flood risk 9/10 · Severe
- FEMA flood zone
- X (unshaded)
- Chance of flooding over 30 yrs
- 0.99%
- Est. flood insurance / yr
- $507 – $1,088
Fire risk 2/10 · Minimal
- Est. fire insurance / yr
- $949 – $1,763
Heat risk 6/10 · Moderate
- Hot days now (above 106°F)
- 7 days/yr
- Hot days in 30 yrs
- 20 days/yr
Wind risk 4/10 · Minor
- Chance of severe wind over 30 yrs
- 11.0%
Air-quality risk 3/10 · Minor
- Unhealthy air days now
- 2 days/yr
- Unhealthy air days in 30 yrs
- 2 days/yr
Risk factors via First Street. Map © Google.
Why this score? — see what drove the C grade
The composite is a weighted blend of 9 inputs, each scored 0–100. Each bar is that input's sub-score; the figure is the points it added to the 100-point composite (weight × sub-score).
- Cash flow +20.2/30.0
- ARV discount +7.5/15.0
- DSCR +6.4/10.0
- Appreciation +5.7/10.0
- 1% rule +4.4/10.0
- Livability +3.9/5.0
- Schools +2.7/10.0
- Rent growth +2.5/5.0
- Condition / age +2.5/5.0
$155,000
🖨 Deal sheet 📄 Offer letter ✓ Due diligence
Multi-family units
County records classify this as Multi-Family (2-4 Unit). Listing-text estimate: 1 unit. estimate disagrees with records
Listing remarks
DUE TO NO FAULT OF THE SELLER, WE ARE BACK ON MARKET. Buyer's financing fell through. This Chattanooga duplex is fully occupied by tenants and makes a great investment property. Each side has two bedrooms and one bathroom. Easy access location and very affordable housing, it will stay occupied and rented easily. All information to be verified.
Key facts
- 1,568 sq ft lot
- Built 1960
- Listed 138 days
Property features AI
Finance
- HOA & community: No community features reported
Exterior
- Parking: On-street parking
- Utilities: Public water; Public sewer; Electricity connected; Water connected; Sewer connected; Cable available; Phone available
- Home design: Residential mixed-use property; One level
- Construction: Brick and stucco construction; Shingle roof; Slab foundation; Built area listed as 1,456 above-grade finished square feet
- Exterior features: No special exterior features reported; No patio or porch reported; No fencing
Interior
- Bathrooms: 2 full bathrooms
- Heating & cooling: Central heating (electric); Central air conditioning (electric)
- Interior features: Refrigerator; Water heater
- Laundry & utility: Washer hookup; Electric dryer hookup
Neighborhood map
What this means for you Summary
Snapshot
- This is a 4-bed/2.0-bath multifamily listed at $155k.
Deal economics
- At list price, monthly cash flow is $130 ($2k/yr) — positive.
- The deal already cash-flows at list — no discount required.
- To meet the 1% rule (rent ≥ 1% of price), the offer needs to be $146k (5.7% below list).
- Recommended offer: $136k (12.0% below list) — sets the bar for market timing.
Location & tenants
- Location reads 78/100 on livability (#3 in TN, #2,582 nationally) — a middle-class / working-renter tenant base. Strengths: amenities A+, commute A+, cost of living A+; Watch: employment D+, crime F.
- Hamilton County (urban): math 31% / reading 31% proficiency, ranked #42 of 139 in TN (top 30%) — families likely to look elsewhere, expect single-tenant / working-renter base with shorter leases.
- Zoned schools: Orchard Knob Middle (math 5% / reading 6%, grade F, #291 of 333 statewide, top 88%, 334 students, 0% FRL) — zoned schools average 0% FRL vs 52% district-wide (52 pts lower); this property's tenant base skews higher-income than the district average.
- Zoned-school proficiency averages 6% at this address vs 31% district-wide (-26 pts) — the specific schools serving this property underperform the Hamilton County average; the district grade overstates school quality for this exact location.
- Market conditions: 61 active listings in the ZIP; 8 comparable units currently listed for rent nearby; rentals leasing fast (median 14d on market — plan ~1-2 weeks tenant-placement turnaround); lower-income renter base — watch delinquency; 2,133 units permitted in Hamilton County in 2024 (405 in 5+ unit buildings).
Forward outlook
- In year one you build about $3k of equity ($1k loan paydown + $2k appreciation (1.3% local appreciation)).
- Hamilton County population projected at +23% by 2050 — long-run rental-demand tailwind backs the buy-and-hold thesis.
- At projected returns (1.3% appreciation + 3.0% rent growth), your $43k cash investment doubles in ~8 years — after that, you're playing with house money.
- By year 10, paydown + projected appreciation supports a ~$32k cash-out refi (75% LTV) — recoverable capital for the next deal without selling this one.
Negotiation context
- It's been on market 138 days — a 12% lower offer ($136k) is reasonable based on typical stale-listing flexibility.
- 3 sale attempts; this cycle's ask has dropped $20k (11%) from the opening price — seller is motivated, your offer sets the floor, not the list.
- Current owner paid $60k; list at $155k implies a 158% gain — meaningful room to come down on a strong offer.
Risks & watch-outs
- Watch-outs: flood insurance adds $66/mo.
Questions for the listing agent
- It's been on market 138 days. Have you received any prior offers? Is the seller open to a 12% concession, seller financing, or rate buy-down credit?
- Built in 1960 — when were the roof, HVAC, electrical panel, plumbing, and water heater last replaced?
- What's the actual annual flood-insurance premium (NFIP or private), and is the property in a SFHA with mandatory coverage?
- Why hasn't it sold? Are there any deal-killer items the seller is aware of (foundation, flood, title, zoning, code violations)?
- Is there a deadline driving the sale (1031 exchange, divorce, estate, relocation)? That informs how much negotiation room exists.
- Schools are F-rated, which usually means shorter tenancies and higher turnover. Who's the typical renter profile here, and what's been the actual vacancy rate?
- Crime grade is F in this area — have there been break-ins, vandalism, or insurance claims at this property in the last 3 years? What carrier currently insures it and at what premium?
- What's the average days-on-market for RENTAL listings here right now (not sales)? A rising rental-DOM trend means longer vacancies and softer asking-rent achievability than the comps imply.
- What's the recent tenant-quality profile in this submarket — average credit score on applications, eviction rate, late-payment / NSF rate, and stable-employment percentage? A property-management company in the area should have these aggregated.
- How much new apartment / multifamily construction is in the pipeline within 1–3 miles? Heavy new supply (>2% of stock underway) typically softens rents 12–24 months out; light construction supports rent growth.
Investment metrics
- 1% rule
- 0.94% ✗
- Cap rate
- 7.81%
- Cash-on-cash
- 5.43%
- DSCR
- 1.24
- GRM
- 8.8
CMA / ARV
No comps found within radius.
Projected returns pro-forma
1.33% appreciation · 3.0% rent growth · sell at horizon
- IRR
- 6.1%
- Equity multiple
- 1.32×
- Total profit
- $13,723
- Equity at exit
- $55,622
- IRR
- 10.0%
- Equity multiple
- 2.26×
- Total profit
- $54,878
- Equity at exit
- $76,057
Cash invested: $43,400 (down + closing). Projections, not guarantees.
Landlord ↔ Tenant lean methodology
- Overall (STATE)
- 87 Strongly Landlord-Friendly
- State Tennessee
- 87 Strongly Landlord-Friendly · R+13
- County
- — inherits STATE
- City
- — inherits STATE
ZIP-level market 37410
- Home prices YoY
- 0.6%
- Active inventory
- 61
- Price-to-rent
- 8.8×
Monthly cashflow live
- Estimated rent
- $1,462 high interval (Pro) →
- Mortgage (P&I)
- −$813
- Tax from tax record
- −$81 /mo · $968/yr
- Insurance
- −$65
- Flood insurance flood zone
- −$66 /mo · $798/yr
- HOA
- −$0
- Vacancy / Maint / Mgmt
- −$307
- Net cashflow
- $130
Break-even live
UW: 25.0% down · 7.5% · 30yr · 1.5% tax · 5.0% vac · 8.0% maint · 8.0% mgmt
Financing live
Cash to close
- Down payment
- $38,750
- Closing costs
- $4,650
- Reserves months
- —
- Total cash needed
- —
Loan-product check · same deal, 3 products live
Conventional
25% down · 7.5% · 30yr
- Down + closing
- —
- Monthly P&I
- —
- Monthly cashflow
- —
- DSCR
- —
- Eligible?
- —
Personal DTI + credit; lowest rate.
DSCR
20% down · 8.5% · 30yr
- Down + closing
- —
- Monthly P&I
- —
- Monthly cashflow
- —
- DSCR
- —
- Eligible?
- —
No personal income docs; deal must DSCR.
Hard money
10% down · 12.0% · 12mo
- Down + closing
- —
- Monthly P&I
- —
- Monthly cashflow
- —
- DSCR
- —
- Eligible?
- —
Short-term bridge; refi at stabilization.
Rent comps 8 comps
| Address | Beds | Baths | Sqft | Rent | $/sqft | DOM | Units | Dist |
|---|---|---|---|---|---|---|---|---|
| 3713 Dorris St Chattanooga, TN | 3.0 | 1.0 | 974 | $1,025 | $1.05 | 13d | 1 | 0.35mi |
| 4020 Kirkland Ave Chattanooga, TN | 3.0 | 1.0 | 1326 | $785 | $0.59 | 23d | 1 | 0.35mi |
| 4905 Central Ave Chattanooga, TN | 2.0–3.0 | 2.0 | 1169 | $637 | $0.54 | 13d | 2 | 0.65mi |
| 5505 Central Ave Chattanooga, TN | 3.0 | 2.0 | 1050 | $1,725 | $1.64 | 21d | 1 | 1.21mi |
| 1133 Bexley Sq Chattanooga, TN | 3.0 | 1.0–2.0 | 913 | $2,574 | $2.82 | 13d | 22 | 1.22mi |
| 3635 6th Ave Unit 3639 Chattanooga, TN | 3.0 | 2.0 | 1300 | $1,450 | $1.12 | 13d | 1 | 1.26mi |
| 3627 6th Ave Unit 3627 Chattanooga, TN | 3.0 | 2.0 | 1300 | $1,350 | $1.04 | 23d | 1 | 1.27mi |
| 1409 E 50th St Chattanooga, TN | 3.0 | 2.5 | 1350 | $1,599 | $1.18 | 13d | 1 | 1.35mi |
Listing history 12 events
-
2026-05-21status Pending
-
2026-05-17price $155,000
-
2026-05-16price $179,999
-
2026-05-16price $185,000
-
2026-05-09status Active
-
2026-04-29status Pending
-
2026-03-31price $160,000
-
2026-03-31status Active
-
2026-01-25status Pending
-
2026-01-19price $165,000
-
2025-10-20$175,000 Active
-
2005-01-21soldstatus $60,000
ⓘ Source: listings_history table (triggers on properties + properties_extension) + one-shot
backfill from property_details.listing_events for pre-trigger history.
Tax reassessment forecast TN · Resets to sale price
- Current annual tax
- $968 · $81/mo
- Projected year-2 tax
- $1,100 · $92/mo
- Expected delta
- +$133/yr (+$11/mo · 13.7%)
ⓘ Screening estimate from a state-policy table — verify with the county assessor before closing.
Climate risk First Street
- Flood 9/10 Extreme FEMA zone X (unshaded) · 99% chance over 30 yrs
- Wildfire 2/10 Low
- Heat 6/10 Major 7 d/yr ≥106°F today · 20 d/yr by 30 yrs out
- Wind 4/10 Moderate 11% chance of damaging wind over 30 yrs
- Air quality 3/10 Moderate 2 unhealthy d/yr today · 2 by 30 yrs out
Nearby sold comps map
Loading sold comps map…
Walkable amenities ~0.75 mi
Loading nearby amenities…
Taxation est. · year 1
- Rental income
- $17,538
- − Mortgage interest
- −$8,682
- − Property taxes
- −$968
- − Insurance
- −$1,572
- − Repairs & maintenance
- −$1,403
- − Management
- −$1,403
- − Depreciation
- −$4,509
- Taxable loss
- −$999
- Est. tax savings @ 24.0%
- +$240
- After-tax cash flow
- $1,801/yr
For passive investors: Depreciation is non-cash, so a rental often shows a tax loss while cash-flowing — sheltering income. Rental losses are passive: they offset passive income freely, and up to $25,000/yr can offset ordinary (W-2) income if you actively participate and your MAGI is under $100k (phasing out to $0 by $150k); unused losses carry forward. On sale, claimed depreciation is recaptured at up to 25%, and gains may owe capital-gains tax (a 1031 exchange can defer both). Figures are a year-1 estimate at your 24.0% rate — not tax advice; consult a CPA.
Schools (NCES district)
- District
- Hamilton County
- NCES district ID
- 4701590
- Math proficiency
- 31% ▼ -10.00%
- Reading proficiency
- 31% ▼ -3.00%
- Median HH income
- $47,456
- Composite
- 26.8/100
- National rank
- #7122
- State rank
- #42 of 139 in TN
Livability — Chattanooga
- Score
- 78/100
- State rank
- #3
- US rank
- #2582
Category grades
Schools grade is shown separately in the Schools card above.
Census & demographics
- Census place
- Chattanooga, TN
- County
- Hamilton County · 312,777 people
- City population
- 131,999
- Metro
- Chattanooga, TN-GA
- Population (ZIP)
- 4,129
- Household income
- $28,708
- Rent vs Own
- Severe rent burden
- 406.0
Population outlook (Hamilton County) Hauer SSP2
- Today (2025)
- 393,784 people
- By 2030
- 412,983 · +4.9%
- By 2040
- 449,502 · +14.1%
- By 2050
- 484,341 · +23.0%
- By 2075
- 565,746 · +43.7%
- By 2100
- 618,394 · +57.0%
Race, ethnicity, and origin ACS 2023
- Neighborhood character
- Predominantly Black (81%)
- Race & ethnicity
- Black 81% Two or more races 10% White 8% Hispanic / Latino 7%
- Hispanic origin (detail)
- Mexican 2%
- Common ancestry
- Scotch-Irish 1%
- Foreign-born
- 6% · Canada
- Languages at home
- 94% English-only · Spanish 6%
Political lean MEDSL · Hamilton
- 2024 margin
- R (+13.1) · D 42.7% · R 55.7% · Other 1.6%
- 2008→2024 swing
- -1.2pp toward R · 2008: -11.8pp · 2024: -13.1pp
- All cycles
- 2024: R+13.1 2020: R+9.7 2016: R+16.6 2012: R+14.8 2008: R+11.8
Not yet ingested
- Civics
- —
Market trends
- HPI YoY
- ▲ 1.33%
- Current HPI
- 228.3522
- Rent YoY
- —
- Metro
- Chattanooga, TN-GA
- State GDP YoY
- ▲ 2.78%
- F500 in state
- 22
Industry mix (Fortune 500 HQ in TN)
| Industry | F500 HQs | Revenue |
|---|---|---|
| Healthcare | 3 | $91B |
|
||
| Retail | 3 | $72B |
|
||
| Transportation / Logistics | 1 | $88B |
|
||
| Paper / Packaging | 1 | $19B |
|
||
| Insurance | 1 | $13B |
|
||
| Energy | 1 | $12B |
|
||
Price history
+158.3% since first listed12 events — show timeline
- 2026-05-21 Pending — GCAR
- 2026-05-17 Price Changed $155,000 GCAR
- 2026-05-16 Price Changed $179,999 GCAR
- 2026-05-16 Price Changed $185,000 GCAR
- 2026-05-09 Relisted — GCAR
- 2026-04-29 Pending — GCAR
- 2026-03-31 Price Changed $160,000 GCAR
- 2026-03-31 Relisted — GCAR
- 2026-01-25 Pending — GCAR
- 2026-01-19 Price Changed $165,000 GCAR
- 2025-10-20 Listed $175,000 GCAR
- 2005-01-21 Sold (Public Records) $60,000 Public Records
Property tax history
+7.6%/yrLatest (2025): $968 · +100.2% YoY. Source: county tax records.
Cash-flow waterfall
monthlySold comps — $/sqft
last 12 mo · ≤1 miLoading sold comps…