None · Eatonville, FL
Flood risk 1/10 · Minimal
- FEMA flood zone
- X (unshaded)
- Chance of flooding over 30 yrs
- 0.0%
- Est. flood insurance / yr
- $507 – $1,088
Fire risk 1/10 · Minimal
- Est. fire insurance / yr
- $947 – $1,759
Heat risk 9/10 · Severe
- Hot days now (above 108°F)
- 7 days/yr
- Hot days in 30 yrs
- 22 days/yr
Wind risk 9/10 · Severe
- Chance of severe wind over 30 yrs
- 99.0%
Air-quality risk 2/10 · Minimal
- Unhealthy air days now
- 0 days/yr
- Unhealthy air days in 30 yrs
- 1 days/yr
Risk factors via First Street. Map © Google.
Why this score? — see what drove the D grade
The composite is a weighted blend of 9 inputs, each scored 0–100. Each bar is that input's sub-score; the figure is the points it added to the 100-point composite (weight × sub-score).
- Cash flow +13.8/30.0
- ARV discount +7.5/15.0
- DSCR +4.2/10.0
- Schools +4.1/10.0
- Livability +3.2/5.0
- 1% rule +2.9/10.0
- Rent growth +2.6/5.0
- Condition / age +2.5/5.0
- Appreciation +0.0/10.0
$179,900
🖨 Deal sheet 📄 Offer letter ✓ Due diligence
Listing remarks MLS
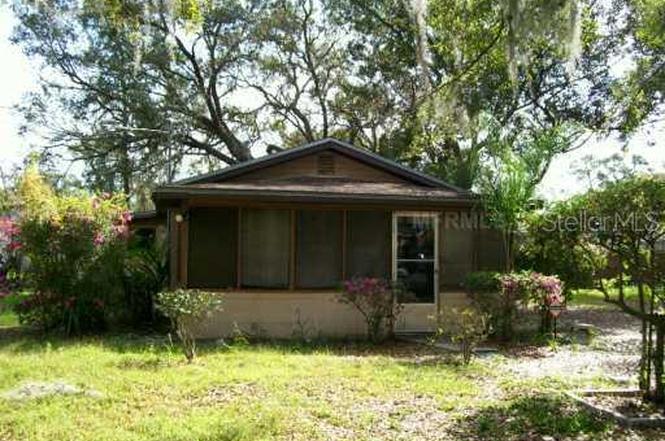
Small home in need of repairs. Perfect for investor in convenient location. This property is priced to sell and a great buy!
Key facts
- Quiet street
- Easy access
- Lovely lot
Tags
Neighborhood map
What this means for you Summary
Snapshot
- This is a 2-bed/1.0-bath single-family listed at $180k.
Deal economics
- At list price, monthly cash flow is $17 ($201/yr) — positive.
- The deal already cash-flows at list — no discount required.
- To meet the 1% rule (rent ≥ 1% of price), the offer needs to be $142k (21.2% below list).
- Recommended offer: $142k (21.2% below list) — sets the bar for 1% rule.
Location & tenants
- Location reads 63/100 on livability (#721 in FL) — a middle-class / working-renter tenant base. Strengths: commute A+, cost of living A+, housing A-; Watch: schools D+, crime F, amenities F.
- Orange (suburban): math 46% / reading 51% proficiency, ranked #43 of 73 in FL (top 59%) — families likely to look elsewhere, expect single-tenant / working-renter base with shorter leases.
- Market conditions: Rents flat; 159 active listings in the ZIP; 20 comparable units currently listed for rent nearby; rentals at typical pace (median 22d on market — plan ~3-4 weeks tenant-placement turnaround); 8,053 units permitted in Orange County in 2024 (3,133 in 5+ unit buildings).
Forward outlook
- Local home prices are declining (-3.0%/yr); year-one equity from $1k of loan paydown is wiped out by about $5k of value loss. Plan a longer hold.
- Orange County population projected at +52% by 2050 — long-run rental-demand tailwind backs the buy-and-hold thesis.
Negotiation context
- It's been on market 56 days — a 3% lower offer ($175k) is reasonable based on typical stale-listing flexibility.
- 4 sale attempts since 19y ago with the ask held roughly flat each time — persistent listings suggest the price (not the market) is what's stuck; bring a comps-based counter.
- Current owner paid $65k; list at $180k implies a 177% gain — meaningful room to come down on a strong offer.
Risks & watch-outs
- Watch-outs: built in 1954 — expect roof / HVAC / electrical / plumbing capex.
- Climate carrying-cost: severe wind risk, 99% chance of damaging wind over 30y; extreme-heat days projected 7→22/yr by 2055 (HVAC capex compounding) — expect insurance premiums to compound above CPI over the hold.
Questions for the listing agent
- It's been on market 56 days. Have you received any prior offers? Is the seller open to a 21% concession, seller financing, or rate buy-down credit?
- Built in 1954 — when were the roof, HVAC, electrical panel, plumbing, and water heater last replaced?
- Is there a deadline driving the sale (1031 exchange, divorce, estate, relocation)? That informs how much negotiation room exists.
- Schools are D-rated, which usually means shorter tenancies and higher turnover. Who's the typical renter profile here, and what's been the actual vacancy rate?
- Crime grade is F in this area — have there been break-ins, vandalism, or insurance claims at this property in the last 3 years? What carrier currently insures it and at what premium?
- The area grade is low — what's the realistic commute time and amenity access for the typical tenant pool here? Any planned neighborhood developments (good or bad) we should know about?
- What's the average days-on-market for RENTAL listings here right now (not sales)? A rising rental-DOM trend means longer vacancies and softer asking-rent achievability than the comps imply.
- What's the recent tenant-quality profile in this submarket — average credit score on applications, eviction rate, late-payment / NSF rate, and stable-employment percentage? A property-management company in the area should have these aggregated.
- How much new for-sale + rental construction is in the pipeline within 1–3 miles? Heavy new supply typically softens prices + rents 12–24 months out; constrained supply supports both.
Investment metrics
- 1% rule
- 0.79% ✗
- Cap rate
- 6.40%
- Cash-on-cash
- 0.40%
- DSCR
- 1.02
- GRM
- 10.6
CMA / ARV
No comps found within radius.
Projected returns pro-forma
-3.0% appreciation · 0.5% rent growth · sell at horizon
- IRR
- -18.2%
- Equity multiple
- 0.37×
- Total profit
- $-31,629
- Equity at exit
- $26,824
- IRR
- -15.7%
- Equity multiple
- 0.21×
- Total profit
- $-40,007
- Equity at exit
- $15,554
Cash invested: $50,372 (down + closing). Projections, not guarantees.
Landlord ↔ Tenant lean methodology
- Overall (STATE)
- 87 Strongly Landlord-Friendly
- State Florida
- 87 Strongly Landlord-Friendly · R+3
- County
- — inherits STATE
- City
- — inherits STATE
ZIP-level market 32810
- Home prices YoY
- -18.5%
- Rents YoY
- 0.5%
- Active inventory
- 159
- Price-to-rent
- 10.6×
Monthly cashflow live
- Estimated rent
- $1,417 high interval (Pro) →
- Mortgage (P&I)
- −$943
- Tax from tax record
- −$84 /mo · $1,013/yr
- Insurance
- −$75
- HOA
- −$0
- Vacancy / Maint / Mgmt
- −$298
- Net cashflow
- $17
Break-even live
UW: 25.0% down · 7.5% · 30yr · 1.5% tax · 5.0% vac · 8.0% maint · 8.0% mgmt
Financing live
Cash to close
- Down payment
- $44,975
- Closing costs
- $5,397
- Reserves months
- —
- Total cash needed
- —
Loan-product check · same deal, 3 products live
Conventional
25% down · 7.5% · 30yr
- Down + closing
- —
- Monthly P&I
- —
- Monthly cashflow
- —
- DSCR
- —
- Eligible?
- —
Personal DTI + credit; lowest rate.
DSCR
20% down · 8.5% · 30yr
- Down + closing
- —
- Monthly P&I
- —
- Monthly cashflow
- —
- DSCR
- —
- Eligible?
- —
No personal income docs; deal must DSCR.
Hard money
10% down · 12.0% · 12mo
- Down + closing
- —
- Monthly P&I
- —
- Monthly cashflow
- —
- DSCR
- —
- Eligible?
- —
Short-term bridge; refi at stabilization.
Rent comps 20 comps
| Address | Beds | Baths | Sqft | Rent | $/sqft | DOM | Units | Dist |
|---|---|---|---|---|---|---|---|---|
| 5547 Kingswood Dr Unit B Orlando, FL | 1.0 | 1.0 | 700 | $1,650 | $2.36 | 23d | 1 | 0.49mi |
| 114 Eaton St Unit 3 Eatonville, FL | 2.0 | 1.0 | 750 | $1,190 | $1.59 | 2d | 1 | 0.63mi |
| 118 Eaton St Unit 4 Eatonville, FL | 1.0 | 1.0 | 600 | $1,050 | $1.75 | 7d | 1 | 0.65mi |
| 1125 Lake Shadow Cir Maitland, FL | 1.0 | 1.0 | 714 | $1,338 | $1.87 | 21d | 2 | 0.68mi |
| 1400 Lake Shadow Cir #10206 Maitland, FL | 1.0 | 1.0 | 672 | $1,350 | $2.01 | 23d | 1 | 0.76mi |
| 1275 Lake Shadow Cir #13305 Maitland, FL | 1.0 | 1.0 | 672 | $1,385 | $2.06 | 23d | 1 | 0.76mi |
| 301 Clark St Maitland, FL | 1.0 | 1.0 | 540 | $1,099 | $2.04 | 23d | 1 | 0.79mi |
| 200 S West St Maitland, FL | 1.0–2.0 | 1.0 | 720 | $1,395 | $1.94 | 3d | 1 | 1.01mi |
| 5236 Davisson Ave Orlando, FL | 1.0 | 1.0 | 540 | $1,095 | $2.03 | 23d | 1 | 1.06mi |
| 5258 Davisson Ave Unit A Orlando, FL | 1.0 | 1.0 | 540 | $1,000 | $1.85 | 23d | 1 | 1.07mi |
| 2500 Lee Rd Winter Park, FL | 1.0–2.0 | 1.0–2.0 | 800 | $1,495 | $1.87 | 7d | 3 | 1.27mi |
| 2500 Lee Rd Winter Park, FL | 1.0–2.0 | 1.0–2.0 | 800 | $1,495 | $1.87 | 23d | 2 | 1.27mi |
| 8636 Villa Pt Orlando, FL | 1.0–3.0 | 1.0–2.0 | 1156 | $1,804 | $1.56 | 1d | 38 | 1.32mi |
| 7120 Forest City Rd Orlando, FL | 1.0–3.0 | 1.0–2.0 | 912 | $1,270 | $1.39 | 7d | 11 | 1.37mi |
| 7618 Forest City Rd Orlando, FL | 1.0–3.0 | 1.0–2.0 | 937 | $1,438 | $1.53 | 4d | 3 | 1.41mi |
| 4521 Edgewater Dr Unit 1 Orlando, FL | 2.0 | 1.0 | 467 | $1,650 | $3.53 | 21d | 1 | 1.43mi |
| 1709 Fairview Shores Dr Orlando, FL | 1.0 | 1.0 | 720 | $1,550 | $2.15 | 14d | 1 | 1.43mi |
| 948 Lake Destiny Rd Unit C Altamonte Springs, FL | 1.0 | 1.0 | 625 | $1,200 | $1.92 | 23d | 1 | 1.48mi |
| 948 Lake Destiny Rd Altamonte Springs, FL | 1.0 | 1.0 | 625 | $1,250 | $2.00 | 3d | 1 | 1.49mi |
| 946 Lake Destiny Rd Unit E Altamonte Springs, FL | 1.0 | 1.0 | 462 | $1,150 | $2.49 | 23d | 1 | 1.49mi |
Listing history 8 events
-
2026-04-27status Pending
-
2026-04-06status Active
-
2026-02-17status Pending
-
2026-01-13status Active
-
2026-01-12$179,900 Active
-
2007-04-23soldstatus $64,900
-
2007-04-16soldstatus $64,900 124-char remark
Show marketing remark (124 chars)
Small home in need of repairs. Perfect for investor in convenient location. This property is priced to sell and a great buy!
-
2007-02-26$69,900 124-char remark
Show marketing remark (124 chars)
Small home in need of repairs. Perfect for investor in convenient location. This property is priced to sell and a great buy!
ⓘ Source: listings_history table (triggers on properties + properties_extension) + one-shot
backfill from property_details.listing_events for pre-trigger history.
Tax reassessment forecast FL · Resets to sale price
- Current annual tax
- $1,013 · $84/mo
- Projected year-2 tax
- $1,493 · $124/mo
- Expected delta
- +$481/yr (+$40/mo · 47.5%)
ⓘ Screening estimate from a state-policy table — verify with the county assessor before closing.
Climate risk First Street
- Flood 1/10 Low FEMA zone X (unshaded) · 0% chance over 30 yrs
- Wildfire 1/10 Low
- Heat 9/10 Extreme 7 d/yr ≥108°F today · 22 d/yr by 30 yrs out
- Wind 9/10 Extreme 99% chance of damaging wind over 30 yrs
- Air quality 2/10 Low 0 unhealthy d/yr today · 1 by 30 yrs out
Nearby sold comps map
Loading sold comps map…
Walkable amenities ~0.75 mi
Loading nearby amenities…
Taxation est. · year 1
- Rental income
- $17,005
- − Mortgage interest
- −$10,077
- − Property taxes
- −$1,013
- − Insurance
- −$900
- − Repairs & maintenance
- −$1,360
- − Management
- −$1,360
- − Depreciation
- −$5,233
- Taxable loss
- −$2,939
- Est. tax savings @ 24.0%
- +$705
- After-tax cash flow
- $906/yr
For passive investors: Depreciation is non-cash, so a rental often shows a tax loss while cash-flowing — sheltering income. Rental losses are passive: they offset passive income freely, and up to $25,000/yr can offset ordinary (W-2) income if you actively participate and your MAGI is under $100k (phasing out to $0 by $150k); unused losses carry forward. On sale, claimed depreciation is recaptured at up to 25%, and gains may owe capital-gains tax (a 1031 exchange can defer both). Figures are a year-1 estimate at your 24.0% rate — not tax advice; consult a CPA.
Schools (NCES district)
- District
- Orange
- NCES district ID
- 1201440
- Math proficiency
- 46% ▼ -9.00%
- Reading proficiency
- 51% ▼ -2.00%
- Median HH income
- $49,350
- Composite
- 41.47/100
- National rank
- #3461
- State rank
- #43 of 73 in FL
Livability — Eatonville
- Score
- 63/100
- State rank
- #721
- US rank
- #15456
Category grades
Schools grade is shown separately in the Schools card above.
Census & demographics
- Census place
- Eatonville, FL
- County
- Orange County · 1,471,359 people
- Metro
- Orlando-Kissimmee-Sanford, FL
- Population (ZIP)
- 36,927
- Household income
- $60,799
- Rent vs Own
- Severe rent burden
- 1859.0
Population outlook (Orange County) Hauer SSP2
- Today (2025)
- 1,618,226 people
- By 2030
- 1,787,404 · +10.5%
- By 2040
- 2,125,621 · +31.4%
- By 2050
- 2,454,016 · +51.6%
- By 2075
- 3,173,711 · +96.1%
- By 2100
- 3,607,781 · +122.9%
Race, ethnicity, and origin ACS 2023
- Neighborhood character
- Highly diverse neighborhood (Simpson 0.72)
- Race & ethnicity
- Black 35% Hispanic / Latino 29% White 25% Two or more races 16% Asian 3% Native American 1%
- Hispanic origin (detail)
- Mexican 2% Puerto Rican 17% Cuban 3%
- Common ancestry
- Hispanic 9% Lithuanian 1% Slovak 1%
- Foreign-born
- 19% · Canada, Vietnam, Jamaica
- Languages at home
- 67% English-only · Spanish 21% French/Haitian/Cajun 7% Other Indo-European 1%
Political lean MEDSL · Orange
- 2024 margin
- D (+13.6) · D 56.1% · R 42.5% · Other 1.3%
- 2008→2024 swing
- -5.0pp toward R · 2008: 18.6pp · 2024: 13.6pp
- All cycles
- 2024: D+13.6 2020: D+23.1 2016: D+24.6 2012: D+18.2 2008: D+18.6
Not yet ingested
- Civics
- —
Market trends
- HPI YoY
- ▼ -78.77%
- Current HPI
- 347.7447
- Rent YoY
- ▲ 0.50%
- Metro
- Orlando-Kissimmee-Sanford, FL
- State GDP YoY
- ▲ 3.28%
- F500 in state
- 36
Industry mix (Fortune 500 HQ in FL)
| Industry | F500 HQs | Revenue |
|---|---|---|
| Industrial Technology | 2 | $29B |
|
||
| Insurance | 2 | $17B |
|
||
| Retail | 1 | $60B |
|
||
| Technology Distribution | 1 | $58B |
|
||
| Homebuilding | 1 | $35B |
|
||
| Technology Manufacturing | 1 | $35B |
|
||
Price history
+157.4% since first listed8 events — show timeline
- 2026-04-27 Pending — Stellar MLS as Distributed by MLS Grid
- 2026-04-06 Relisted — Stellar MLS as Distributed by MLS Grid
- 2026-02-17 Pending — Stellar MLS as Distributed by MLS Grid
- 2026-01-13 Relisted — Stellar MLS as Distributed by MLS Grid
- 2026-01-12 Listed $179,900 Stellar MLS as Distributed by MLS Grid
- 2007-04-23 Sold (Public Records) $64,900 Public Records
- 2007-04-16 Sold (MLS) $64,900 Stellar MLS as Distributed by MLS Grid
- 2007-02-26 Listed $69,900 Stellar MLS as Distributed by MLS Grid
Property tax history
+4.5%/yrLatest (2025): $1,013 · +5.5% YoY. Source: county tax records.
Cash-flow waterfall
monthlySold comps — $/sqft
last 12 mo · ≤1 miLoading sold comps…