 🏗️ New Construction
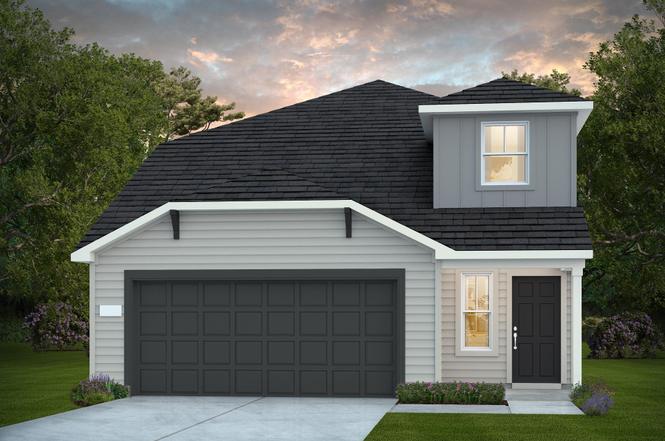
6918 Bens Lndg · Cove, TX
Flood risk 1/10 · Minimal
- FEMA flood zone
- X (unshaded)
- Chance of flooding over 30 yrs
- 0.0%
- Est. flood insurance / yr
- $507 – $1,088
Fire risk 4/10 · Minor
- Est. fire insurance / yr
- $1,222 – $2,270
Heat risk 9/10 · Severe
- Hot days now (above 111°F)
- 7 days/yr
- Hot days in 30 yrs
- 25 days/yr
Wind risk 9/10 · Severe
- Chance of severe wind over 30 yrs
- 99.0%
Air-quality risk 2/10 · Minimal
- Unhealthy air days now
- 1 days/yr
- Unhealthy air days in 30 yrs
- 1 days/yr
Risk factors via First Street. Map © Google.
Why this score? — see what drove the F grade
The composite is a weighted blend of 9 inputs, each scored 0–100. Each bar is that input's sub-score; the figure is the points it added to the 100-point composite (weight × sub-score).
- ARV discount +7.5/15.0
- Cash flow +7.4/30.0
- Schools +6.2/10.0
- Rent growth +3.4/5.0
- Livability +3.2/5.0
- Condition / age +2.5/5.0
- 1% rule +2.4/10.0
- DSCR +1.6/10.0
- Appreciation +0.0/10.0
$319,440
🖨 Deal sheet (PDF) 📄 Offer letter ✓ Due diligence
Listing remarks
This spacious two-story home offers comfort, functionality, and plenty of room for everyday living and entertaining. The first floor features an open-concept kitchen, café, and gathering room, plus a versatile flex room ideal for an office, playroom, or dining. The owner’s suite includes a large bedroom, dual-sink bath, walk-in shower, and walk-in closet. A powder room, storage closet, laundry room, and 2-car garage access add convenience. Upstairs are three bedrooms—each with walk-in closets—a shared full bath, and a large loft perfect for media, play, or study. Open railing overlooking the foyer adds an airy feel, while an optional covered patio expands outdoor li
Key facts
- Open concept kitchen
- Large loft
- Flex room
Tags
Neighborhood map
What this means for you Summary
Snapshot
- This is a 4-bed/2.5-bath single-family listed at $319k.
Deal economics
- At list price, monthly cash flow is $-476 ($-6k/yr) — negative.
- To cash-flow at today's rent, offer at most $304k (4.9% below list).
- To meet the 1% rule (rent ≥ 1% of price), the offer needs to be $275k (13.8% below list).
- Recommended offer: $275k (13.8% below list) — sets the bar for 1% rule.
Location & tenants
- Location reads 64/100 on livability (#766 in TX) — a middle-class / working-renter tenant base. Strengths: employment A+, housing A+, crime A; Watch: amenities F, commute F, health & safety F.
- Barbers Hill ISD (rural): math 72% / reading 65% proficiency, ranked #12 of 826 in TX (top 2%) — acceptable for families but not a draw, mixed tenant base, ~2y average lease.
- Zoned schools: Barbers Hill El South (math 68% / reading 62%, grade B+, #246 of 4,322 statewide, top 6%, 883 students, 37% FRL); Barbers Hill Middle South (math 77% / reading 63%, grade A, #58 of 1,662 statewide, top 4%, 636 students, 0% FRL); Barbers Hill H S (math 70% / reading 74%, grade B+, #95 of 1,632 statewide, top 7%, 1,972 students, 0% FRL) — zoned schools average 12% FRL vs 28% district-wide (16 pts lower); this property's tenant base skews higher-income than the district average.
- Market conditions: Rents rising (+3.4%/yr); 781 active listings in the ZIP; 4 comparable units currently listed for rent nearby; rentals at typical pace (median 26d on market — plan ~3-4 weeks tenant-placement turnaround); high-income renter base; 629 units permitted in Chambers County in 2024 (0 in 5+ unit buildings).
Forward outlook
- Local home prices are declining (-3.0%/yr); year-one equity from $3k of loan paydown is wiped out by about $11k of value loss. Plan a longer hold.
- Chambers County population projected at +46% by 2050 — long-run rental-demand tailwind backs the buy-and-hold thesis.
Negotiation context
- It's been on market 24 days — a 2% lower offer ($315k) is reasonable based on typical stale-listing flexibility.
- 2 sale attempts; this cycle's ask has dropped $19k (6%) from the opening price — seller is motivated, your offer sets the floor, not the list.
Risks & watch-outs
- Climate carrying-cost: severe wind risk, 99% chance of damaging wind over 30y; extreme-heat days projected 7→25/yr by 2055 (HVAC capex compounding) — expect insurance premiums to compound above CPI over the hold.
Questions for the listing agent
- What do current leases actually rent for vs. the listed asking? Can we see a recent rent roll and the last 12 months of T-12 income?
- What does the HOA fee cover, when was the last increase, and are there any pending special assessments or reserve-fund shortfalls?
- Is there a deadline driving the sale (1031 exchange, divorce, estate, relocation)? That informs how much negotiation room exists.
- Schools are D-rated, which usually means shorter tenancies and higher turnover. Who's the typical renter profile here, and what's been the actual vacancy rate?
- The area grade is low — what's the realistic commute time and amenity access for the typical tenant pool here? Any planned neighborhood developments (good or bad) we should know about?
- What's the average days-on-market for RENTAL listings here right now (not sales)? A rising rental-DOM trend means longer vacancies and softer asking-rent achievability than the comps imply.
- What's the recent tenant-quality profile in this submarket — average credit score on applications, eviction rate, late-payment / NSF rate, and stable-employment percentage? A property-management company in the area should have these aggregated.
- How much new for-sale + rental construction is in the pipeline within 1–3 miles? Heavy new supply typically softens prices + rents 12–24 months out; constrained supply supports both.
Investment metrics
- 1% rule
- 0.74% ✗
- Cap rate
- 4.76%
- Cash-on-cash
- -5.47%
- DSCR
- 0.76
- GRM
- 11.3
CMA / ARV
- ARV (on-the-fly)
- $372,792
- Comps found
- 12
Show comp detail 12 sales within ~0.75 mi
| Address | Dist | Beds/Ba | Sqft | Sold | Price | $/sf | Match |
|---|---|---|---|---|---|---|---|
| 6711 Alejandro Pl | 0.25mi | 4/2.5 | 2,530 (-0%) | 1mo | $379,990 | $150 | 87 |
| 515 Louis Ln | 0.27mi | 4/2.5 | 2,536 (0%) | 8mo | $319,990 | $126 | 81 |
| 6735 Camila St | 0.32mi | 4/2.5 | 2,466 (-3%) | 2mo | $314,990 | $128 | 79 |
| 6707 Camila St | 0.23mi | 4/3.0 | 2,600 (+2%) | 8mo | $343,720 | $132 | 77 |
| 7118 Thomas James Ct | 0.08mi | 4/2.5 | 2,218 (-12%) | 1mo | $326,130 | $147 | 75 |
| 6706 Augusta Greens Dr | 0.24mi | 4/2.5 | 2,339 (-8%) | 8mo | $363,500 | $155 | 69 |
| 6739 Camila St | 0.32mi | 4/2.5 | 2,285 (-10%) | 2mo | $314,990 | $138 | 67 |
| 427 Ruby Ford Dr | 0.33mi | 4/2.5 | 2,285 (-10%) | 2mo | $319,990 | $140 | 67 |
| 211 Brazos Dr | 0.61mi | 4/3.0 | 2,488 (-2%) | 2mo | $429,000 | $172 | 65 |
| 523 Louis Ln | 0.29mi | 4/2.5 | 2,218 (-12%) | 6mo | $299,990 | $135 | 60 |
| 230 San Marcos Dr | 0.71mi | 4/3.5 | 2,711 (+7%) | 2mo | $399,000 | $147 | 50 |
| 8419 Rio Spring Dr | 0.74mi | 4/3.0 | 2,180 (-14%) | 4mo | $339,340 | $156 | 36 |
Match score weights: distance 35% · size 25% · config 20% · recency 20%. Top-matched comps best support the ARV.
Projected returns pro-forma
-3.0% appreciation · 3.42% rent growth · sell at horizon
- IRR
- -25.1%
- Equity multiple
- 0.14×
- Total profit
- $-89,465
- Equity at exit
- $55,584
- IRR
- -19.8%
- Equity multiple
- -0.07×
- Total profit
- $-111,745
- Equity at exit
- $32,232
Cash invested: $104,382 (down + closing). Projections, not guarantees.
Landlord ↔ Tenant lean methodology
- Overall (STATE)
- 87 Strongly Landlord-Friendly
- State Texas
- 87 Strongly Landlord-Friendly · R+5
- County
- — inherits STATE
- City
- — inherits STATE
ZIP-level market 77523
- Home prices YoY
- -31.5%
- Rents YoY
- 3.4%
- Active inventory
- 781
- Price-to-rent
- 9.7×
Monthly cashflow live
- Estimated rent
- $2,754 medium interval (Pro) →
- Mortgage (P&I)
- −$1,955
- Tax est. 1.5%
- −$466 /mo · $5,592/yr
- Insurance
- −$155
- HOA
- −$75
- Vacancy / Maint / Mgmt
- −$578
- Net cashflow
- $-476
Break-even live
Sensitivity live
| Price | -10% $-218 | -5% $-347 | +0% $-476 | +5% $-605 | +10% $-734 |
|---|---|---|---|---|---|
| Rent | -10% $-693 | -5% $-585 | +0% $-476 | +5% $-367 | +10% $-258 |
| Rate | -1.0pp $-288 | -0.5pp $-381 | base $-476 | +0.5pp $-573 | +1.0pp $-671 |
UW: 25.0% down · 7.5% · 30yr · 1.5% tax · 5.0% vac · 8.0% maint · 8.0% mgmt
Financing live
Cash to close
- Down payment
- $93,198
- Closing costs
- $11,184
- Reserves months
- —
- Total cash needed
- —
Loan-product check · same deal, 3 products live
Conventional
25% down · 7.5% · 30yr
- Down + closing
- —
- Monthly P&I
- —
- Monthly cashflow
- —
- DSCR
- —
- Eligible?
- —
Personal DTI + credit; lowest rate.
DSCR
20% down · 8.5% · 30yr
- Down + closing
- —
- Monthly P&I
- —
- Monthly cashflow
- —
- DSCR
- —
- Eligible?
- —
No personal income docs; deal must DSCR.
Hard money
10% down · 12.0% · 12mo
- Down + closing
- —
- Monthly P&I
- —
- Monthly cashflow
- —
- DSCR
- —
- Eligible?
- —
Short-term bridge; refi at stabilization.
Rent comps 4 comps
| Address | Beds | Baths | Sqft | Rent | $/sqft | DOM | Units | Dist |
|---|---|---|---|---|---|---|---|---|
| 14930 Spring Forest Ln Baytown, TX | 4.0 | 2.0 | 1829 | $2,750 | $1.50 | 45d | 1 | 0.32mi |
| 14739 Sweet Water Dr Baytown, TX | 4.0 | 2.0 | 1821 | $2,395 | $1.32 | 3d | 1 | 0.50mi |
| 8411 Hannah Rd Baytown, TX | 4.0 | 2.5 | 2329 | $2,195 | $0.94 | 26d | 1 | 1.34mi |
| 8414 Liberty Sky Rd Baytown, TX | 3.0 | 2.5 | 2046 | $2,095 | $1.02 | 26d | 1 | 1.36mi |
HOA detail
- Monthly dues
- $75 · $900/yr
Listing history 6 events
-
2026-03-30status Pending
-
2026-03-19price $319,440
-
2026-03-06$338,430 Active
-
2026-03-06historical
-
2026-01-26price $338,430
-
2025-12-03$342,030 Active
ⓘ Source: listings_history table (triggers on properties + properties_extension) + one-shot
backfill from property_details.listing_events for pre-trigger history.
Climate risk First Street
- Flood 1/10 Low FEMA zone X (unshaded) · 0% chance over 30 yrs
- Wildfire 4/10 Moderate
- Heat 9/10 Extreme 7 d/yr ≥111°F today · 25 d/yr by 30 yrs out
- Wind 9/10 Extreme 99% chance of damaging wind over 30 yrs
- Air quality 2/10 Low 1 unhealthy d/yr today · 1 by 30 yrs out
Nearby sold comps map
Loading sold comps map…
Walkable amenities ~0.75 mi
Loading nearby amenities…
Taxation est. · year 1
- Rental income
- $33,043
- − Mortgage interest
- −$20,882
- − Property taxes
- −$5,592
- − Insurance
- −$1,864
- − Repairs & maintenance
- −$2,643
- − Management
- −$2,643
- − HOA
- −$900
- − Depreciation
- −$10,845
- Taxable loss
- −$12,327
- Est. tax savings @ 24.0%
- +$2,958
- After-tax cash flow
- $-2,753/yr
For passive investors: Depreciation is non-cash, so a rental often shows a tax loss while cash-flowing — sheltering income. Rental losses are passive: they offset passive income freely, and up to $25,000/yr can offset ordinary (W-2) income if you actively participate and your MAGI is under $100k (phasing out to $0 by $150k); unused losses carry forward. On sale, claimed depreciation is recaptured at up to 25%, and gains may owe capital-gains tax (a 1031 exchange can defer both). Figures are a year-1 estimate at your 24.0% rate — not tax advice; consult a CPA.
Schools (NCES district)
- District
- Barbers Hill ISD
- NCES district ID
- 4809450
- Math proficiency
- 72% ▼ -5.00%
- Reading proficiency
- 65% ▼ -1.00%
- Median HH income
- $87,257
- Composite
- 61.73/100
- National rank
- #737
- State rank
- #12 of 826 in TX
Livability — Cove
- Score
- 64/100
- State rank
- #766
- US rank
- #13996
Category grades
Schools grade is shown separately in the Schools card above.
Census & demographics
- County
- Chambers County · 30,186 people
- Metro
- Houston-The Woodlands-Sugar Land, TX
- Population (ZIP)
- 30,186
- Household income
- $124,188
- Rent vs Own
- Severe rent burden
- 549.0
Population outlook (Chambers County) Hauer SSP2
- Today (2025)
- 46,946 people
- By 2030
- 51,094 · +8.8%
- By 2040
- 59,578 · +26.9%
- By 2050
- 68,318 · +45.5%
- By 2075
- 90,485 · +92.7%
- By 2100
- 104,885 · +123.4%
Race, ethnicity, and origin ACS 2023
- Neighborhood character
- Majority White (62%)
- Race & ethnicity
- White 62% Hispanic / Latino 25% Two or more races 11% Black 8% Asian 2%
- Hispanic origin (detail)
- Mexican 22%
- Common ancestry
- Lithuanian 1% Slovak 1% Serbian 1%
- Foreign-born
- 9% · Canada
- Languages at home
- 82% English-only · Spanish 17%
Political lean MEDSL · Chambers
- 2024 margin
- Solid R (+65.6) · D 16.8% · R 82.4%
- 2008→2024 swing
- -14.4pp toward R · 2008: -51.2pp · 2024: -65.6pp
- All cycles
- 2024: R+65.6 2020: R+61.7 2016: R+62.1 2012: R+61.1 2008: R+51.2
Not yet ingested
- Civics
- —
Market trends
- HPI YoY
- ▼ -102.33%
- Current HPI
- 222.6999
- Rent YoY
- ▲ 3.42%
- Metro
- Houston-The Woodlands-Sugar Land, TX
- State GDP YoY
- ▲ 3.95%
- F500 in state
- 110
Industry mix (Fortune 500 HQ in TX)
| Industry | F500 HQs | Revenue |
|---|---|---|
| Energy | 16 | $1,198B |
|
||
| Technology | 5 | $198B |
|
||
| Engineering / Construction | 4 | $72B |
|
||
| Energy Services | 3 | $60B |
|
||
| Utilities | 3 | $41B |
|
||
| Healthcare | 2 | $330B |
|
||
Price history
-6.6% since first listed6 events — show timeline
- 2026-03-30 Pending — HARMLS
- 2026-03-19 Price Changed $319,440 HARMLS
- 2026-03-06 Listing Removed — HARMLS
- 2026-03-06 Listed $338,430 HARMLS
- 2026-01-26 Price Changed $338,430 HARMLS
- 2025-12-03 Listed $342,030 HARMLS
Cash-flow waterfall
monthlySold comps — $/sqft
last 12 mo · ≤1 miLoading sold comps…