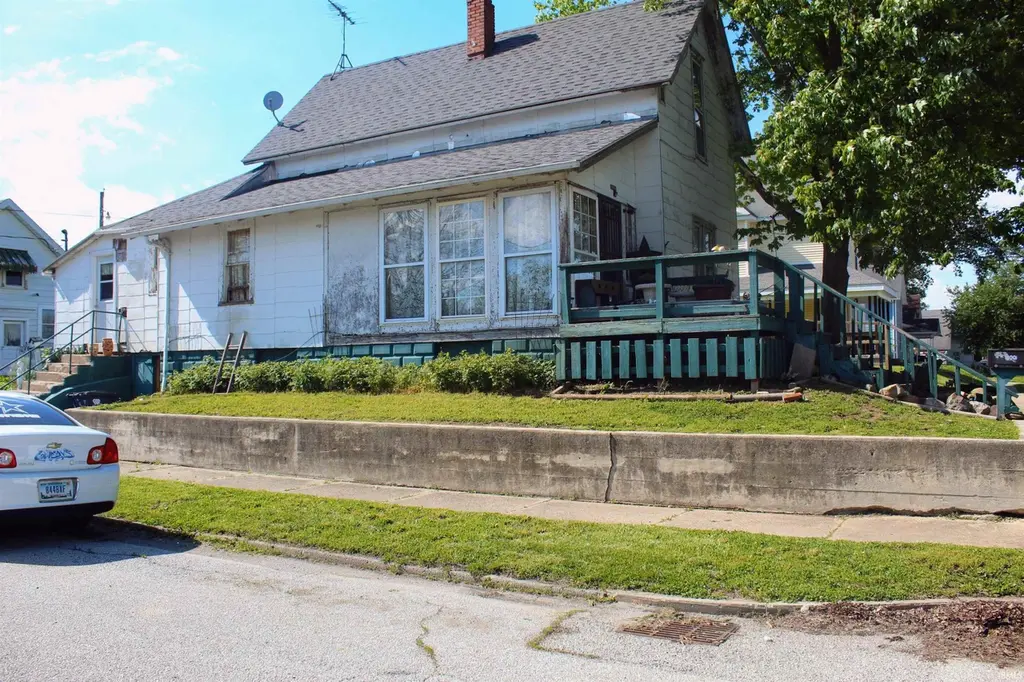
800 N Gentry St · Frankfort, IN
Flood risk 1/10 · Minimal
- FEMA flood zone
- X (unshaded)
- Chance of flooding over 30 yrs
- 0.0%
- Est. flood insurance / yr
- $473 – $860
Fire risk 1/10 · Minimal
- Est. fire insurance / yr
- $717 – $1,331
Heat risk 3/10 · Minor
- Hot days now (above 101°F)
- 7 days/yr
- Hot days in 30 yrs
- 18 days/yr
Wind risk 2/10 · Minimal
- Chance of severe wind over 30 yrs
- —
Air-quality risk 3/10 · Minor
- Unhealthy air days now
- 2 days/yr
- Unhealthy air days in 30 yrs
- 3 days/yr
Risk factors via First Street. Map © Google.
Why this score? — see what drove the B- grade
The composite is a weighted blend of 9 inputs, each scored 0–100. Each bar is that input's sub-score; the figure is the points it added to the 100-point composite (weight × sub-score).
- Cash flow +26.2/30.0
- ARV discount +15.0/15.0
- DSCR +8.8/10.0
- 1% rule +6.1/10.0
- Livability +3.7/5.0
- Rent growth +2.5/5.0
- Condition / age +2.5/5.0
- Schools +2.4/10.0
- Appreciation +0.0/10.0
$99,900
🖨 Deal sheet 📄 Offer letter ✓ Due diligence
Listing remarks
Great opportunity for investors or buyers looking to build equity. Home is in need of updates and repairs and is being sold as-is. Strong potential with a convenient Frankfort location.
Key facts
- 2,178 sq ft lot
- Built 1939
- Listed 37 days
Property features AI
Exterior
- Utilities: Public water; Public sewer
- Home design: Single-family residence, site-built; 2 stories
- Construction: Wood siding exterior
- Exterior features: Lot dimensions approximately 33 x 66
Interior
- Bedrooms: Bedrooms located on main level
- Bathrooms: 2 full bathrooms, both on the main level
- Heating & cooling: Central air conditioning; Natural gas forced air heating
- Interior features: 6 total rooms; Crawl space, full unfinished basement
- Laundry & utility: Main level laundry with electric dryer hookup
Neighborhood map
What this means for you Summary
Snapshot
- This is a 3-bed/1.0-bath single-family listed at $100k.
Deal economics
- At list price, monthly cash flow is $254 ($3k/yr) — positive.
- The deal already cash-flows at list — no discount required.
- Meets the 1% rule at list price ($1k rent vs $100k).
- Recommended offer: $97k (3.0% below list) — sets the bar for market timing.
- Cap rate 9.3% vs local median 3.9% in Frankfort — top-decile yield for the area; either an underpriced asset or a hidden risk that comps aren't pricing in. Stress-test before assuming the spread holds.
Location & tenants
- Location reads 73/100 on livability (#107 in IN) — a middle-class / working-renter tenant base. Strengths: crime A+, cost of living A+, housing A+; Watch: amenities F, commute F, employment D-.
- Community Schools Of Frankfort (rural): math 27% / reading 30% proficiency, ranked #251 of 301 in IN (top 83%) — low school quality limits family demand, transient renter base, plan for 1-2y turnover; 68% free/reduced lunch — lower-income household profile, screen leases tightly.
- Zoned schools: Frankfort Middle School (math 19% / reading 27%, grade F, #263 of 330 statewide, top 80%, 706 students, 83% FRL); Frankfort High School (math 8% / reading 42%, grade F, #323 of 369 statewide, top 88%, 895 students, 75% FRL).
- Market conditions: 129 active listings in the ZIP; 8 comparable units currently listed for rent nearby; rentals leasing fast (median 13d on market — plan ~1-2 weeks tenant-placement turnaround); 59 units permitted in Clinton County in 2024 (0 in 5+ unit buildings).
Forward outlook
- Local home prices are declining (-3.0%/yr); year-one equity from $691 of loan paydown is wiped out by about $3k of value loss. Plan a longer hold.
- Clinton County population projected at -15% by 2050 — secular population decline; favor cash flow + early exit over multi-decade hold.
- At projected returns (-3.0% appreciation + 3.0% rent growth), your $28k cash investment doubles in ~10 years — after that, you're playing with house money.
Negotiation context
- It's been on market 37 days — a 3% lower offer ($97k) is reasonable based on typical stale-listing flexibility.
Risks & watch-outs
- Watch-outs: built in 1939 — expect roof / HVAC / electrical / plumbing capex.
Questions for the listing agent
- It's been on market 37 days. Have you received any prior offers? Is the seller open to a 3% concession, seller financing, or rate buy-down credit?
- Built in 1939 — when were the roof, HVAC, electrical panel, plumbing, and water heater last replaced?
- Is there a deadline driving the sale (1031 exchange, divorce, estate, relocation)? That informs how much negotiation room exists.
- Schools are F-rated, which usually means shorter tenancies and higher turnover. Who's the typical renter profile here, and what's been the actual vacancy rate?
- What's the average days-on-market for RENTAL listings here right now (not sales)? A rising rental-DOM trend means longer vacancies and softer asking-rent achievability than the comps imply.
- What's the recent tenant-quality profile in this submarket — average credit score on applications, eviction rate, late-payment / NSF rate, and stable-employment percentage? A property-management company in the area should have these aggregated.
- How much new for-sale + rental construction is in the pipeline within 1–3 miles? Heavy new supply typically softens prices + rents 12–24 months out; constrained supply supports both.
Investment metrics
- 1% rule
- 1.11% ✓
- Cap rate
- 9.34%
- Cash-on-cash
- 10.89%
- DSCR
- 1.48
- GRM
- 7.5
CMA / ARV
- ARV (median comp)
- $157,973
- List price
- $99,900
- Delta
- -36.76%
- Verdict
- UNDERPRICED
- Comps
- 20 within 1.0 mi
Show comp detail 12 sales within ~0.75 mi
| Address | Dist | Beds/Ba | Sqft | Sold | Price | $/sf | Match |
|---|---|---|---|---|---|---|---|
| 557 W Green St | 0.18mi | 3/1.0 | 1,300 (-3%) | 5mo | $180,000 | $138 | 82 |
| 652 Rossville Ave | 0.30mi | 4/2.5 (+1) | 1,340 (+0%) | 2mo | $237,000 | $177 | 74 |
| 1159 W Mcclurg St | 0.53mi | 3/1.0 | 1,350 (+1%) | 4mo | $134,900 | $100 | 70 |
| 951 W Barner St | 0.38mi | 2/1.0 (-1) | 1,296 (-3%) | 2mo | $165,000 | $127 | 70 |
| 461 W Morrison St | 0.30mi | 3/2.0 | 1,436 (+7%) | 1mo | $200,000 | $139 | 70 |
| 552 Delphi Ave | 0.17mi | 2/1.0 (-1) | 1,184 (-12%) | 2mo | $67,000 | $57 | 66 |
| 458 W Morrison St | 0.27mi | 3/2.0 | 1,232 (-8%) | 8mo | $189,000 | $153 | 63 |
| 756 Delphi Ave | 0.31mi | 2/1.0 (-1) | 1,462 (+9%) | 6mo | $110,000 | $75 | 61 |
| 1159 Myrtle Ave | 0.56mi | 3/1.0 | 1,176 (-12%) | 0mo | $247,500 | $210 | 53 |
| 1300 Myrtle Ave | 0.62mi | 3/1.0 | 1,172 (-12%) | 1mo | $220,000 | $188 | 49 |
| 1257 W Morrison St | 0.64mi | 2/1.0 (-1) | 1,194 (-11%) | 8mo | $162,000 | $136 | 40 |
| 1258 Magnolia Ave | 0.68mi | 4/2.5 (+1) | 1,446 (+8%) | 7mo | $245,000 | $169 | 38 |
Match score weights: distance 35% · size 25% · config 20% · recency 20%. Top-matched comps best support the ARV.
Projected returns pro-forma
-3.0% appreciation · 3.0% rent growth · sell at horizon
- IRR
- -0.0%
- Equity multiple
- 1.00×
- Total profit
- $-49
- Equity at exit
- $14,895
- IRR
- 9.6%
- Equity multiple
- 1.74×
- Total profit
- $20,674
- Equity at exit
- $8,638
Cash invested: $27,972 (down + closing). Projections, not guarantees.
Landlord ↔ Tenant lean methodology
- Overall (STATE)
- 90 Strongly Landlord-Friendly
- State Indiana
- 90 Strongly Landlord-Friendly · R+11
- County
- — inherits STATE
- City
- — inherits STATE
ZIP-level market 46041
- Home prices YoY
- -17.8%
- Active inventory
- 129
- Price-to-rent
- 7.5×
Monthly cashflow live
- Estimated rent
- $1,113 high interval (Pro) →
- Mortgage (P&I)
- −$524
- Tax from tax record
- −$60 /mo · $717/yr
- Insurance
- −$42
- HOA
- −$0
- Vacancy / Maint / Mgmt
- −$234
- Net cashflow
- $254
Break-even live
UW: 25.0% down · 7.5% · 30yr · 1.5% tax · 5.0% vac · 8.0% maint · 8.0% mgmt
Financing live
Cash to close
- Down payment
- $24,975
- Closing costs
- $2,997
- Reserves months
- —
- Total cash needed
- —
Loan-product check · same deal, 3 products live
Conventional
25% down · 7.5% · 30yr
- Down + closing
- —
- Monthly P&I
- —
- Monthly cashflow
- —
- DSCR
- —
- Eligible?
- —
Personal DTI + credit; lowest rate.
DSCR
20% down · 8.5% · 30yr
- Down + closing
- —
- Monthly P&I
- —
- Monthly cashflow
- —
- DSCR
- —
- Eligible?
- —
No personal income docs; deal must DSCR.
Hard money
10% down · 12.0% · 12mo
- Down + closing
- —
- Monthly P&I
- —
- Monthly cashflow
- —
- DSCR
- —
- Eligible?
- —
Short-term bridge; refi at stabilization.
Rent comps 8 comps
| Address | Beds | Baths | Sqft | Rent | $/sqft | DOM | Units | Dist |
|---|---|---|---|---|---|---|---|---|
| 201 W Palmer St Frankfort, IN | 2.0 | 1.0 | 950 | $1,049 | $1.10 | 43d | 1 | 0.15mi |
| 201 W Palmer St Frankfort, IN | 2.0 | 1.0 | 950 | $1,049 | $1.10 | 12d | 1 | 0.15mi |
| 1052 John St Frankfort, IN | 3.0 | 1.0 | 900 | $1,395 | $1.55 | 13d | 1 | 0.19mi |
| 350 N Main St Unit 3C Frankfort, IN | 2.0 | 2.0 | 970 | $1,200 | $1.24 | 4d | 1 | 0.30mi |
| 1152 N Jackson St Unit 2 Frankfort, IN | 2.0 | 1.0 | 950 | $1,049 | $1.10 | 14d | 1 | 0.32mi |
| 1152 N Jackson St Frankfort, IN | 2.0 | 1.0 | 950 | $1,049 | $1.10 | 12d | 1 | 0.32mi |
| 402 E Green St Frankfort, IN | 3.0 | 1.0 | 1100 | $1,000 | $0.91 | 43d | 1 | 0.36mi |
| 1053 S Jackson St Frankfort, IN | 1.0–2.0 | 1.0 | 850 | $995 | $1.17 | 12d | 2 | 1.06mi |
Listing history 16 events
-
2026-06-18days on market $99,900 Active 37 DOM
-
2026-06-17days on market $99,900 Active 36 DOM
-
2026-06-16days on market $99,900 Active 35 DOM
-
2026-06-15days on market $99,900 Active 34 DOM
-
2026-06-13days on market $99,900 Active 32 DOM
-
2026-06-12pricedays on market $99,900 Active 31 DOM
-
2026-06-09days on market $110,000 Active 28 DOM
-
2026-06-08days on market $110,000 Active 27 DOM
-
2026-06-07days on market $110,000 Active 26 DOM
-
2026-06-07days on market $110,000 Active 25 DOM
-
2026-06-04days on market $110,000 Active 22 DOM
-
2026-06-02days on market $110,000 Active 21 DOM
-
2026-06-01days on market $110,000 Active 20 DOM
-
2026-05-31days on market $110,000 Active 19 DOM
-
2026-05-31days on market $110,000 Active 18 DOM
-
2026-05-12$110,000 Active 185-char remark
ⓘ Source: listings_history table (triggers on properties + properties_extension) + one-shot
backfill from property_details.listing_events for pre-trigger history.
Tax reassessment forecast IN · Partial reset (capped growth)
- Current annual tax
- $717 · $60/mo
- Projected year-2 tax
- $783 · $65/mo
- Expected delta
- +$66/yr (+$6/mo · 9.2%)
ⓘ Screening estimate from a state-policy table — verify with the county assessor before closing.
Climate risk First Street
- Flood 1/10 Low FEMA zone X (unshaded) · 0% chance over 30 yrs
- Wildfire 1/10 Low
- Heat 3/10 Moderate 7 d/yr ≥101°F today · 18 d/yr by 30 yrs out
- Wind 2/10 Low
- Air quality 3/10 Moderate 2 unhealthy d/yr today · 3 by 30 yrs out
Nearby sold comps map
Loading sold comps map…
Walkable amenities ~0.75 mi
Loading nearby amenities…
Taxation est. · year 1
- Rental income
- $13,352
- − Mortgage interest
- −$5,596
- − Property taxes
- −$717
- − Insurance
- −$500
- − Repairs & maintenance
- −$1,068
- − Management
- −$1,068
- − Depreciation
- −$2,906
- Taxable income
- $1,497
- Est. tax owed @ 24.0%
- −$359
- After-tax cash flow
- $2,686/yr
For passive investors: Depreciation is non-cash, so a rental often shows a tax loss while cash-flowing — sheltering income. Rental losses are passive: they offset passive income freely, and up to $25,000/yr can offset ordinary (W-2) income if you actively participate and your MAGI is under $100k (phasing out to $0 by $150k); unused losses carry forward. On sale, claimed depreciation is recaptured at up to 25%, and gains may owe capital-gains tax (a 1031 exchange can defer both). Figures are a year-1 estimate at your 24.0% rate — not tax advice; consult a CPA.
Schools (NCES district)
- District
- Community Schools Of Frankfort
- NCES district ID
- 1803660
- Math proficiency
- 27% ▼ -3.00%
- Reading proficiency
- 30% ▼ -6.00%
- Median HH income
- $42,144
- Composite
- 24.2/100
- National rank
- #7728
- State rank
- #251 of 301 in IN
Livability — Frankfort
- Score
- 73/100
- State rank
- #107
- US rank
- #5623
Category grades
Schools grade is shown separately in the Schools card above.
Census & demographics
- Census place
- Frankfort, IN
- Population (ZIP)
- 23,359
Population outlook (Clinton County) Hauer SSP2
- Today (2025)
- 31,197 people
- By 2030
- 30,257 · -3.0%
- By 2040
- 28,383 · -9.0%
- By 2050
- 26,644 · -14.6%
- By 2075
- 23,858 · -23.5%
- By 2100
- 22,236 · -28.7%
Race, ethnicity, and origin ACS 2023
- Neighborhood character
- Predominantly White (73%)
- Race & ethnicity
- White 73% Hispanic / Latino 24% Two or more races 11%
- Hispanic origin (detail)
- Mexican 22%
- Common ancestry
- Iranian 1% Italian 1% Slovak 1%
- Foreign-born
- 11% · Canada, Philippines
- Languages at home
- 86% English-only · Spanish 14%
Political lean MEDSL · Clinton
- 2024 margin
- Solid R (+48.0) · D 25.2% · R 73.2% · Other 1.6%
- 2008→2024 swing
- -35.0pp toward R · 2008: -13.0pp · 2024: -48.0pp
- All cycles
- 2024: R+48.0 2020: R+46.1 2016: R+48.0 2012: R+30.7 2008: R+13.0
Not yet ingested
- Civics
- —
Market trends
- HPI YoY
- ▼ -57.02%
- Current HPI
- 263.2258
- Rent YoY
- —
- Metro
- —
- State GDP YoY
- ▲ 2.90%
- F500 in state
- 18
Industry mix (Fortune 500 HQ in IN)
| Industry | F500 HQs | Revenue |
|---|---|---|
| Industrial Machinery | 2 | $37B |
|
||
| Healthcare | 1 | $177B |
|
||
| Pharmaceuticals | 1 | $45B |
|
||
| Metals / Steel | 1 | $18B |
|
||
| Agriculture | 1 | $17B |
|
||
| Packaging | 1 | $12B |
|
||
Price history
-9.2% since first listed2 events — show timeline
- 2026-06-12 Price Changed $99,900 IRMLS
- 2026-05-12 Listed $110,000 IRMLS
Property tax history
+6.9%/yrLatest (2024): $717 · +17.2% YoY. Source: county tax records.
Cash-flow waterfall
monthlySold comps — $/sqft
last 12 mo · ≤1 miLoading sold comps…