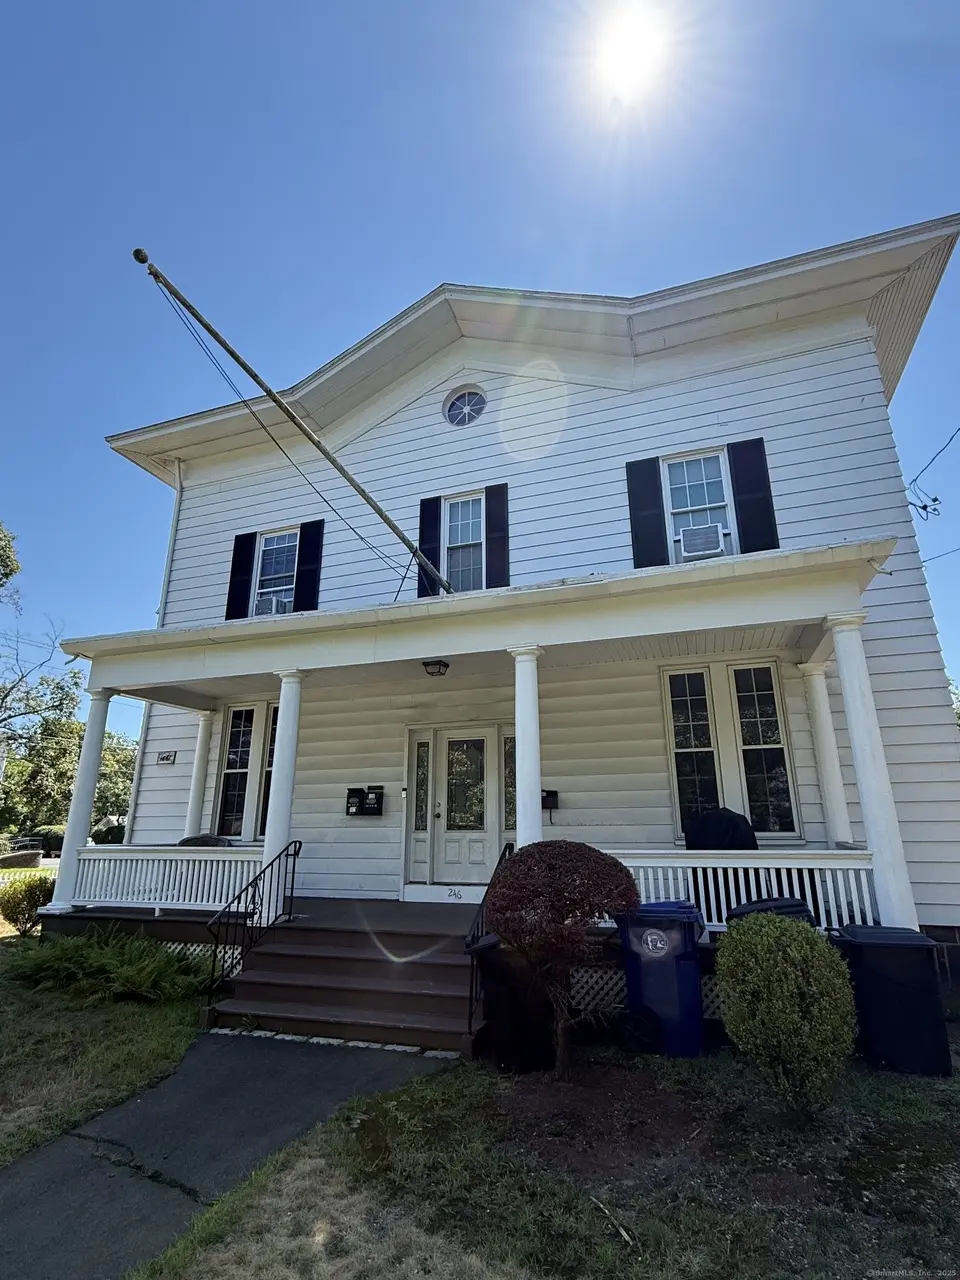
 Triplex
246 Elm St · West Haven, CT
Flood risk 1/10 · Minimal
- FEMA flood zone
- X (unshaded)
- Chance of flooding over 30 yrs
- 0.0%
- Est. flood insurance / yr
- $473 – $860
Fire risk 1/10 · Minimal
- Est. fire insurance / yr
- $829 – $1,539
Heat risk 7/10 · Major
- Hot days now (above 99°F)
- 7 days/yr
- Hot days in 30 yrs
- 17 days/yr
Wind risk 6/10 · Moderate
- Chance of severe wind over 30 yrs
- 55.0%
Air-quality risk 5/10 · Moderate
- Unhealthy air days now
- 5 days/yr
- Unhealthy air days in 30 yrs
- 8 days/yr
Risk factors via First Street. Map © Google.
Why this score? — see what drove the D grade
The composite is a weighted blend of 9 inputs, each scored 0–100. Each bar is that input's sub-score; the figure is the points it added to the 100-point composite (weight × sub-score).
- Cash flow +18.7/30.0
- DSCR +5.9/10.0
- 1% rule +5.0/10.0
- Livability +4.2/5.0
- Rent growth +3.5/5.0
- Schools +2.8/10.0
- Condition / age +2.5/5.0
- ARV discount +0.0/15.0
- Appreciation +0.0/10.0
$659,000
🖨 Deal sheet (PDF) 📄 Offer letter ✓ Due diligence
Multi-family units
County records classify this as Multi-Family (2-4 Unit). Listing-text estimate: 3 units. confirmed
Listing remarks MLS
Fabulous Investment Opportunity. Own this well-maintained fully-rented 3-Family home. The home has 2- 3 Bedroom units with current market rents between $2200-$2400 and 1 - 2 Bedroom unit with current market rents around $1800-$2000. The home also has a 2-car detached garage which generates additional income. Excellent tenants in place and they enjoy the peace and quiet of the neighborhood. Each unit has its own washer/dryer, beautiful hardwood floors and plenty of parking space. Worry-free investment - don't wait; bring in your offers.
Key facts
- Own washer dryer
- Hardwood floors
- 9,583 sq ft lot
Tags
Neighborhood map
What this means for you Summary
Snapshot
- This is a 2×3bd/1.0ba + 1×2bd/1.0ba units multifamily listed at $659k.
Deal economics
- At list price, monthly cash flow is $652 ($8k/yr) — positive. Per door: $217/mo.
- The deal already cash-flows at list — no discount required.
- Meets the 1% rule at list price ($7k rent vs $659k).
- Recommended offer: $619k (6.0% below list) — sets the bar for market timing.
- Cap rate 7.5% vs local median 4.3% in West Haven — top-decile yield for the area; either an underpriced asset or a hidden risk that comps aren't pricing in. Stress-test before assuming the spread holds.
Location & tenants
- Location reads 83/100 on livability (#6 in CT, #915 nationally) — a professional / high-income tenant draw. Strengths: commute A+, housing A+, health & safety A+; Watch: schools D+, amenities D.
- West Haven School District (suburban): math 26% / reading 38% proficiency, ranked #121 of 153 in CT (top 79%) — families likely to look elsewhere, expect single-tenant / working-renter base with shorter leases.
- Market conditions: Rents rising (+3.9%/yr); 146 active listings in the ZIP; 7 comparable units currently listed for rent nearby; rentals leasing fast (median 4d on market — plan ~1-2 weeks tenant-placement turnaround); 1,059 units permitted in South Central Connecticut Planning Region in 2024 (779 in 5+ unit buildings).
- At $6,593/mo this rent would consume 106% of the median local household income ($74k/yr) (locally 2671% of renters already pay >50% of income on rent) — very limited rent-growth headroom before tenants either downsize or default.
Forward outlook
- Local home prices are declining (-3.0%/yr); year-one equity from $5k of loan paydown is wiped out by about $20k of value loss. Plan a longer hold.
Negotiation context
- It's been on market 77 days — a 6% lower offer ($619k) is reasonable based on typical stale-listing flexibility.
- 7 sale attempts since 17y ago with the ask held roughly flat each time — persistent listings suggest the price (not the market) is what's stuck; bring a comps-based counter.
Risks & watch-outs
- Watch-outs: built in 1861 — expect roof / HVAC / electrical / plumbing capex.
- Climate carrying-cost: major wind risk, 55% chance of damaging wind over 30y; extreme-heat days projected 7→17/yr by 2055 (HVAC capex compounding) — expect insurance premiums to compound above CPI over the hold.
Questions for the listing agent
- It's been on market 77 days. Have you received any prior offers? Is the seller open to a 6% concession, seller financing, or rate buy-down credit?
- Can we see the unit-by-unit rent roll, current vacancy, and any below-market leases? What's the average tenancy length?
- What capital expenditures (roof, boiler, parking lot, exteriors) have been made in the last 5 years, and what's planned in the next 2?
- Built in 1861 — when were the roof, HVAC, electrical panel, plumbing, and water heater last replaced?
- Why hasn't it sold? Are there any deal-killer items the seller is aware of (foundation, flood, title, zoning, code violations)?
- Is there a deadline driving the sale (1031 exchange, divorce, estate, relocation)? That informs how much negotiation room exists.
- Schools are D-rated, which usually means shorter tenancies and higher turnover. Who's the typical renter profile here, and what's been the actual vacancy rate?
- The area grade is low — what's the realistic commute time and amenity access for the typical tenant pool here? Any planned neighborhood developments (good or bad) we should know about?
- What's the average days-on-market for RENTAL listings here right now (not sales)? A rising rental-DOM trend means longer vacancies and softer asking-rent achievability than the comps imply.
- What's the recent tenant-quality profile in this submarket — average credit score on applications, eviction rate, late-payment / NSF rate, and stable-employment percentage? A property-management company in the area should have these aggregated.
- How much new apartment / multifamily construction is in the pipeline within 1–3 miles? Heavy new supply (>2% of stock underway) typically softens rents 12–24 months out; light construction supports rent growth.
Investment metrics
- 1% rule
- 1.00% ✓
- Cap rate
- 7.48%
- Cash-on-cash
- 4.24%
- DSCR
- 1.19
- GRM
- 8.3
CMA / ARV
- ARV (median comp)
- $533,330
- List price
- $659,000
- Delta
- 23.56%
- Verdict
- OVERPRICED
- Comps
- 20 within 1.0 mi
Show comp detail 5 sales within ~0.75 mi
| Address | Dist | Beds/Ba | Sqft | Sold | Price | $/sf | Match |
|---|---|---|---|---|---|---|---|
| 638 Washington Ave | 0.02mi | 5/3.0 (+1) | 3,236 (-5%) | 7mo | $515,000 | $159 | 80 |
| 634 Washington Ave | 0.03mi | 5/3.0 (+1) | 3,052 (-10%) | 10mo | $465,000 | $152 | 68 |
| 782 Savin Ave | 0.28mi | 4/2.0 | 3,180 (-7%) | 6mo | $509,000 | $160 | 67 |
| 285 Main St | 0.23mi | 3/3.0 (-1) | 3,738 (+10%) | 3mo | $460,000 | $123 | 66 |
| 541 Savin Ave | 0.62mi | 5/3.0 (+1) | 3,518 (+3%) | 8mo | $605,000 | $172 | 54 |
Match score weights: distance 35% · size 25% · config 20% · recency 20%. Top-matched comps best support the ARV.
Projected returns pro-forma
-3.0% appreciation · 3.9% rent growth · sell at horizon
- IRR
- -8.6%
- Equity multiple
- 0.68×
- Total profit
- $-59,145
- Equity at exit
- $98,259
- IRR
- 2.0%
- Equity multiple
- 1.15×
- Total profit
- $27,542
- Equity at exit
- $56,978
Cash invested: $184,520 (down + closing). Projections, not guarantees.
Landlord ↔ Tenant lean methodology
- Overall (STATE)
- 27 Tenant-Leaning
- State Connecticut
- 27 Tenant-Leaning · D+7
- County
- — inherits STATE
- City
- — inherits STATE
ZIP-level market 06516
- Rents YoY
- 3.9%
- Active inventory
- 146
- Price-to-rent
- 23.9×
Monthly cashflow live
- Estimated rent
- $6,593 high interval (Pro) →
- Mortgage (P&I)
- −$3,456
- Tax from tax record
- −$826 /mo · $9,914/yr
- Insurance
- −$275
- HOA
- −$0
- Vacancy / Maint / Mgmt
- −$1,385
- Net cashflow
- $652
Break-even live
Sensitivity live
| Price | -10% $1,025 | -5% $838 | +0% $652 | +5% $465 | +10% $279 |
|---|---|---|---|---|---|
| Rent | -10% $131 | -5% $391 | +0% $652 | +5% $912 | +10% $1,173 |
| Rate | -1.0pp $984 | -0.5pp $819 | base $652 | +0.5pp $481 | +1.0pp $307 |
3-unit breakdown (identical units grouped — click to expand)
| Units | Beds | Baths | Est. rent |
|---|---|---|---|
| 2× units | 3 | 1 | $4,600 |
| #1 | 3 | 1 | $2,300 |
| #2 | 3 | 1 | $2,300 |
| 1× unit | 2 | 1 | $1,994 |
| Total (3 units) | $6,593 | ||
UW: 25.0% down · 7.5% · 30yr · 1.5% tax · 5.0% vac · 8.0% maint · 8.0% mgmt
Financing live
Cash to close
- Down payment
- $164,750
- Closing costs
- $19,770
- Reserves months
- —
- Total cash needed
- —
Loan-product check · same deal, 3 products live
Conventional
25% down · 7.5% · 30yr
- Down + closing
- —
- Monthly P&I
- —
- Monthly cashflow
- —
- DSCR
- —
- Eligible?
- —
Personal DTI + credit; lowest rate.
DSCR
20% down · 8.5% · 30yr
- Down + closing
- —
- Monthly P&I
- —
- Monthly cashflow
- —
- DSCR
- —
- Eligible?
- —
No personal income docs; deal must DSCR.
Hard money
10% down · 12.0% · 12mo
- Down + closing
- —
- Monthly P&I
- —
- Monthly cashflow
- —
- DSCR
- —
- Eligible?
- —
Short-term bridge; refi at stabilization.
Rent comps 7 comps
| Address | Beds | Baths | Sqft | Rent | $/sqft | DOM | Units | Dist |
|---|---|---|---|---|---|---|---|---|
| 50 Wood St West Haven, CT | 3.0 | 1.0 | 2314 | $2,400 | $1.04 | 3d | 1 | 0.46mi |
| 37 Center St Unit 2 West Haven, CT | 5.0 | 2.0 | 2500 | $3,300 | $1.32 | 3d | 1 | 0.47mi |
| 17 Treadwell St West Haven, CT | 4.0 | 1.0 | 2814 | $2,450 | $0.87 | 24d | 1 | 0.49mi |
| 180 Peck Ave West Haven, CT | 3.0 | 1.0 | 2740 | $2,400 | $0.88 | 24d | 1 | 0.94mi |
| 161 Lamberton St #3 New Haven, CT | 3.0 | 1.0 | 3435 | $1,975 | $0.57 | 3d | 1 | 1.18mi |
| 148 Rosette St Unit 1B New Haven, CT | 3.0 | 1.0 | 4588 | $1,900 | $0.41 | 3d | 1 | 1.34mi |
| 69 Adeline St Unit D New Haven, CT | 3.0 | 1.5 | 2600 | $2,250 | $0.87 | 24d | 1 | 1.40mi |
Listing history 24 events
-
2026-05-18status Under Contract 541-char remark
Show marketing remark (541 chars)
Fabulous Investment Opportunity. Own this well-maintained fully-rented 3-Family home. The home has 2- 3 Bedroom units with current market rents between $2200-$2400 and 1 - 2 Bedroom unit with current market rents around $1800-$2000. The home also has a 2-car detached garage which generates additional income. Excellent tenants in place and they enjoy the peace and quiet of the neighborhood. Each unit has its own washer/dryer, beautiful hardwood floors and plenty of parking space. Worry-free investment - don't wait; bring in your offers.
-
2026-05-08historical Under Contract - Continue to Show 541-char remark
Show marketing remark (541 chars)
Fabulous Investment Opportunity. Own this well-maintained fully-rented 3-Family home. The home has 2- 3 Bedroom units with current market rents between $2200-$2400 and 1 - 2 Bedroom unit with current market rents around $1800-$2000. The home also has a 2-car detached garage which generates additional income. Excellent tenants in place and they enjoy the peace and quiet of the neighborhood. Each unit has its own washer/dryer, beautiful hardwood floors and plenty of parking space. Worry-free investment - don't wait; bring in your offers.
-
2026-04-16status Active 541-char remark
Show marketing remark (541 chars)
Fabulous Investment Opportunity. Own this well-maintained fully-rented 3-Family home. The home has 2- 3 Bedroom units with current market rents between $2200-$2400 and 1 - 2 Bedroom unit with current market rents around $1800-$2000. The home also has a 2-car detached garage which generates additional income. Excellent tenants in place and they enjoy the peace and quiet of the neighborhood. Each unit has its own washer/dryer, beautiful hardwood floors and plenty of parking space. Worry-free investment - don't wait; bring in your offers.
-
2026-04-14historical Under Contract - Continue to Show 541-char remark
Show marketing remark (541 chars)
Fabulous Investment Opportunity. Own this well-maintained fully-rented 3-Family home. The home has 2- 3 Bedroom units with current market rents between $2200-$2400 and 1 - 2 Bedroom unit with current market rents around $1800-$2000. The home also has a 2-car detached garage which generates additional income. Excellent tenants in place and they enjoy the peace and quiet of the neighborhood. Each unit has its own washer/dryer, beautiful hardwood floors and plenty of parking space. Worry-free investment - don't wait; bring in your offers.
-
2026-04-14status Active 541-char remark
Show marketing remark (541 chars)
Fabulous Investment Opportunity. Own this well-maintained fully-rented 3-Family home. The home has 2- 3 Bedroom units with current market rents between $2200-$2400 and 1 - 2 Bedroom unit with current market rents around $1800-$2000. The home also has a 2-car detached garage which generates additional income. Excellent tenants in place and they enjoy the peace and quiet of the neighborhood. Each unit has its own washer/dryer, beautiful hardwood floors and plenty of parking space. Worry-free investment - don't wait; bring in your offers.
-
2026-03-24historical Under Contract - Continue to Show 541-char remark
Show marketing remark (541 chars)
Fabulous Investment Opportunity. Own this well-maintained fully-rented 3-Family home. The home has 2- 3 Bedroom units with current market rents between $2200-$2400 and 1 - 2 Bedroom unit with current market rents around $1800-$2000. The home also has a 2-car detached garage which generates additional income. Excellent tenants in place and they enjoy the peace and quiet of the neighborhood. Each unit has its own washer/dryer, beautiful hardwood floors and plenty of parking space. Worry-free investment - don't wait; bring in your offers.
-
2026-03-02$659,000 Active 541-char remark
Show marketing remark (541 chars)
Fabulous Investment Opportunity. Own this well-maintained fully-rented 3-Family home. The home has 2- 3 Bedroom units with current market rents between $2200-$2400 and 1 - 2 Bedroom unit with current market rents around $1800-$2000. The home also has a 2-car detached garage which generates additional income. Excellent tenants in place and they enjoy the peace and quiet of the neighborhood. Each unit has its own washer/dryer, beautiful hardwood floors and plenty of parking space. Worry-free investment - don't wait; bring in your offers.
-
2026-01-28historical
-
2026-01-03historical Under Contract - Continue to Show
-
2025-12-01status Under Contract
-
2025-12-01historical Under Contract - Continue to Show
-
2025-11-12status Under Contract
-
2025-09-29historical Under Contract - Continue to Show
-
2025-09-19status Active
-
2025-09-18historical Under Contract - Continue to Show
-
2025-09-03$649,500 Active
-
2025-08-24historical
-
2025-01-14soldstatus $594,500 Closed
-
2024-10-21status Under Contract
-
2024-10-14$599,000 Active
-
2013-06-12soldstatus $120,000
-
2009-08-21soldstatus $220,000
-
2009-07-21soldstatus $220,000
-
2009-04-26$249,900
ⓘ Source: listings_history table (triggers on properties + properties_extension) + one-shot
backfill from property_details.listing_events for pre-trigger history.
Tax reassessment forecast CT · Partial reset (capped growth)
- Current annual tax
- $9,914 · $826/mo
- Projected year-2 tax
- $12,008 · $1,001/mo
- Expected delta
- +$2,094/yr (+$175/mo · 21.1%)
ⓘ Screening estimate from a state-policy table — verify with the county assessor before closing.
Climate risk First Street
- Flood 1/10 Low FEMA zone X (unshaded) · 0% chance over 30 yrs
- Wildfire 1/10 Low
- Heat 7/10 Severe 7 d/yr ≥99°F today · 17 d/yr by 30 yrs out
- Wind 6/10 Major 55% chance of damaging wind over 30 yrs
- Air quality 5/10 Major 5 unhealthy d/yr today · 8 by 30 yrs out
Nearby sold comps map
Loading sold comps map…
Walkable amenities ~0.75 mi
Loading nearby amenities…
Taxation est. · year 1
- Rental income
- $79,116
- − Mortgage interest
- −$36,914
- − Property taxes
- −$9,914
- − Insurance
- −$3,295
- − Repairs & maintenance
- −$6,329
- − Management
- −$6,329
- − Depreciation
- −$19,171
- Taxable loss
- −$2,837
- Est. tax savings @ 24.0%
- +$681
- After-tax cash flow
- $8,503/yr
For passive investors: Depreciation is non-cash, so a rental often shows a tax loss while cash-flowing — sheltering income. Rental losses are passive: they offset passive income freely, and up to $25,000/yr can offset ordinary (W-2) income if you actively participate and your MAGI is under $100k (phasing out to $0 by $150k); unused losses carry forward. On sale, claimed depreciation is recaptured at up to 25%, and gains may owe capital-gains tax (a 1031 exchange can defer both). Figures are a year-1 estimate at your 24.0% rate — not tax advice; consult a CPA.
Schools (NCES district)
- District
- West Haven School District
- NCES district ID
- 0904950
- Math proficiency
- 26% ▼ -13.00%
- Reading proficiency
- 38% ▼ -11.00%
- Median HH income
- $52,405
- Composite
- 28.05/100
- National rank
- #6840
- State rank
- #121 of 153 in CT
Livability — West Haven
- Score
- 83/100
- State rank
- #6
- US rank
- #915
Category grades
Schools grade is shown separately in the Schools card above.
Census & demographics
- Census place
- West Haven, CT
- County
- New Haven County · 688,236 people
- City population
- 55,351
- Metro
- New Haven-Milford, CT
- Population (ZIP)
- 55,351
- Household income
- $74,382
- Rent vs Own
- Severe rent burden
- 2671.0
Population outlook (South Central Connecticut County) Hauer SSP2
- By 2040
- 608,362
Race, ethnicity, and origin ACS 2023
- Neighborhood character
- Diverse neighborhood (Simpson 0.68)
- Race & ethnicity
- White 47% Hispanic / Latino 26% Black 18% Two or more races 10% Asian 5%
- Hispanic origin (detail)
- Mexican 3% Puerto Rican 11% Dominican 1%
- Common ancestry
- Romanian 4% Lithuanian 3% Russian 2%
- Foreign-born
- 21% · Canada, Jamaica, China
- Languages at home
- 70% English-only · Spanish 17% Other Indo-European 5% Arabic 3%
Political lean MEDSL · South Central Connecticut
- 2024 margin
- Strong D (+20.1) · D 59.0% · R 38.9% · Other 2.1%
- All cycles
- 2024: D+20.1
Not yet ingested
- Civics
- —
Market trends
- HPI YoY
- ▼ -312.86%
- Current HPI
- 307.0655
- Rent YoY
- ▲ 3.90%
- Metro
- New Haven-Milford, CT
- State GDP YoY
- ▲ 1.06%
- F500 in state
- 38
Industry mix (Fortune 500 HQ in CT)
| Industry | F500 HQs | Revenue |
|---|---|---|
| Industrial Machinery | 4 | $38B |
|
||
| Insurance | 3 | $71B |
|
||
| Financial Services | 2 | $25B |
|
||
| Transportation / Logistics | 2 | $18B |
|
||
| Healthcare | 1 | $247B |
|
||
| Telecommunications | 1 | $55B |
|
||
Price history
+163.7% since first listed24 events — show timeline
- 2026-05-18 Pending — Smart MLS
- 2026-05-08 Contingent — Smart MLS
- 2026-04-16 Relisted — Smart MLS
- 2026-04-14 Contingent — Smart MLS
- 2026-04-14 Relisted — Smart MLS
- 2026-03-24 Contingent — Smart MLS
- 2026-03-02 Listed $659,000 Smart MLS
- 2026-01-28 Listing Removed — Smart MLS
- 2026-01-03 Contingent — Smart MLS
- 2025-12-01 Pending — Smart MLS
- 2025-12-01 Contingent — Smart MLS
- 2025-11-12 Pending — Smart MLS
- 2025-09-29 Contingent — Smart MLS
- 2025-09-19 Relisted — Smart MLS
- 2025-09-18 Contingent — Smart MLS
- 2025-09-03 Listed $649,500 Smart MLS
- 2025-08-24 Coming Soon — Smart MLS
- 2025-01-14 Sold (MLS) $594,500 Smart MLS
- 2024-10-21 Pending — Smart MLS
- 2024-10-14 Listed $599,000 Smart MLS
- 2013-06-12 Sold (Public Records) $120,000 Public Records
- 2009-08-21 Sold (Public Records) $220,000 Public Records
- 2009-07-21 Sold (MLS) $220,000 Smart MLS
- 2009-04-26 Listed $249,900 Smart MLS
Property tax history
+1.9%/yrLatest (2023): $9,914 · +2.0% YoY. Source: county tax records.
Cash-flow waterfall
monthlySold comps — $/sqft
last 12 mo · ≤1 miLoading sold comps…