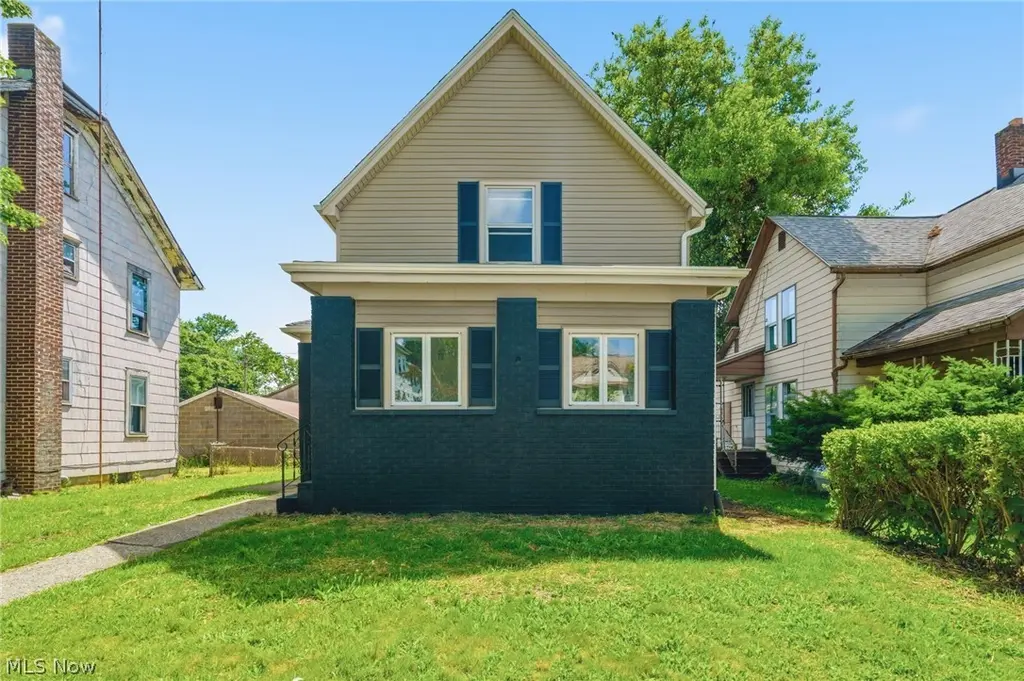
440 S Freedom Ave · Alliance, OH
Flood risk 1/10 · Minimal
- FEMA flood zone
- X (unshaded)
- Chance of flooding over 30 yrs
- 0.0%
- Est. flood insurance / yr
- $473 – $860
Fire risk 1/10 · Minimal
- Est. fire insurance / yr
- $713 – $1,323
Heat risk 3/10 · Minor
- Hot days now (above 97°F)
- 7 days/yr
- Hot days in 30 yrs
- 17 days/yr
Wind risk 1/10 · Minimal
- Chance of severe wind over 30 yrs
- —
Air-quality risk 2/10 · Minimal
- Unhealthy air days now
- 1 days/yr
- Unhealthy air days in 30 yrs
- 2 days/yr
Risk factors via First Street. Map © Google.
Why this score? — see what drove the D grade
The composite is a weighted blend of 9 inputs, each scored 0–100. Each bar is that input's sub-score; the figure is the points it added to the 100-point composite (weight × sub-score).
- Cash flow +14.6/30.0
- ARV discount +7.5/15.0
- DSCR +4.4/10.0
- Livability +3.9/5.0
- Schools +3.5/10.0
- 1% rule +3.2/10.0
- Rent growth +2.5/5.0
- Condition / age +2.5/5.0
- Appreciation +0.0/10.0
$142,500
🖨 Deal sheet 📄 Offer letter ✓ Due diligence
Listing remarks
Completely updated and move-in ready, this charming 3-bedroom, 1-bath home has been renovated from top to bottom! Inside, you'll find fresh paint, new flooring, updated lighting, and lovely finishes throughout. The brand-new kitchen offers new cabinetry and plenty of space to cook and gather, while the beautifully remodeled bathroom features a custom tile shower. Adding to the home's appeal are a first-floor bedroom and first-floor laundry, providing convenient one-floor living options. The major updates have already been taken care of, including a new gas furnace, hot water tank, plumbing, electrical, roof, gutters, and glass block basement windows. The basement provides extra storage and
Key facts
- Hot water tank
- New plumbing
- Remodeled bathroom
Tags
Property features AI
Finance
- Financial info: Annual taxes listed (see agent for details)
Exterior
- Parking: Detached 2-car garage with electricity and garage door opener; Gravel parking
- Utilities: Public water; Public sewer
- Home design: 2-story home; Vinyl siding exterior; Fiberglass roof
- Construction: Built (year per public records); Vinyl siding construction; Fiberglass roof; Full basement foundation
- Exterior features: Lot recorded at 0.1377 acres
Interior
- Bedrooms: 1 bedroom on the main level
- Bathrooms: 1 full bathroom (main level)
- Heating & cooling: Forced air heating (gas)
- Interior features: Full basement
Neighborhood map
What this means for you Summary
Snapshot
- This is a 3-bed/1.0-bath single-family listed at $142k.
Deal economics
- At list price, monthly cash flow is $33 ($395/yr) — positive.
- The deal already cash-flows at list — no discount required.
- To meet the 1% rule (rent ≥ 1% of price), the offer needs to be $117k (17.7% below list).
- Recommended offer: $117k (17.7% below list) — sets the bar for 1% rule.
- Cap rate 6.6% vs local median 4.8% in Alliance — top-decile yield for the area; either an underpriced asset or a hidden risk that comps aren't pricing in. Stress-test before assuming the spread holds.
Location & tenants
- Location reads 78/100 on livability (#175 in OH, #2,737 nationally) — a middle-class / working-renter tenant base. Strengths: commute A+, cost of living A+, housing A+; Watch: amenities F, employment F.
- Alliance City (town): math 39% / reading 45% proficiency, ranked #536 of 656 in OH (top 82%) — families likely to look elsewhere, expect single-tenant / working-renter base with shorter leases; 71% free/reduced lunch — lower-income household profile, screen leases tightly.
- Market conditions: 166 active listings in the ZIP; 4 comparable units currently listed for rent nearby; rentals leasing fast (median 14d on market — plan ~1-2 weeks tenant-placement turnaround); 528 units permitted in Stark County in 2024 (84 in 5+ unit buildings).
Forward outlook
- Local home prices are declining (-3.0%/yr); year-one equity from $985 of loan paydown is wiped out by about $4k of value loss. Plan a longer hold.
- Stark County population projected to shrink 8% by 2050 — rents likely to lag national; underwrite the cash flow, not the appreciation.
Negotiation context
- Only 1 days on market — expect competitive offers; lowballing is unlikely to land.
- Current owner paid $10k; list at $142k implies a 1400% gain — meaningful room to come down on a strong offer.
Risks & watch-outs
- Watch-outs: built in 1872 — expect roof / HVAC / electrical / plumbing capex.
Questions for the listing agent
- Built in 1872 — when were the roof, HVAC, electrical panel, plumbing, and water heater last replaced?
- Is there a deadline driving the sale (1031 exchange, divorce, estate, relocation)? That informs how much negotiation room exists.
- Schools are B-rated — typically a magnet for longer-tenancy family renters. What's the average tenant stay here, and is there a school-zone premium baked into asking?
- The area grade is low — what's the realistic commute time and amenity access for the typical tenant pool here? Any planned neighborhood developments (good or bad) we should know about?
- What's the average days-on-market for RENTAL listings here right now (not sales)? A rising rental-DOM trend means longer vacancies and softer asking-rent achievability than the comps imply.
- What's the recent tenant-quality profile in this submarket — average credit score on applications, eviction rate, late-payment / NSF rate, and stable-employment percentage? A property-management company in the area should have these aggregated.
- How much new for-sale + rental construction is in the pipeline within 1–3 miles? Heavy new supply typically softens prices + rents 12–24 months out; constrained supply supports both.
Investment metrics
- 1% rule
- 0.82% ✗
- Cap rate
- 6.57%
- Cash-on-cash
- 0.99%
- DSCR
- 1.04
- GRM
- 10.1
CMA / ARV
- ARV (on-the-fly)
- $70,584
- Comps found
- 12
Show comp detail 12 sales within ~0.75 mi
| Address | Dist | Beds/Ba | Sqft | Sold | Price | $/sf | Match |
|---|---|---|---|---|---|---|---|
| 726 S Arch Ave | 0.24mi | 3/1.0 | 1,368 (-1%) | 2mo | $40,000 | $29 | 85 |
| 228 W Oxford St | 0.64mi | 3/1.0 | 1,380 (-0%) | 2mo | $70,000 | $51 | 68 |
| 234 Rosenberry St | 0.38mi | 3/2.0 | 1,458 (+5%) | 2mo | $70,000 | $48 | 68 |
| 167 11th St | 0.52mi | 3/2.0 | 1,426 (+3%) | 1mo | $150,000 | $105 | 66 |
| 231 Rosenberry St | 0.40mi | 4/1.0 (+1) | 1,479 (+7%) | 2mo | $70,000 | $47 | 63 |
| 621 S Haines Ave | 0.63mi | 3/1.0 | 1,456 (+5%) | 2mo | $70,000 | $48 | 60 |
| 1350 S Freedom Ave | 0.62mi | 3/2.0 | 1,463 (+6%) | 2mo | $45,000 | $31 | 56 |
| 170 W Cambridge St | 0.57mi | 3/2.0 | 1,280 (-8%) | 2mo | $145,000 | $113 | 55 |
| 1015 Reed | 0.68mi | 3/1.5 | 1,248 (-10%) | 1mo | $137,000 | $110 | 49 |
| 163 W Market St | 0.62mi | 3/1.0 | 1,187 (-14%) | 2mo | $110,000 | $93 | 46 |
| 22862 Norman Ave | 0.71mi | 4/1.5 (+1) | 1,502 (+8%) | 0mo | $85,000 | $57 | 46 |
| 134 11th St | 0.52mi | 4/2.0 (+1) | 1,554 (+12%) | 2mo | $70,000 | $45 | 45 |
Match score weights: distance 35% · size 25% · config 20% · recency 20%. Top-matched comps best support the ARV.
Projected returns pro-forma
-3.0% appreciation · 3.0% rent growth · sell at horizon
- IRR
- -14.8%
- Equity multiple
- 0.47×
- Total profit
- $-21,031
- Equity at exit
- $21,247
- IRR
- -6.1%
- Equity multiple
- 0.60×
- Total profit
- $-15,766
- Equity at exit
- $12,321
Cash invested: $39,900 (down + closing). Projections, not guarantees.
Landlord ↔ Tenant lean methodology
- Overall (STATE)
- 73 Landlord-Friendly
- State Ohio
- 73 Landlord-Friendly · R+6
- County
- — inherits STATE
- City
- — inherits STATE
ZIP-level market 44601
- Active inventory
- 166
- Price-to-rent
- 10.1×
Monthly cashflow live
- Estimated rent
- $1,173 medium interval (Pro) →
- Mortgage (P&I)
- −$747
- Tax from tax record
- −$87 /mo · $1,048/yr
- Insurance
- −$59
- HOA
- −$0
- Vacancy / Maint / Mgmt
- −$246
- Net cashflow
- $33
Break-even live
UW: 25.0% down · 7.5% · 30yr · 1.5% tax · 5.0% vac · 8.0% maint · 8.0% mgmt
Financing live
Cash to close
- Down payment
- $35,625
- Closing costs
- $4,275
- Reserves months
- —
- Total cash needed
- —
Loan-product check · same deal, 3 products live
Conventional
25% down · 7.5% · 30yr
- Down + closing
- —
- Monthly P&I
- —
- Monthly cashflow
- —
- DSCR
- —
- Eligible?
- —
Personal DTI + credit; lowest rate.
DSCR
20% down · 8.5% · 30yr
- Down + closing
- —
- Monthly P&I
- —
- Monthly cashflow
- —
- DSCR
- —
- Eligible?
- —
No personal income docs; deal must DSCR.
Hard money
10% down · 12.0% · 12mo
- Down + closing
- —
- Monthly P&I
- —
- Monthly cashflow
- —
- DSCR
- —
- Eligible?
- —
Short-term bridge; refi at stabilization.
Rent comps 4 comps
| Address | Beds | Baths | Sqft | Rent | $/sqft | DOM | Units | Dist |
|---|---|---|---|---|---|---|---|---|
| 109 W Ely St Alliance, OH | 3.0 | 1.0 | 1344 | $1,300 | $0.97 | 13d | 1 | 0.68mi |
| 1329 Auld St Alliance, OH | 2.0 | 2.0 | 900 | $895 | $0.99 | 13d | 1 | 0.73mi |
| 1329 Auld St Unit 1329 Alliance, OH | 2.0 | 2.0 | 900 | $925 | $1.03 | 13d | 1 | 0.73mi |
| 2406 S Union Ave Alliance, OH | 4.0 | 2.0 | 1394 | $1,600 | $1.15 | 44d | 1 | 1.44mi |
Listing history 2 events
-
2026-06-17remarks 699-char remark
-
2026-06-17$142,500 Active 1 DOM
ⓘ Source: listings_history table (triggers on properties + properties_extension) + one-shot
backfill from property_details.listing_events for pre-trigger history.
Tax reassessment forecast OH · Partial reset (capped growth)
- Current annual tax
- $1,048 · $87/mo
- Projected year-2 tax
- $1,636 · $136/mo
- Expected delta
- +$587/yr (+$49/mo · 56.0%)
ⓘ Screening estimate from a state-policy table — verify with the county assessor before closing.
Climate risk First Street
- Flood 1/10 Low FEMA zone X (unshaded) · 0% chance over 30 yrs
- Wildfire 1/10 Low
- Heat 3/10 Moderate 7 d/yr ≥97°F today · 17 d/yr by 30 yrs out
- Wind 1/10 Low
- Air quality 2/10 Low 1 unhealthy d/yr today · 2 by 30 yrs out
Nearby sold comps map
Loading sold comps map…
Walkable amenities ~0.75 mi
Loading nearby amenities…
Taxation est. · year 1
- Rental income
- $14,080
- − Mortgage interest
- −$7,982
- − Property taxes
- −$1,048
- − Insurance
- −$712
- − Repairs & maintenance
- −$1,126
- − Management
- −$1,126
- − Depreciation
- −$4,145
- Taxable loss
- −$2,061
- Est. tax savings @ 24.0%
- +$495
- After-tax cash flow
- $890/yr
For passive investors: Depreciation is non-cash, so a rental often shows a tax loss while cash-flowing — sheltering income. Rental losses are passive: they offset passive income freely, and up to $25,000/yr can offset ordinary (W-2) income if you actively participate and your MAGI is under $100k (phasing out to $0 by $150k); unused losses carry forward. On sale, claimed depreciation is recaptured at up to 25%, and gains may owe capital-gains tax (a 1031 exchange can defer both). Figures are a year-1 estimate at your 24.0% rate — not tax advice; consult a CPA.
Schools (NCES district)
- District
- Alliance City
- NCES district ID
- 3904349
- Math proficiency
- 39% ▼ -9.00%
- Reading proficiency
- 45% ▼ -5.00%
- Median HH income
- $33,326
- Composite
- 34.54/100
- National rank
- #5176
- State rank
- #536 of 656 in OH
Livability — Alliance
- Score
- 78/100
- State rank
- #175
- US rank
- #2737
Category grades
Schools grade is shown separately in the Schools card above.
Census & demographics
- Census place
- Alliance, OH
- County
- Stark County · 272,865 people
- City population
- 32,696
- Metro
- Canton-Massillon, OH
- Population (ZIP)
- 32,696
- Household income
- $61,965
- Rent vs Own
- Severe rent burden
- 780.0
Population outlook (Stark County) Hauer SSP2
- Today (2025)
- 373,708 people
- By 2030
- 371,245 · -0.7%
- By 2040
- 361,331 · -3.3%
- By 2050
- 345,290 · -7.6%
- By 2075
- 302,669 · -19.0%
- By 2100
- 238,870 · -36.1%
Race, ethnicity, and origin ACS 2023
- Neighborhood character
- Predominantly White (87%)
- Race & ethnicity
- White 87% Black 6% Two or more races 5% Hispanic / Latino 1%
- Common ancestry
- Italian 3% Lithuanian 2% Slovak 2%
- Foreign-born
- 1%
- Languages at home
- 98% English-only · Spanish 1%
Political lean MEDSL · Stark
- 2024 margin
- Strong R (+21.9) · D 38.6% · R 60.5%
- 2008→2024 swing
- -27.4pp toward R · 2008: 5.5pp · 2024: -21.9pp
- All cycles
- 2024: R+21.9 2020: R+18.5 2016: R+17.4 2012: R+0.4 2008: D+5.5
Not yet ingested
- Civics
- —
Market trends
- HPI YoY
- ▼ -174.62%
- Current HPI
- 224.9507
- Rent YoY
- —
- Metro
- Canton-Massillon, OH
- State GDP YoY
- ▲ 1.98%
- F500 in state
- 48
Industry mix (Fortune 500 HQ in OH)
| Industry | F500 HQs | Revenue |
|---|---|---|
| Insurance | 3 | $145B |
|
||
| Industrial Machinery | 3 | $49B |
|
||
| Financial Services | 3 | $24B |
|
||
| Consumer Goods | 2 | $93B |
|
||
| Aerospace / Defense | 2 | $47B |
|
||
| Utilities | 2 | $33B |
|
||
Price history
+1400.0% since first listed2 events — show timeline
- 2026-06-17 Listed $142,500 MLSNOW
- 1992-05-28 Sold (Public Records) $9,500 Public Records
Property tax history
+14.4%/yrLatest (2024): $1,048 · +106.2% YoY. Source: county tax records.
Cash-flow waterfall
monthlySold comps — $/sqft
last 12 mo · ≤1 miLoading sold comps…