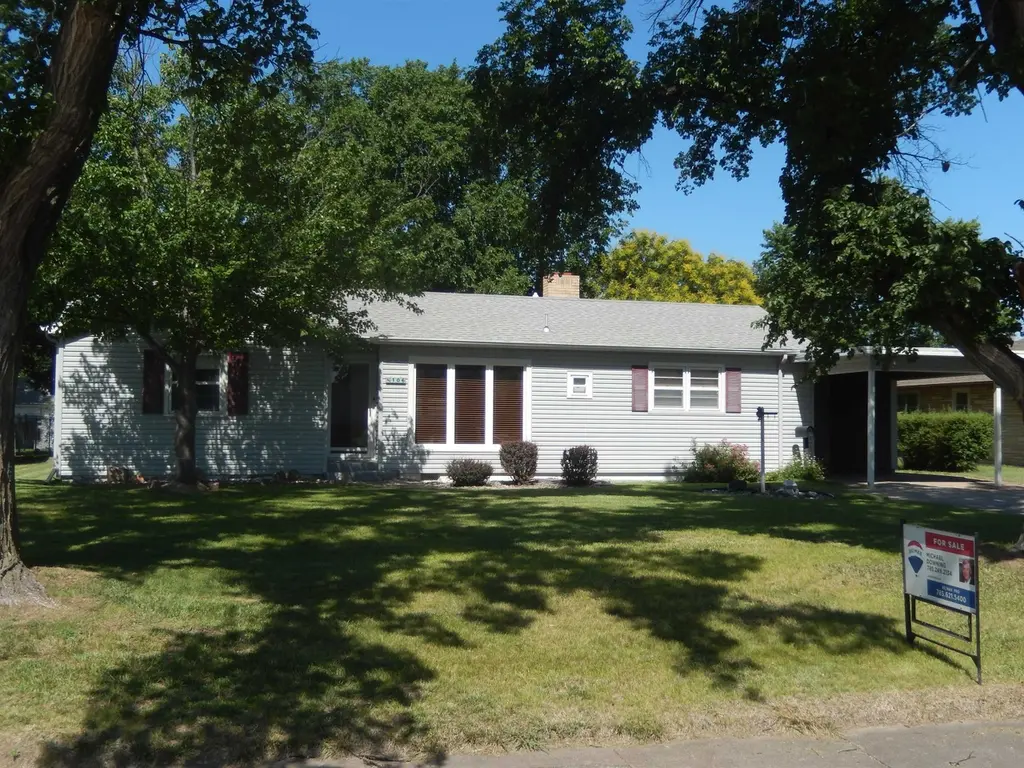
106 S Colorado St · Plainville, KS
Flood risk 1/10 · Minimal
- FEMA flood zone
- —
- Chance of flooding over 30 yrs
- 0.0%
- Est. flood insurance / yr
- —
Fire risk 5/10 · Moderate
- Est. fire insurance / yr
- $1,154 – $2,142
Heat risk 4/10 · Minor
- Hot days now (above 103°F)
- 7 days/yr
- Hot days in 30 yrs
- 17 days/yr
Wind risk 2/10 · Minimal
- Chance of severe wind over 30 yrs
- —
Air-quality risk 2/10 · Minimal
- Unhealthy air days now
- 1 days/yr
- Unhealthy air days in 30 yrs
- 1 days/yr
Risk factors via First Street. Map © Google.
Why this score? — see what drove the C- grade
The composite is a weighted blend of 9 inputs, each scored 0–100. Each bar is that input's sub-score; the figure is the points it added to the 100-point composite (weight × sub-score).
- Cash flow +17.6/30.0
- ARV discount +7.5/15.0
- DSCR +5.5/10.0
- 1% rule +4.7/10.0
- Livability +4.0/5.0
- Appreciation +3.0/10.0
- Schools +2.9/10.0
- Rent growth +2.5/5.0
- Condition / age +2.5/5.0
$109,000
🖨 Deal sheet 📄 Offer letter ✓ Due diligence
Key facts
- Shaded backyard
- Attached carport
- Additional carport
Tags
Property features AI
Finance
- Other: Zoning: NC.3 / R-3; Lot size approximately 0.28 acres
Exterior
- Utilities: Well and private water available; public water available; Public sewer; Cable available; Natural gas available
- Home design: Residential property
- Construction: Composition roof
- Exterior features: Deck
Interior
- Kitchen: Range; Oven; Refrigerator
- Bedrooms: 3 bedrooms on the main level
- Heating & cooling: Central air conditioning
- Interior features: Window coverings; Wood-burning fireplace; Total of 7 rooms
- Laundry & utility: Dryer
Neighborhood map
What this means for you Summary
Snapshot
- This is a 3-bed/2.0-bath single-family listed at $109k.
Deal economics
- At list price, monthly cash flow is $85 ($1k/yr) — positive.
- The deal already cash-flows at list — no discount required.
- To meet the 1% rule (rent ≥ 1% of price), the offer needs to be $106k (2.6% below list).
- Recommended offer: $106k (2.6% below list) — sets the bar for 1% rule.
Location & tenants
- Location reads 79/100 on livability (#21 in KS, #2,088 nationally) — a middle-class / working-renter tenant base. Strengths: cost of living A+, housing A+, health & safety A+; Watch: schools D+, amenities F, commute F.
- Plainville (rural): math 30% / reading 30% proficiency, ranked #166 of 280 in KS (top 59%) — families likely to look elsewhere, expect single-tenant / working-renter base with shorter leases.
- Market conditions: 7 active listings in the ZIP; 3 units permitted in Rooks County in 2024 (0 in 5+ unit buildings).
Forward outlook
- Local home prices are declining (-3.0%/yr); year-one equity from $754 of loan paydown is wiped out by about $3k of value loss. Plan a longer hold.
Negotiation context
- Only 8 days on market — expect competitive offers; lowballing is unlikely to land.
Risks & watch-outs
- Watch-outs: built in 1954 — expect roof / HVAC / electrical / plumbing capex.
- Climate carrying-cost: moderate wildfire risk — expect insurance premiums to compound above CPI over the hold.
Questions for the listing agent
- Built in 1954 — when were the roof, HVAC, electrical panel, plumbing, and water heater last replaced?
- Is there a deadline driving the sale (1031 exchange, divorce, estate, relocation)? That informs how much negotiation room exists.
- Schools are D-rated, which usually means shorter tenancies and higher turnover. Who's the typical renter profile here, and what's been the actual vacancy rate?
- What's the average days-on-market for RENTAL listings here right now (not sales)? A rising rental-DOM trend means longer vacancies and softer asking-rent achievability than the comps imply.
- What's the recent tenant-quality profile in this submarket — average credit score on applications, eviction rate, late-payment / NSF rate, and stable-employment percentage? A property-management company in the area should have these aggregated.
- How much new for-sale + rental construction is in the pipeline within 1–3 miles? Heavy new supply typically softens prices + rents 12–24 months out; constrained supply supports both.
Investment metrics
- 1% rule
- 0.97% ✗
- Cap rate
- 7.23%
- Cash-on-cash
- 3.36%
- DSCR
- 1.15
- GRM
- 8.6
CMA / ARV
No comps found within radius.
Projected returns pro-forma
-3.0% appreciation · 3.0% rent growth · sell at horizon
- IRR
- -11.0%
- Equity multiple
- 0.60×
- Total profit
- $-12,208
- Equity at exit
- $16,252
- IRR
- -1.7%
- Equity multiple
- 0.88×
- Total profit
- $-3,563
- Equity at exit
- $9,424
Cash invested: $30,520 (down + closing). Projections, not guarantees.
Landlord ↔ Tenant lean methodology
- Overall (STATE)
- 83 Strongly Landlord-Friendly
- State Kansas
- 83 Strongly Landlord-Friendly · R+10
- County
- — inherits STATE
- City
- — inherits STATE
ZIP-level market 67663
- Home prices YoY
- -2.4%
- Active inventory
- 7
- Price-to-rent
- 8.6×
Monthly cashflow live
- Estimated rent
- $1,062 medium interval (Pro) →
- Mortgage (P&I)
- −$572
- Tax est. 1.5%
- −$136 /mo · $1,635/yr
- Insurance
- −$45
- HOA
- −$0
- Vacancy / Maint / Mgmt
- −$223
- Net cashflow
- $85
Break-even live
UW: 25.0% down · 7.5% · 30yr · 1.5% tax · 5.0% vac · 8.0% maint · 8.0% mgmt
Financing live
Cash to close
- Down payment
- $27,250
- Closing costs
- $3,270
- Reserves months
- —
- Total cash needed
- —
Loan-product check · same deal, 3 products live
Conventional
25% down · 7.5% · 30yr
- Down + closing
- —
- Monthly P&I
- —
- Monthly cashflow
- —
- DSCR
- —
- Eligible?
- —
Personal DTI + credit; lowest rate.
DSCR
20% down · 8.5% · 30yr
- Down + closing
- —
- Monthly P&I
- —
- Monthly cashflow
- —
- DSCR
- —
- Eligible?
- —
No personal income docs; deal must DSCR.
Hard money
10% down · 12.0% · 12mo
- Down + closing
- —
- Monthly P&I
- —
- Monthly cashflow
- —
- DSCR
- —
- Eligible?
- —
Short-term bridge; refi at stabilization.
Listing history 7 events
-
2026-06-19days on market $109,000 Active 8 DOM
-
2026-06-18days on market $109,000 Active 7 DOM
-
2026-06-17days on market $109,000 Active 6 DOM
-
2026-06-16days on market $109,000 Active 5 DOM
-
2026-06-15days on market $109,000 Active 4 DOM
-
2026-06-14days on market $109,000 Active 2 DOM
-
2026-06-12$109,000 Active 1 DOM
ⓘ Source: listings_history table (triggers on properties + properties_extension) + one-shot
backfill from property_details.listing_events for pre-trigger history.
Climate risk First Street
- Flood 1/10 Low 0% chance over 30 yrs
- Wildfire 5/10 Major
- Heat 4/10 Moderate 7 d/yr ≥103°F today · 17 d/yr by 30 yrs out
- Wind 2/10 Low
- Air quality 2/10 Low 1 unhealthy d/yr today · 1 by 30 yrs out
Nearby sold comps map
Loading sold comps map…
Walkable amenities ~0.75 mi
Loading nearby amenities…
Taxation est. · year 1
- Rental income
- $12,739
- − Mortgage interest
- −$6,106
- − Property taxes
- −$1,635
- − Insurance
- −$545
- − Repairs & maintenance
- −$1,019
- − Management
- −$1,019
- − Depreciation
- −$3,171
- Taxable loss
- −$756
- Est. tax savings @ 24.0%
- +$181
- After-tax cash flow
- $1,206/yr
For passive investors: Depreciation is non-cash, so a rental often shows a tax loss while cash-flowing — sheltering income. Rental losses are passive: they offset passive income freely, and up to $25,000/yr can offset ordinary (W-2) income if you actively participate and your MAGI is under $100k (phasing out to $0 by $150k); unused losses carry forward. On sale, claimed depreciation is recaptured at up to 25%, and gains may owe capital-gains tax (a 1031 exchange can defer both). Figures are a year-1 estimate at your 24.0% rate — not tax advice; consult a CPA.
Schools (NCES district)
- District
- Plainville
- NCES district ID
- 2010740
- Math proficiency
- 30% ▲ 5.00%
- Reading proficiency
- 30% ▼ -5.00%
- Median HH income
- $46,331
- Composite
- 28.69/100
- National rank
- #12011
- State rank
- #166 of 280 in KS
Livability — Plainville
- Score
- 79/100
- State rank
- #21
- US rank
- #2088
Category grades
Schools grade is shown separately in the Schools card above.
Census & demographics
- Census place
- Plainville, KS
- Population (ZIP)
- 2,449
Population outlook (Rooks County) Hauer SSP2
- Today (2025)
- 5,196 people
- By 2030
- 5,218 · +0.4%
- By 2040
- 5,216 · +0.4%
- By 2050
- 5,171 · -0.5%
- By 2075
- 5,171 · -0.5%
- By 2100
- 4,713 · -9.3%
Race, ethnicity, and origin ACS 2023
- Neighborhood character
- Predominantly White (92%)
- Race & ethnicity
- White 92% Black 4% Hispanic / Latino 3% Two or more races 3%
- Common ancestry
- Lithuanian 5% Portuguese 2% Hungarian 1%
- Foreign-born
- 0% · China
- Languages at home
- 99% English-only · Spanish 1%
Political lean MEDSL · Rooks
- 2024 margin
- Solid R (+71.2) · D 13.8% · R 85.0% · Other 1.3%
- 2008→2024 swing
- -9.4pp toward R · 2008: -61.8pp · 2024: -71.2pp
- All cycles
- 2024: R+71.2 2020: R+73.7 2016: R+72.6 2012: R+67.1 2008: R+61.8
Not yet ingested
- Civics
- —
Market trends
- HPI YoY
- ▼ -3.93%
- Current HPI
- 157.17
- Rent YoY
- —
- Metro
- —
- State GDP YoY
- —
- F500 in state
- 0
Price history
1 event — show timeline
- 2026-06-11 Listed $109,000 Hays MLS
Cash-flow waterfall
monthlySold comps — $/sqft
last 12 mo · ≤1 miLoading sold comps…