425 20th Century Blvd Unit E1 · Turlock, CA
Flood risk 4/10 · Minor
- FEMA flood zone
- X (unshaded)
- Chance of flooding over 30 yrs
- 0.22%
- Est. flood insurance / yr
- $507 – $1,088
Fire risk 1/10 · Minimal
- Est. fire insurance / yr
- $659 – $1,223
Heat risk 7/10 · Major
- Hot days now (above 102°F)
- 7 days/yr
- Hot days in 30 yrs
- 15 days/yr
Wind risk 1/10 · Minimal
- Chance of severe wind over 30 yrs
- —
Air-quality risk 10/10 · Severe
- Unhealthy air days now
- 33 days/yr
- Unhealthy air days in 30 yrs
- 35 days/yr
Risk factors via First Street. Map © Google.
Why this score? — see what drove the C+ grade
The composite is a weighted blend of 9 inputs, each scored 0–100. Each bar is that input's sub-score; the figure is the points it added to the 100-point composite (weight × sub-score).
- Cash flow +30.0/30.0
- 1% rule +10.0/10.0
- DSCR +10.0/10.0
- Livability +3.3/5.0
- Rent growth +2.8/5.0
- Schools +2.7/10.0
- Condition / age +2.5/5.0
- ARV discount +0.0/15.0
- Appreciation +0.0/10.0
$95,000
🖨 Deal sheet 📄 Offer letter ✓ Due diligence
Listing remarks MLS
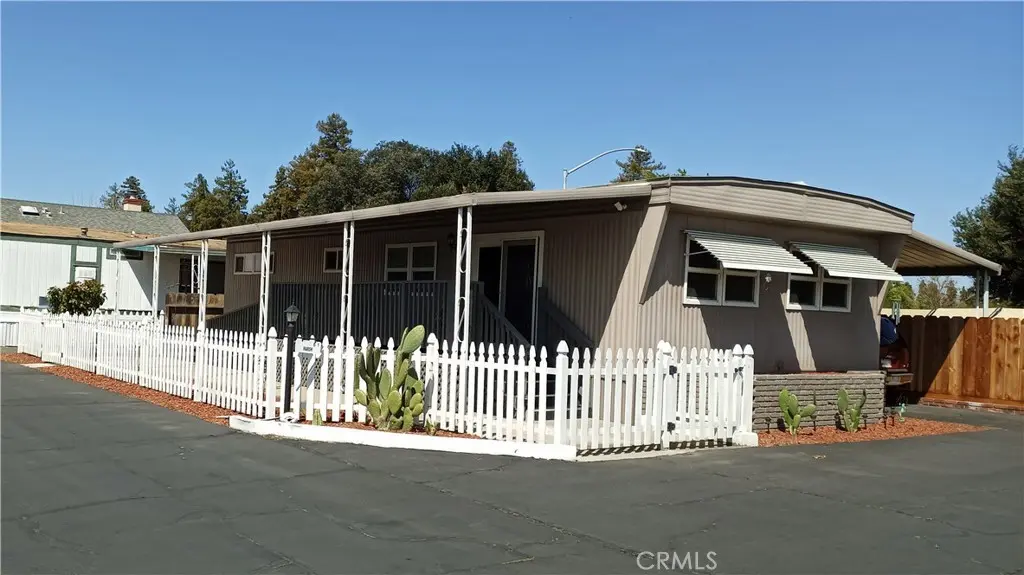
Welcome to this charming mobile home located in the desirable Sun Garden Mobile Home Park in Turlock. From the moment you arrive, you’ll appreciate the inviting curb appeal highlighted by a white picket fence and a cozy covered porch, perfect for enjoying quiet mornings or relaxing afternoons. The home offers convenient side entry access, carport parking, and a thoughtfully designed outdoor space with covered patio areas and privacy fencing—ideal for gardening, hobbies, or simply unwinding. Recent improvements include added foundation supports and professional re-leveling, providing added peace of mind. A storage shed with electrical adds extra functionality. Situated in a well-maintained 55+ senior community, this home offers comfort, privacy, and a welcoming place to call home. Buyer to verify park approval, space rent, and all information. Home sold as-is.
Key facts
- Covered patio areas
- White picket fence
- Carport parking
Tags
Neighborhood map
What this means for you Summary
Snapshot
- This is a 2-bed/2.0-bath manufactured listed at $95k.
Deal economics
- At list price, monthly cash flow is $768 ($9k/yr) — positive.
- The deal already cash-flows at list — no discount required.
- Meets the 1% rule at list price ($2k rent vs $95k).
- Recommended offer: $84k (12.0% below list) — sets the bar for market timing.
- Cap rate 16.0% vs local median 3.1% in Turlock — top-decile yield for the area; either an underpriced asset or a hidden risk that comps aren't pricing in. Stress-test before assuming the spread holds.
Location & tenants
- Location reads 66/100 on livability (#353 in CA) — a middle-class / working-renter tenant base. Strengths: housing A, health & safety A-, commute B; Watch: amenities D, schools F, crime D-.
- Turlock Unified (suburban): math 23% / reading 38% proficiency, ranked #334 of 517 in CA (top 65%) — families likely to look elsewhere, expect single-tenant / working-renter base with shorter leases.
- Market conditions: Rents rising (+1.3%/yr); 130 active listings in the ZIP; 22 comparable units currently listed for rent nearby; rentals leasing fast (median 14d on market — plan ~1-2 weeks tenant-placement turnaround); 923 units permitted in Stanislaus County in 2024 (63 in 5+ unit buildings).
Forward outlook
- Local home prices are declining (-3.0%/yr); year-one equity from $657 of loan paydown is wiped out by about $3k of value loss. Plan a longer hold.
- Stanislaus County population projected at +14% by 2050 — modest demand growth; plan on rents tracking national, not racing it.
- At projected returns (-3.0% appreciation + 1.3% rent growth), your $27k cash investment doubles in ~4 years — after that, you're playing with house money.
Negotiation context
- It's been on market 132 days — a 12% lower offer ($84k) is reasonable based on typical stale-listing flexibility.
Risks & watch-outs
- Climate carrying-cost: extreme-heat days projected 7→15/yr by 2055 (HVAC capex compounding) — expect insurance premiums to compound above CPI over the hold.
Questions for the listing agent
- It's been on market 132 days. Have you received any prior offers? Is the seller open to a 12% concession, seller financing, or rate buy-down credit?
- Built in 1965 — when were the roof, HVAC, electrical panel, plumbing, and water heater last replaced?
- Why hasn't it sold? Are there any deal-killer items the seller is aware of (foundation, flood, title, zoning, code violations)?
- Is there a deadline driving the sale (1031 exchange, divorce, estate, relocation)? That informs how much negotiation room exists.
- Schools are F-rated, which usually means shorter tenancies and higher turnover. Who's the typical renter profile here, and what's been the actual vacancy rate?
- Crime grade is D in this area — have there been break-ins, vandalism, or insurance claims at this property in the last 3 years? What carrier currently insures it and at what premium?
- What's the average days-on-market for RENTAL listings here right now (not sales)? A rising rental-DOM trend means longer vacancies and softer asking-rent achievability than the comps imply.
- What's the recent tenant-quality profile in this submarket — average credit score on applications, eviction rate, late-payment / NSF rate, and stable-employment percentage? A property-management company in the area should have these aggregated.
- How much new for-sale + rental construction is in the pipeline within 1–3 miles? Heavy new supply typically softens prices + rents 12–24 months out; constrained supply supports both.
Investment metrics
- 1% rule
- 1.90% ✓
- Cap rate
- 15.99%
- Cash-on-cash
- 34.64%
- DSCR
- 2.54
- GRM
- 4.4
CMA / ARV
- ARV (median comp)
- $75,865
- List price
- $95,000
- Delta
- 25.22%
- Verdict
- OVERPRICED
- Comps
- 13 within 1.0 mi
Show comp detail 2 sales within ~0.75 mi
| Address | Dist | Beds/Ba | Sqft | Sold | Price | $/sf | Match |
|---|---|---|---|---|---|---|---|
| 425 20th Century Blvd Unit E1 | 0.00mi | 2/2.0 | 1,000 (0%) | 1mo | $90,000 | $90 | 99 |
| 425 20th Century Blvd Unit E5 | 0.01mi | 2/2.0 | 1,000 (0%) | 12mo | $85,000 | $85 | 90 |
Match score weights: distance 35% · size 25% · config 20% · recency 20%. Top-matched comps best support the ARV.
Projected returns pro-forma
-3.0% appreciation · 1.27% rent growth · sell at horizon
- IRR
- 28.1%
- Equity multiple
- 2.14×
- Total profit
- $30,451
- Equity at exit
- $14,165
- IRR
- 34.6%
- Equity multiple
- 3.91×
- Total profit
- $77,369
- Equity at exit
- $8,214
Cash invested: $26,600 (down + closing). Projections, not guarantees.
Landlord ↔ Tenant lean methodology
- Overall (STATE)
- 18 Strongly Tenant-Friendly
- State California
- 18 Strongly Tenant-Friendly · D+13
- County
- — inherits STATE
- City
- — inherits STATE
ZIP-level market 95380
- Rents YoY
- 1.3%
- Active inventory
- 130
- Price-to-rent
- 4.4×
Monthly cashflow live
- Estimated rent
- $1,803 high interval (Pro) →
- Mortgage (P&I)
- −$498
- Tax est. 1.5%
- −$119 /mo · $1,425/yr
- Insurance
- −$40
- HOA
- −$0
- Vacancy / Maint / Mgmt
- −$379
- Net cashflow
- $768
Break-even live
UW: 25.0% down · 7.5% · 30yr · 1.5% tax · 5.0% vac · 8.0% maint · 8.0% mgmt
Financing live
Cash to close
- Down payment
- $23,750
- Closing costs
- $2,850
- Reserves months
- —
- Total cash needed
- —
Loan-product check · same deal, 3 products live
Conventional
25% down · 7.5% · 30yr
- Down + closing
- —
- Monthly P&I
- —
- Monthly cashflow
- —
- DSCR
- —
- Eligible?
- —
Personal DTI + credit; lowest rate.
DSCR
20% down · 8.5% · 30yr
- Down + closing
- —
- Monthly P&I
- —
- Monthly cashflow
- —
- DSCR
- —
- Eligible?
- —
No personal income docs; deal must DSCR.
Hard money
10% down · 12.0% · 12mo
- Down + closing
- —
- Monthly P&I
- —
- Monthly cashflow
- —
- DSCR
- —
- Eligible?
- —
Short-term bridge; refi at stabilization.
Rent comps 22 comps
| Address | Beds | Baths | Sqft | Rent | $/sqft | DOM | Units | Dist |
|---|---|---|---|---|---|---|---|---|
| 90 Pedras Rd Turlock, CA | 2.0 | 1.0 | 870 | $1,650 | $1.90 | 13d | 1 | 0.31mi |
| 1031 Kenwood Ave Turlock, CA | 2.0 | 1.0 | 800 | $1,600 | $2.00 | 13d | 1 | 0.76mi |
| 475 Georgetown Ave Turlock, CA | 3.0 | 2.0 | 1204 | $2,350 | $1.95 | 21d | 1 | 0.79mi |
| 1700 N Tully Rd Turlock, CA | 1.0–3.0 | 1.0–2.0 | 892 | $1,795 | $2.01 | 13d | 1 | 0.80mi |
| 1101 Park St Turlock, CA | 2.0 | 1.0 | 800 | $1,650 | $2.06 | 13d | 1 | 0.82mi |
| 1240 N Olive Ave Unit B Turlock, CA | 2.0 | 1.5 | 750 | $1,650 | $2.20 | 13d | 1 | 0.82mi |
| 1317 Colorado Ave Turlock, CA | 1.0 | 1.0 | 750 | $1,445 | $1.93 | 13d | 1 | 1.01mi |
| 1808 Colorado Ave Turlock, CA | 2.0 | 1.5 | 1340 | $1,795 | $1.34 | 13d | 1 | 1.07mi |
| 3108 James Ln Unit 3118 Turlock, CA | 2.0 | 1.5 | 1140 | $1,800 | $1.58 | 13d | 1 | 1.09mi |
| 351 E Monte Vista Ave Turlock, CA | 2.0 | 1.0–2.0 | 684 | $1,955 | $2.86 | 13d | 11 | 1.18mi |
| 402 S Laurel St Turlock, CA | 2.0 | 1.0 | 1150 | $2,200 | $1.91 | 13d | 1 | 1.25mi |
| 1412 Cahill St Unit CA1412-Melo, Ernest Turlock, CA | 2.0 | 1.0 | 829 | $1,425 | $1.72 | 13d | 1 | 1.27mi |
| 1193 East Ave Turlock, CA | 3.0 | 1.0 | 1206 | $2,150 | $1.78 | 13d | 1 | 1.29mi |
| 731 Vermont Ave Turlock, CA | 3.0 | 1.0 | 1238 | $1,750 | $1.41 | 13d | 1 | 1.30mi |
| 2541 Carnival Dr Turlock, CA | 3.0 | 2.0 | 1309 | $2,295 | $1.75 | 43d | 1 | 1.31mi |
| 920 Vermont Ave Turlock, CA | 2.0 | 1.0 | 756 | $1,550 | $2.05 | 13d | 1 | 1.31mi |
| 3600 Nicole Ct Unit 3600 Turlock, CA | 3.0 | 2.5 | 1358 | $1,950 | $1.44 | 13d | 1 | 1.33mi |
| 1055 Vermont Ave Turlock, CA | 3.0 | 2.0 | 1283 | $2,000 | $1.56 | 43d | 1 | 1.35mi |
| 3492 Gerald Ct Turlock, CA | 3.0 | 2.0 | 1166 | $2,250 | $1.93 | 13d | 1 | 1.37mi |
| 3623 La Mancha Pl Turlock, CA | 2.0 | 2.5 | 1210 | $1,700 | $1.40 | 13d | 1 | 1.38mi |
| 3637 Nicole Ct Unit 3637 Turlock, CA | 3.0 | 2.5 | 1358 | $1,950 | $1.44 | 23d | 1 | 1.39mi |
| 295 South Ave Turlock, CA | 2.0 | 1.0 | 751 | $1,595 | $2.12 | 13d | 1 | 1.45mi |
Listing history 1 events
-
2026-01-14$95,000 Active 884-char remark
Show marketing remark (884 chars)
Welcome to this charming mobile home located in the desirable Sun Garden Mobile Home Park in Turlock. From the moment you arrive, you’ll appreciate the inviting curb appeal highlighted by a white picket fence and a cozy covered porch, perfect for enjoying quiet mornings or relaxing afternoons. The home offers convenient side entry access, carport parking, and a thoughtfully designed outdoor space with covered patio areas and privacy fencing—ideal for gardening, hobbies, or simply unwinding. Recent improvements include added foundation supports and professional re-leveling, providing added peace of mind. A storage shed with electrical adds extra functionality. Situated in a well-maintained 55+ senior community, this home offers comfort, privacy, and a welcoming place to call home. Buyer to verify park approval, space rent, and all information. Home sold as-is.
ⓘ Source: listings_history table (triggers on properties + properties_extension) + one-shot
backfill from property_details.listing_events for pre-trigger history.
Climate risk First Street
- Flood 4/10 Moderate FEMA zone X (unshaded) · 22% chance over 30 yrs
- Wildfire 1/10 Low
- Heat 7/10 Severe 7 d/yr ≥102°F today · 15 d/yr by 30 yrs out
- Wind 1/10 Low
- Air quality 10/10 Extreme 33 unhealthy d/yr today · 35 by 30 yrs out
Nearby sold comps map
Loading sold comps map…
Walkable amenities ~0.75 mi
Loading nearby amenities…
Taxation est. · year 1
- Rental income
- $21,636
- − Mortgage interest
- −$5,321
- − Property taxes
- −$1,425
- − Insurance
- −$475
- − Repairs & maintenance
- −$1,731
- − Management
- −$1,731
- − Depreciation
- −$2,764
- Taxable income
- $8,189
- Est. tax owed @ 24.0%
- −$1,965
- After-tax cash flow
- $7,249/yr
For passive investors: Depreciation is non-cash, so a rental often shows a tax loss while cash-flowing — sheltering income. Rental losses are passive: they offset passive income freely, and up to $25,000/yr can offset ordinary (W-2) income if you actively participate and your MAGI is under $100k (phasing out to $0 by $150k); unused losses carry forward. On sale, claimed depreciation is recaptured at up to 25%, and gains may owe capital-gains tax (a 1031 exchange can defer both). Figures are a year-1 estimate at your 24.0% rate — not tax advice; consult a CPA.
Schools (NCES district)
- District
- Turlock Unified
- NCES district ID
- 0600158
- Math proficiency
- 23% ▼ -8.00%
- Reading proficiency
- 38% ▼ -7.00%
- Median HH income
- $50,249
- Composite
- 26.58/100
- National rank
- #7184
- State rank
- #334 of 517 in CA
Livability — Turlock
- Score
- 66/100
- State rank
- #353
- US rank
- #11971
Category grades
Schools grade is shown separately in the Schools card above.
Census & demographics
- Census place
- Turlock, CA
- County
- Stanislaus County · 445,786 people
- City population
- 83,043
- Metro
- Modesto, CA
- Population (ZIP)
- 43,960
- Household income
- $74,534
- Rent vs Own
- Severe rent burden
- 1545.0
Population outlook (Stanislaus County) Hauer SSP2
- Today (2025)
- 579,493 people
- By 2030
- 598,000 · +3.2%
- By 2040
- 630,930 · +8.9%
- By 2050
- 658,300 · +13.6%
- By 2075
- 712,363 · +22.9%
- By 2100
- 719,805 · +24.2%
Race, ethnicity, and origin ACS 2023
- Neighborhood character
- Diverse neighborhood (Simpson 0.57)
- Race & ethnicity
- Hispanic / Latino 54% White 36% Two or more races 14% Asian 4% Black 1%
- Hispanic origin (detail)
- Mexican 51%
- Common ancestry
- Russian 8% Italian 1% Portuguese 1%
- Foreign-born
- 22% · Canada
- Languages at home
- 52% English-only · Spanish 39% Other Indo-European 7%
Political lean MEDSL · Stanislaus
- 2024 margin
- R (+11.0) · D 43.2% · R 54.2% · Other 2.6%
- 2008→2024 swing
- -12.7pp toward R · 2008: 1.7pp · 2024: -11.0pp
- All cycles
- 2024: R+11.0 2020: D+0.8 2016: D+0.6 2012: D+0.7 2008: D+1.7
Not yet ingested
- Civics
- —
Market trends
- HPI YoY
- ▼ -614.27%
- Current HPI
- 307.7264
- Rent YoY
- ▲ 1.27%
- Metro
- Modesto, CA
- State GDP YoY
- ▲ 3.21%
- F500 in state
- 116
Industry mix (Fortune 500 HQ in CA)
| Industry | F500 HQs | Revenue |
|---|---|---|
| Technology | 27 | $1,492B |
|
||
| Financial Services | 3 | $174B |
|
||
| Retail | 3 | $44B |
|
||
| Insurance | 3 | $26B |
|
||
| Media / Entertainment | 2 | $115B |
|
||
| Pharmaceuticals / Biotech | 2 | $62B |
|
||
Price history
1 event — show timeline
- 2026-01-14 Listed $95,000 CRMLS
Cash-flow waterfall
monthlySold comps — $/sqft
last 12 mo · ≤1 miLoading sold comps…