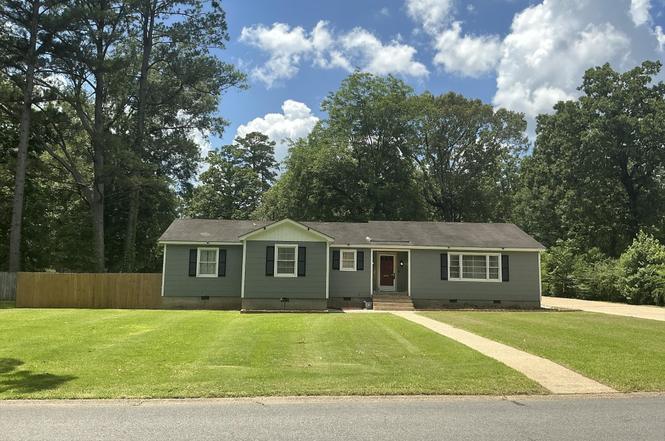
1006 Cedar · Crossett, AR
Flood risk 1/10 · Minimal
- FEMA flood zone
- X (unshaded)
- Chance of flooding over 30 yrs
- 0.0%
- Est. flood insurance / yr
- $507 – $1,088
Fire risk 2/10 · Minimal
- Est. fire insurance / yr
- $1,499 – $2,785
Heat risk 6/10 · Moderate
- Hot days now (above 109°F)
- 7 days/yr
- Hot days in 30 yrs
- 20 days/yr
Wind risk 6/10 · Moderate
- Chance of severe wind over 30 yrs
- 56.0%
Air-quality risk 1/10 · Minimal
- Unhealthy air days now
- 0 days/yr
- Unhealthy air days in 30 yrs
- 0 days/yr
Risk factors via First Street. Map © Google.
Why this score? — see what drove the D+ grade
The composite is a weighted blend of 9 inputs, each scored 0–100. Each bar is that input's sub-score; the figure is the points it added to the 100-point composite (weight × sub-score).
- Cash flow +15.3/30.0
- ARV discount +15.0/15.0
- DSCR +4.7/10.0
- 1% rule +3.7/10.0
- Livability +3.0/5.0
- Rent growth +2.5/5.0
- Condition / age +2.5/5.0
- Schools +1.7/10.0
- Appreciation +0.0/10.0
$135,000
🖨 Deal sheet 📄 Offer letter ✓ Due diligence
Listing remarks MLS
Parcel:# 706-01232-000, Great location for the great investment of a home with 2628 sq ft, .42 Acre lot, concrete driveway, large living/dining room with hardwood floors, large windows, a huge family room with fireplace with built-ins on each side, 4 glass sliding doors leading to concrete patio, large kitchen with opening to the den from kitchen. Kitchen needs work but is an open slate of ideas just waiting for you to bring to life. A hall from entry hall leads to the four bedrooms and two bathrooms. All bedrooms are good size and have good closets. The two bathrooms have showers over bathtubs. Master bath is just off master bedroom which features two large closets. The large laundry room is also a half bath and is located just off hallway coming in from the backdoor coming in from the double carport. There is also a bonus room that could be a man cave or kids game room. This home is just waiting for the right family to make it their own.
Key facts
- Glass sliding doors
- Huge family room
- Concrete patio
Tags
Property features AI
Finance
- Other: Approximately 0.42 acre lot; Square footage recorded from courthouse/tax records
Exterior
- Parking: Carport
- Utilities: Public sewer; Public water; Municipal electric service (Entergy); Natural gas
- Home design: Frame construction; Asbestos exterior material; Composition roof; Slab/crawl combination foundation
- Construction: Frame construction; Asbestos exterior material; Composition roof; Slab/crawl combination foundation
- Exterior features: Level lot; Paved road access; Inside city limits
Interior
- Kitchen: Free-standing stove; Pantry
- Flooring: Carpet; Wood; Vinyl; Tile
- Bathrooms: Two full bathrooms; One half bathroom
- Heating & cooling: Central heat (gas); Central electric cooling
- Interior features: Carpet, wood, vinyl and tile flooring; Wood-burning site-built fireplace; Formal living room, den/family room and game room
- Laundry & utility: Laundry room
Neighborhood map
What this means for you Summary
Snapshot
- This is a 4-bed/2.5-bath single-family listed at $135k.
Deal economics
- At list price, monthly cash flow is $50 ($600/yr) — positive.
- The deal already cash-flows at list — no discount required.
- To meet the 1% rule (rent ≥ 1% of price), the offer needs to be $117k (13.2% below list).
- Recommended offer: $117k (13.2% below list) — sets the bar for 1% rule.
- Cap rate 6.7% vs local median 5.4% in Crossett — meaningfully above typical; check what's discounted (condition, days-on-market, listing class) to confirm the premium yield is real.
Location & tenants
- Location reads 59/100 on livability (#299 in AR) — a working-class tenant base; expect higher turnover. Strengths: cost of living A+, housing A+, health & safety A+; Watch: employment D+, schools D-, crime F.
- Crossett School District (town): math 19% / reading 21% proficiency, ranked #213 of 238 in AR (top 90%) — low school quality limits family demand, transient renter base, plan for 1-2y turnover.
- Market conditions: 56 active listings in the ZIP.
Forward outlook
- Local home prices are declining (-3.0%/yr); year-one equity from $933 of loan paydown is wiped out by about $4k of value loss. Plan a longer hold.
- Ashley County population projected at -30% by 2050 — secular population decline; favor cash flow + early exit over multi-decade hold.
Negotiation context
- Only 10 days on market — expect competitive offers; lowballing is unlikely to land.
- 5 sale attempts since 5y ago with the ask held roughly flat each time — persistent listings suggest the price (not the market) is what's stuck; bring a comps-based counter.
- Current owner paid $84k; list at $135k implies a 61% gain — meaningful room to come down on a strong offer.
Risks & watch-outs
- Watch-outs: built in 1950 — expect roof / HVAC / electrical / plumbing capex.
- Climate carrying-cost: major wind risk, 56% chance of damaging wind over 30y; extreme-heat days projected 7→20/yr by 2055 (HVAC capex compounding) — expect insurance premiums to compound above CPI over the hold.
Questions for the listing agent
- Built in 1950 — when were the roof, HVAC, electrical panel, plumbing, and water heater last replaced?
- Is there a deadline driving the sale (1031 exchange, divorce, estate, relocation)? That informs how much negotiation room exists.
- Schools are D-rated, which usually means shorter tenancies and higher turnover. Who's the typical renter profile here, and what's been the actual vacancy rate?
- Crime grade is F in this area — have there been break-ins, vandalism, or insurance claims at this property in the last 3 years? What carrier currently insures it and at what premium?
- The area grade is low — what's the realistic commute time and amenity access for the typical tenant pool here? Any planned neighborhood developments (good or bad) we should know about?
- What's the average days-on-market for RENTAL listings here right now (not sales)? A rising rental-DOM trend means longer vacancies and softer asking-rent achievability than the comps imply.
- What's the recent tenant-quality profile in this submarket — average credit score on applications, eviction rate, late-payment / NSF rate, and stable-employment percentage? A property-management company in the area should have these aggregated.
- How much new for-sale + rental construction is in the pipeline within 1–3 miles? Heavy new supply typically softens prices + rents 12–24 months out; constrained supply supports both.
Investment metrics
- 1% rule
- 0.87% ✗
- Cap rate
- 6.74%
- Cash-on-cash
- 1.59%
- DSCR
- 1.07
- GRM
- 9.6
CMA / ARV
- ARV (on-the-fly)
- $202,356
- Comps found
- 10
Show comp detail 10 sales within ~0.75 mi
| Address | Dist | Beds/Ba | Sqft | Sold | Price | $/sf | Match |
|---|---|---|---|---|---|---|---|
| 1009 Cedar | 0.05mi | 3/2.0 (-1) | 2,664 (+1%) | 4mo | $155,000 | $58 | 85 |
| 1105 Hickory St | 0.13mi | 4/3.0 | 2,544 (-3%) | 12mo | $205,000 | $81 | 77 |
| 508 Walnut | 0.54mi | 4/2.5 | 2,536 (-4%) | 2mo | $205,000 | $81 | 67 |
| 1415 Chestnut | 0.56mi | 4/2.0 | 2,560 (-3%) | 11mo | $208,900 | $82 | 59 |
| 1405 Cedar St | 0.41mi | 4/3.0 | 2,768 (+5%) | 21mo | $170,000 | $61 | 52 |
| 1102 Hickory | 0.10mi | 3/1.5 (-1) | 2,290 (-13%) | 24mo | $147,000 | $64 | 45 |
| 1500 Pecan St | 0.65mi | 5/2.0 (+1) | 2,535 (-4%) | 15mo | $195,000 | $77 | 44 |
| 806 Pecan | 0.36mi | 3/2.0 (-1) | 2,376 (-10%) | 24mo | $139,000 | $59 | 40 |
| 705 Walnut St | 0.41mi | 3/2.0 (-1) | 2,341 (-11%) | 24mo | $199,000 | $85 | 36 |
| 101 Dogwood Dr | 0.68mi | 3/2.5 (-1) | 2,277 (-13%) | 24mo | $171,000 | $75 | 22 |
Match score weights: distance 35% · size 25% · config 20% · recency 20%. Top-matched comps best support the ARV.
Projected returns pro-forma
-3.0% appreciation · 3.0% rent growth · sell at horizon
- IRR
- -13.8%
- Equity multiple
- 0.51×
- Total profit
- $-18,709
- Equity at exit
- $20,129
- IRR
- -5.0%
- Equity multiple
- 0.68×
- Total profit
- $-12,261
- Equity at exit
- $11,672
Cash invested: $37,800 (down + closing). Projections, not guarantees.
Landlord ↔ Tenant lean methodology
- Overall (STATE)
- 92 Strongly Landlord-Friendly
- State Arkansas
- 92 Strongly Landlord-Friendly · R+14
- County
- — inherits STATE
- City
- — inherits STATE
ZIP-level market 71635
- Home prices YoY
- -30.4%
- Active inventory
- 56
- Price-to-rent
- 9.6×
Monthly cashflow live
- Estimated rent
- $1,172 medium interval (Pro) →
- Mortgage (P&I)
- −$708
- Tax from tax record
- −$111 /mo · $1,338/yr
- Insurance
- −$56
- HOA
- −$0
- Vacancy / Maint / Mgmt
- −$246
- Net cashflow
- $50
Break-even live
UW: 25.0% down · 7.5% · 30yr · 1.5% tax · 5.0% vac · 8.0% maint · 8.0% mgmt
Financing live
Cash to close
- Down payment
- $33,750
- Closing costs
- $4,050
- Reserves months
- —
- Total cash needed
- —
Loan-product check · same deal, 3 products live
Conventional
25% down · 7.5% · 30yr
- Down + closing
- —
- Monthly P&I
- —
- Monthly cashflow
- —
- DSCR
- —
- Eligible?
- —
Personal DTI + credit; lowest rate.
DSCR
20% down · 8.5% · 30yr
- Down + closing
- —
- Monthly P&I
- —
- Monthly cashflow
- —
- DSCR
- —
- Eligible?
- —
No personal income docs; deal must DSCR.
Hard money
10% down · 12.0% · 12mo
- Down + closing
- —
- Monthly P&I
- —
- Monthly cashflow
- —
- DSCR
- —
- Eligible?
- —
Short-term bridge; refi at stabilization.
Listing history 9 events
-
2026-06-19days on market $135,000 Active 10 DOM
-
2026-06-18days on market $135,000 Active 9 DOM
-
2026-06-17days on market $135,000 Active 8 DOM
-
2026-06-16statusdays on market $135,000 Active 7 DOM
-
2026-06-15days on market $135,000 New Listing 6 DOM
-
2026-06-14days on market $135,000 New Listing 4 DOM
-
2026-06-12days on market $135,000 New Listing 3 DOM
-
2026-06-09remarks 699-char remark
-
2026-06-09$135,000 New Listing 1 DOM
ⓘ Source: listings_history table (triggers on properties + properties_extension) + one-shot
backfill from property_details.listing_events for pre-trigger history.
Tax reassessment forecast AR · Resets to sale price
- Current annual tax
- $1,338 · $111/mo
- Projected year-2 tax
- $1,338 · $111/mo
- Expected delta
- $0/yr ($0/mo · 0.0%)
ⓘ Screening estimate from a state-policy table — verify with the county assessor before closing.
Climate risk First Street
- Flood 1/10 Low FEMA zone X (unshaded) · 0% chance over 30 yrs
- Wildfire 2/10 Low
- Heat 6/10 Major 7 d/yr ≥109°F today · 20 d/yr by 30 yrs out
- Wind 6/10 Major 56% chance of damaging wind over 30 yrs
- Air quality 1/10 Low 0 unhealthy d/yr today · 0 by 30 yrs out
Nearby sold comps map
Loading sold comps map…
Walkable amenities ~0.75 mi
Loading nearby amenities…
Taxation est. · year 1
- Rental income
- $14,061
- − Mortgage interest
- −$7,562
- − Property taxes
- −$1,338
- − Insurance
- −$675
- − Repairs & maintenance
- −$1,125
- − Management
- −$1,125
- − Depreciation
- −$3,927
- Taxable loss
- −$1,691
- Est. tax savings @ 24.0%
- +$406
- After-tax cash flow
- $1,006/yr
For passive investors: Depreciation is non-cash, so a rental often shows a tax loss while cash-flowing — sheltering income. Rental losses are passive: they offset passive income freely, and up to $25,000/yr can offset ordinary (W-2) income if you actively participate and your MAGI is under $100k (phasing out to $0 by $150k); unused losses carry forward. On sale, claimed depreciation is recaptured at up to 25%, and gains may owe capital-gains tax (a 1031 exchange can defer both). Figures are a year-1 estimate at your 24.0% rate — not tax advice; consult a CPA.
Schools (NCES district)
- District
- Crossett School District
- NCES district ID
- 0504800
- Math proficiency
- 19% ▼ -16.00%
- Reading proficiency
- 21% ▼ -10.00%
- Median HH income
- $37,682
- Composite
- 16.73/100
- National rank
- #9162
- State rank
- #213 of 238 in AR
Livability — Crossett
- Score
- 59/100
- State rank
- #299
- US rank
- #20393
Category grades
Schools grade is shown separately in the Schools card above.
Census & demographics
- Census place
- Crossett, AR
- Population (ZIP)
- 10,368
Population outlook (Ashley County) Hauer SSP2
- Today (2025)
- 18,757 people
- By 2030
- 17,541 · -6.5%
- By 2040
- 15,243 · -18.7%
- By 2050
- 13,136 · -30.0%
- By 2075
- 8,901 · -52.5%
- By 2100
- 5,626 · -70.0%
Race, ethnicity, and origin ACS 2023
- Neighborhood character
- Predominantly White (67%)
- Race & ethnicity
- White 67% Black 28% Hispanic / Latino 2% Two or more races 2%
- Common ancestry
- Slovak 1% Italian 1% Lithuanian 1%
- Foreign-born
- 0% · Canada
- Languages at home
- 98% English-only · Spanish 1%
Political lean MEDSL · Ashley
- 2024 margin
- Solid R (+48.0) · D 25.2% · R 73.2% · Other 1.6%
- 2008→2024 swing
- -19.9pp toward R · 2008: -28.1pp · 2024: -48.0pp
- All cycles
- 2024: R+48.0 2020: R+43.2 2016: R+36.5 2012: R+25.4 2008: R+28.1
Not yet ingested
- Civics
- —
Market trends
- HPI YoY
- ▼ -54.73%
- Current HPI
- 125.616
- Rent YoY
- —
- Metro
- —
- State GDP YoY
- ▲ 3.80%
- F500 in state
- 10
Industry mix (Fortune 500 HQ in AR)
| Industry | F500 HQs | Revenue |
|---|---|---|
| Retail | 1 | $681B |
|
||
| Food / Agriculture | 1 | $53B |
|
||
| Retail / Energy | 1 | $22B |
|
||
| Transportation / Logistics | 1 | $12B |
|
||
| Energy | 1 | $4B |
|
||
Price history
+45.2% since first listed13 events — show timeline
- 2026-06-09 Listed $135,000 CARMLS
- 2023-09-18 Sold (Public Records) $83,700 Public Records
- 2023-09-15 Pending — CARMLS
- 2023-09-15 Sold (MLS) $87,000 CARMLS
- 2023-07-19 Listing Removed — CARMLS
- 2023-07-18 Listed $89,900 CARMLS
- 2023-06-08 Listed $89,900 CARMLS
- 2023-04-10 Listing Removed — CARMLS
- 2023-03-13 Listed $100,000 CARMLS
- 2022-08-29 Listing Removed — CARMLS
- 2021-08-19 Listed $118,000 CARMLS
- 2008-06-16 Sold (Public Records) $116,000 Public Records
- 2006-06-23 Sold (Public Records) $93,000 Public Records
Property tax history
+3.5%/yrLatest (2025): $1,338 · +0.0% YoY. Source: county tax records.
Cash-flow waterfall
monthlySold comps — $/sqft
last 12 mo · ≤1 miLoading sold comps…