12172 Boles Blvd · Gulfport, MS
Flood risk 1/10 · Minimal
- FEMA flood zone
- X (unshaded)
- Chance of flooding over 30 yrs
- 0.0%
- Est. flood insurance / yr
- $507 – $1,088
Fire risk 4/10 · Minor
- Est. fire insurance / yr
- $1,241 – $2,305
Heat risk 10/10 · Severe
- Hot days now (above 107°F)
- 7 days/yr
- Hot days in 30 yrs
- 21 days/yr
Wind risk 9/10 · Severe
- Chance of severe wind over 30 yrs
- 99.0%
Air-quality risk 2/10 · Minimal
- Unhealthy air days now
- 1 days/yr
- Unhealthy air days in 30 yrs
- 2 days/yr
Risk factors via First Street. Map © Google.
Why this score? — see what drove the C- grade
The composite is a weighted blend of 9 inputs, each scored 0–100. Each bar is that input's sub-score; the figure is the points it added to the 100-point composite (weight × sub-score).
- Cash flow +18.4/30.0
- ARV discount +6.1/15.0
- DSCR +5.8/10.0
- 1% rule +4.9/10.0
- Rent growth +4.2/5.0
- Schools +4.2/10.0
- Condition / age +4.0/5.0
- Livability +3.7/5.0
- Appreciation +0.0/10.0
$167,990
🖨 Deal sheet 📄 Offer letter ✓ Due diligence
Listing remarks
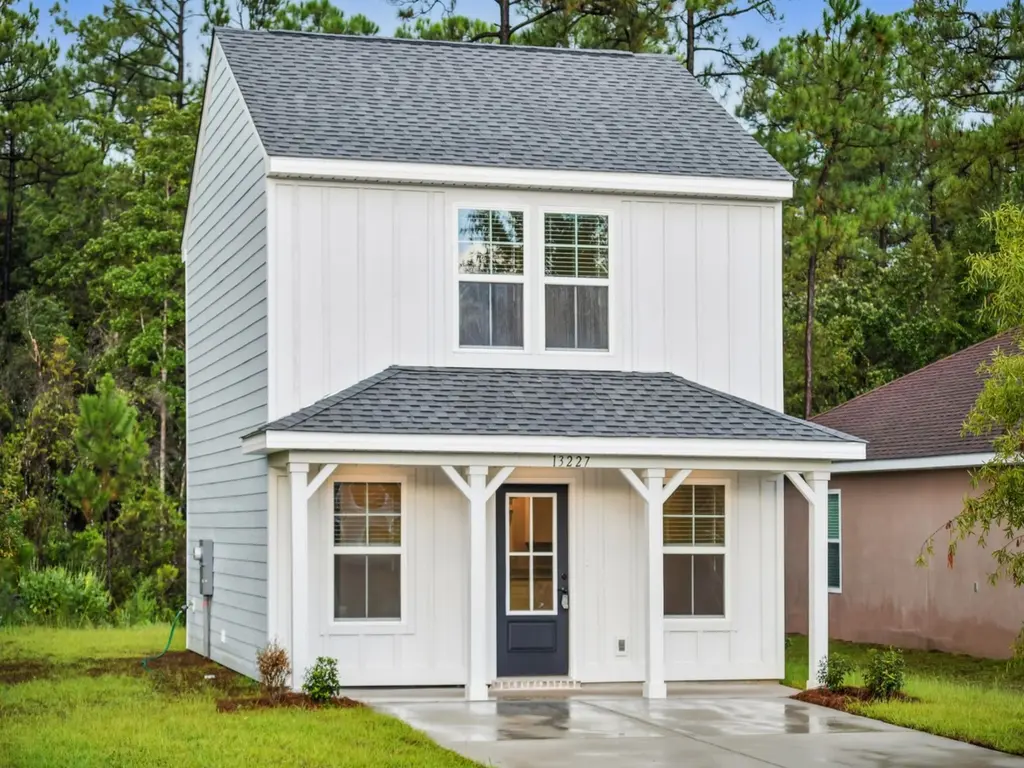
Brand NEW home ready June 2026! Enjoy stylish Villa-style living with the Parker's thoughtfully designed layout. The open-concept main level blends the kitchen, dining and living areas while the covered porch extends your living space. Upstairs, three bedrooms provide space to relax. Perfectly situated in desirable Gulfport, MS, River Estates is conveniently located near highly-rated schools and esteemed employers. With easy access to I-10, residents can explore Gulfport's plentiful shopping, dining and entertainment opportunities. This community features the Parker, a thoughtfully designed floorplan with three bedrooms and approx. 1,000 sq. ft. of livable space, offering an exciting standa
Key facts
- Covered porch
- Highly-rated schools
- Plentiful shopping
Tags
Property features AI
Finance
- Financial info: List price $167,990
Exterior
- Home design: Single-family property; Located at 12172 Boles Blvd, Gulfport, MS 39503
- Exterior features: Living area approximately 1,000
Interior
- Bedrooms: 2 bedrooms
- Bathrooms: 2 full bathrooms and 1 half bathroom (2.5 total)
- Interior features: Spec home (Parker II plan); Active listing
Neighborhood map
What this means for you Summary
Snapshot
- This is a 2-bed/2.5-bath single-family listed at $168k. Condition is rated good.
Deal economics
- At list price, monthly cash flow is $155 ($2k/yr) — positive.
- The deal already cash-flows at list — no discount required.
- To meet the 1% rule (rent ≥ 1% of price), the offer needs to be $167k (0.8% below list).
- Recommended offer: $165k (1.5% below list) — sets the bar for market timing.
- Cap rate 7.4% vs local median 4.9% in Gulfport — top-decile yield for the area; either an underpriced asset or a hidden risk that comps aren't pricing in. Stress-test before assuming the spread holds.
Location & tenants
- Location reads 73/100 on livability (#15 in MS) — a middle-class / working-renter tenant base. Strengths: cost of living A+, housing A+, health & safety A+; Watch: schools D, amenities F, commute F.
- Harrison County School District (rural): math 52% / reading 46% proficiency, ranked #14 of 130 in MS (top 11%) — families likely to look elsewhere, expect single-tenant / working-renter base with shorter leases; 62% free/reduced lunch — lower-income household profile, screen leases tightly.
- Market conditions: Rents rising fast (+7.0%/yr); 763 active listings in the ZIP; 4 comparable units currently listed for rent nearby; rentals lingering (median 44d on market — plan ~5-8 weeks vacancy on turnover, expect pricing pressure); 50% of comp listings sitting > 30 days — soft ceiling on asking rent; 2,194 units permitted in Harrison County in 2024 (0 in 5+ unit buildings).
- This rent runs 32% of the median local income ($63k/yr) — at the standard rent-burdened threshold; future hikes will face affordability resistance.
Forward outlook
- Local home prices are declining (-3.0%/yr); year-one equity from $1k of loan paydown is wiped out by about $5k of value loss. Plan a longer hold.
- Harrison County population projected at +27% by 2050 — long-run rental-demand tailwind backs the buy-and-hold thesis.
- At projected returns (-3.0% appreciation + 7.0% rent growth), your $47k cash investment doubles in ~10 years — after that, you're playing with house money.
Negotiation context
- It's been on market 15 days — a 2% lower offer ($165k) is reasonable based on typical stale-listing flexibility.
Risks & watch-outs
- Climate carrying-cost: severe wind risk, 99% chance of damaging wind over 30y; extreme-heat days projected 7→21/yr by 2055 (HVAC capex compounding) — expect insurance premiums to compound above CPI over the hold.
Questions for the listing agent
- Is there a deadline driving the sale (1031 exchange, divorce, estate, relocation)? That informs how much negotiation room exists.
- Schools are D-rated, which usually means shorter tenancies and higher turnover. Who's the typical renter profile here, and what's been the actual vacancy rate?
- What's the average days-on-market for RENTAL listings here right now (not sales)? A rising rental-DOM trend means longer vacancies and softer asking-rent achievability than the comps imply.
- What's the recent tenant-quality profile in this submarket — average credit score on applications, eviction rate, late-payment / NSF rate, and stable-employment percentage? A property-management company in the area should have these aggregated.
- How much new for-sale + rental construction is in the pipeline within 1–3 miles? Heavy new supply typically softens prices + rents 12–24 months out; constrained supply supports both.
Investment metrics
- 1% rule
- 0.99% ✗
- Cap rate
- 7.40%
- Cash-on-cash
- 3.96%
- DSCR
- 1.18
- GRM
- 8.4
CMA / ARV
- ARV (on-the-fly)
- $163,000
- Comps found
- 12
Show comp detail 12 sales within ~0.75 mi
| Address | Dist | Beds/Ba | Sqft | Sold | Price | $/sf | Match |
|---|---|---|---|---|---|---|---|
| 13378 Dee Ave | 0.09mi | 2/2.5 | 1,000 (0%) | 1mo | $167,990 | $168 | 95 |
| 13337 Kelly St #5 | 0.02mi | 3/1.5 (+1) | 1,013 (+1%) | 2mo | $170,000 | $168 | 86 |
| 13497 Dee Ave | 0.21mi | 2/2.5 | 1,000 (0%) | 5mo | $167,490 | $167 | 86 |
| 13372 Dee Ave | 0.08mi | 3/1.5 (+1) | 1,000 (0%) | 2mo | $163,990 | $164 | 86 |
| 13410 George Ave | 0.09mi | 3/1.5 (+1) | 1,000 (0%) | 3mo | $162,365 | $162 | 84 |
| 13329 Kelly St | 0.05mi | 3/1.5 (+1) | 1,030 (+3%) | 1mo | $170,000 | $165 | 83 |
| 13504 Dee Ave | 0.28mi | 3/2.5 (+1) | 1,000 (0%) | 1mo | $159,990 | $160 | 81 |
| 13491 Dee Ave | 0.18mi | 3/1.5 (+1) | 1,000 (0%) | 5mo | $160,990 | $161 | 79 |
| 13447 Gorman St | 0.24mi | 3/1.5 (+1) | 1,000 (0%) | 3mo | $161,990 | $162 | 78 |
| 13522 Dee Ave | 0.32mi | 3/1.5 (+1) | 1,000 (0%) | 0mo | $162,990 | $163 | 76 |
| 13510 Dee Ave | 0.28mi | 3/1.5 (+1) | 1,000 (0%) | 3mo | $162,990 | $163 | 75 |
| 13455 Gorman St | 0.26mi | 3/1.5 (+1) | 1,000 (0%) | 5mo | $154,990 | $155 | 75 |
Match score weights: distance 35% · size 25% · config 20% · recency 20%. Top-matched comps best support the ARV.
Projected returns pro-forma
-3.0% appreciation · 6.99% rent growth · sell at horizon
- IRR
- -5.7%
- Equity multiple
- 0.78×
- Total profit
- $-10,346
- Equity at exit
- $25,048
- IRR
- 8.2%
- Equity multiple
- 1.74×
- Total profit
- $34,832
- Equity at exit
- $14,525
Cash invested: $47,037 (down + closing). Projections, not guarantees.
Landlord ↔ Tenant lean methodology
- Overall (STATE)
- 90 Strongly Landlord-Friendly
- State Mississippi
- 90 Strongly Landlord-Friendly · R+11
- County
- — inherits STATE
- City
- — inherits STATE
ZIP-level market 39503
- Home prices YoY
- -21.5%
- Rents YoY
- 7.0%
- Active inventory
- 763
- Price-to-rent
- 8.4×
Monthly cashflow live
- Estimated rent
- $1,666 medium interval (Pro) →
- Mortgage (P&I)
- −$881
- Tax est. 1.5%
- −$210 /mo · $2,520/yr
- Insurance
- −$70
- HOA
- −$0
- Vacancy / Maint / Mgmt
- −$350
- Net cashflow
- $155
Break-even live
UW: 25.0% down · 7.5% · 30yr · 1.5% tax · 5.0% vac · 8.0% maint · 8.0% mgmt
Financing live
Cash to close
- Down payment
- $41,998
- Closing costs
- $5,040
- Reserves months
- —
- Total cash needed
- —
Loan-product check · same deal, 3 products live
Conventional
25% down · 7.5% · 30yr
- Down + closing
- —
- Monthly P&I
- —
- Monthly cashflow
- —
- DSCR
- —
- Eligible?
- —
Personal DTI + credit; lowest rate.
DSCR
20% down · 8.5% · 30yr
- Down + closing
- —
- Monthly P&I
- —
- Monthly cashflow
- —
- DSCR
- —
- Eligible?
- —
No personal income docs; deal must DSCR.
Hard money
10% down · 12.0% · 12mo
- Down + closing
- —
- Monthly P&I
- —
- Monthly cashflow
- —
- DSCR
- —
- Eligible?
- —
Short-term bridge; refi at stabilization.
Rent comps 4 comps
| Address | Beds | Baths | Sqft | Rent | $/sqft | DOM | Units | Dist |
|---|---|---|---|---|---|---|---|---|
| 13459 Gorman St Gulfport, MS | 2.0 | 1.5 | 1000 | $1,649 | $1.65 | 43d | 1 | 0.24mi |
| 13498 Dee Ave Gulfport, MS | 3.0 | 2.0 | 1410 | $1,750 | $1.24 | 43d | 1 | 0.24mi |
| 14179 Debra Barbee Ct Gulfport, MS | 3.0 | 2.0 | 1379 | $1,849 | $1.34 | 21d | 1 | 0.69mi |
| 13070 Tracewood Dr Gulfport, MS | 3.0 | 2.0 | 1190 | $1,400 | $1.18 | 21d | 1 | 1.39mi |
Listing history 11 events
-
2026-06-18days on market $167,990 Active 15 DOM
-
2026-06-17days on market $167,990 Active 14 DOM
-
2026-06-16days on market $167,990 Active 13 DOM
-
2026-06-15days on market $167,990 Active 12 DOM
-
2026-06-14days on market $167,990 Active 10 DOM
-
2026-06-13days on market $167,990 Active 9 DOM
-
2026-06-10days on market $167,990 Active 7 DOM
-
2026-06-09days on market $167,990 Active 6 DOM
-
2026-06-08days on market $167,990 Active 5 DOM
-
2026-06-07remarks 699-char remark
-
2026-06-07days on market $167,990 Active 4 DOM
ⓘ Source: listings_history table (triggers on properties + properties_extension) + one-shot
backfill from property_details.listing_events for pre-trigger history.
Climate risk First Street
- Flood 1/10 Low FEMA zone X (unshaded) · 0% chance over 30 yrs
- Wildfire 4/10 Moderate
- Heat 10/10 Extreme 7 d/yr ≥107°F today · 21 d/yr by 30 yrs out
- Wind 9/10 Extreme 99% chance of damaging wind over 30 yrs
- Air quality 2/10 Low 1 unhealthy d/yr today · 2 by 30 yrs out
Nearby sold comps map
Loading sold comps map…
Walkable amenities ~0.75 mi
Loading nearby amenities…
Taxation est. · year 1
- Rental income
- $19,994
- − Mortgage interest
- −$9,410
- − Property taxes
- −$2,520
- − Insurance
- −$840
- − Repairs & maintenance
- −$1,600
- − Management
- −$1,600
- − Depreciation
- −$4,887
- Taxable loss
- −$862
- Est. tax savings @ 24.0%
- +$207
- After-tax cash flow
- $2,071/yr
For passive investors: Depreciation is non-cash, so a rental often shows a tax loss while cash-flowing — sheltering income. Rental losses are passive: they offset passive income freely, and up to $25,000/yr can offset ordinary (W-2) income if you actively participate and your MAGI is under $100k (phasing out to $0 by $150k); unused losses carry forward. On sale, claimed depreciation is recaptured at up to 25%, and gains may owe capital-gains tax (a 1031 exchange can defer both). Figures are a year-1 estimate at your 24.0% rate — not tax advice; consult a CPA.
Condition & rehab AI · 17 photos
This home is in excellent condition with modern finishes and a well-maintained exterior. It offers a great opportunity for a potential buyer or renter looking for a move-in ready property with room for minor updates to enhance its curb appeal and value.
Value-add opportunities
- Both Painting the exterior — Enhances curb appeal and can increase both resale and rental value.
- Both Landscaping improvements — Enhances curb appeal and can increase both resale and rental value.
- Both Adding a smart home system — Improves convenience and can increase both resale and rental value.
- Resale Upgrading the kitchen backsplash — Can add visual interest and increase the home's curb appeal.
- Rental Adding a smart thermostat — Improves energy efficiency and can attract renters looking for smart home features.
Renovation cost estimate screening
Value-add ROI direction
- Both Painting the exterior — Enhances curb appeal and can increase both resale and rental value. ↑
- Both Landscaping improvements — Enhances curb appeal and can increase both resale and rental value. ↑
- Both Adding a smart home system — Improves convenience and can increase both resale and rental value. ↑
- Resale Upgrading the kitchen backsplash — Can add visual interest and increase the home's curb appeal. ↑
- Rental Adding a smart thermostat — Improves energy efficiency and can attract renters looking for smart home features. ↑
ⓘ Cost ranges are severity-bucket heuristics (US national rule-of-thumb). Get contractor quotes + a written scope before underwriting a rehab budget.
Schools (NCES district)
- District
- Harrison County School District
- NCES district ID
- 2801770
- Math proficiency
- 52% ▼ -4.00%
- Reading proficiency
- 46% ▼ -4.00%
- Median HH income
- $46,504
- Composite
- 41.66/100
- National rank
- #3419
- State rank
- #14 of 130 in MS
Livability — Gulfport
- Score
- 73/100
- State rank
- #15
- US rank
- #5010
Category grades
Schools grade is shown separately in the Schools card above.
Census & demographics
- Census place
- Gulfport, MS
- County
- Harrison County · 178,171 people
- City population
- 96,188
- Metro
- Gulfport-Biloxi, MS
- Population (ZIP)
- 55,059
- Household income
- $62,641
- Rent vs Own
- Severe rent burden
- 1686.0
Population outlook (Harrison County) Hauer SSP2
- Today (2025)
- 228,444 people
- By 2030
- 241,942 · +5.9%
- By 2040
- 267,531 · +17.1%
- By 2050
- 291,062 · +27.4%
- By 2075
- 346,711 · +51.8%
- By 2100
- 378,165 · +65.5%
Race, ethnicity, and origin ACS 2023
- Neighborhood character
- Diverse neighborhood (Simpson 0.58)
- Race & ethnicity
- White 58% Black 27% Two or more races 9% Hispanic / Latino 6% Asian 2%
- Hispanic origin (detail)
- Mexican 2% Puerto Rican 1%
- Common ancestry
- Lithuanian 5% Slovak 1% Portuguese 1%
- Foreign-born
- 3% · Canada
- Languages at home
- 95% English-only · Spanish 3%
Political lean MEDSL · Harrison
- 2024 margin
- Strong R (+28.9) · D 35.0% · R 63.9% · Other 1.1%
- 2008→2024 swing
- -2.9pp toward R · 2008: -26.0pp · 2024: -28.9pp
- All cycles
- 2024: R+28.9 2020: R+25.2 2016: R+30.7 2012: R+26.6 2008: R+26.0
Not yet ingested
- Civics
- —
Market trends
- HPI YoY
- ▼ -51.39%
- Current HPI
- 187.285
- Rent YoY
- ▲ 6.99%
- Metro
- Gulfport-Biloxi, MS
- State GDP YoY
- —
- F500 in state
- 0
Cash-flow waterfall
monthlySold comps — $/sqft
last 12 mo · ≤1 miLoading sold comps…