22 Prestonwood Ct · Fairfield Glade, TN
Flood risk 1/10 · Minimal
- FEMA flood zone
- X (unshaded)
- Chance of flooding over 30 yrs
- 0.0%
- Est. flood insurance / yr
- $507 – $1,088
Fire risk 4/10 · Minor
- Est. fire insurance / yr
- $949 – $1,763
Heat risk 4/10 · Minor
- Hot days now (above 98°F)
- 7 days/yr
- Hot days in 30 yrs
- 20 days/yr
Wind risk 3/10 · Minor
- Chance of severe wind over 30 yrs
- 6.0%
Air-quality risk 2/10 · Minimal
- Unhealthy air days now
- 1 days/yr
- Unhealthy air days in 30 yrs
- 2 days/yr
Risk factors via First Street. Map © Google.
Why this score? — see what drove the C+ grade
The composite is a weighted blend of 9 inputs, each scored 0–100. Each bar is that input's sub-score; the figure is the points it added to the 100-point composite (weight × sub-score).
- Cash flow +26.4/30.0
- DSCR +9.0/10.0
- ARV discount +7.5/15.0
- 1% rule +6.3/10.0
- Appreciation +4.0/10.0
- Livability +3.1/5.0
- Schools +2.6/10.0
- Rent growth +2.5/5.0
- Condition / age +2.5/5.0
$175,000
🖨 Deal sheet 📄 Offer letter ✓ Due diligence
Listing remarks
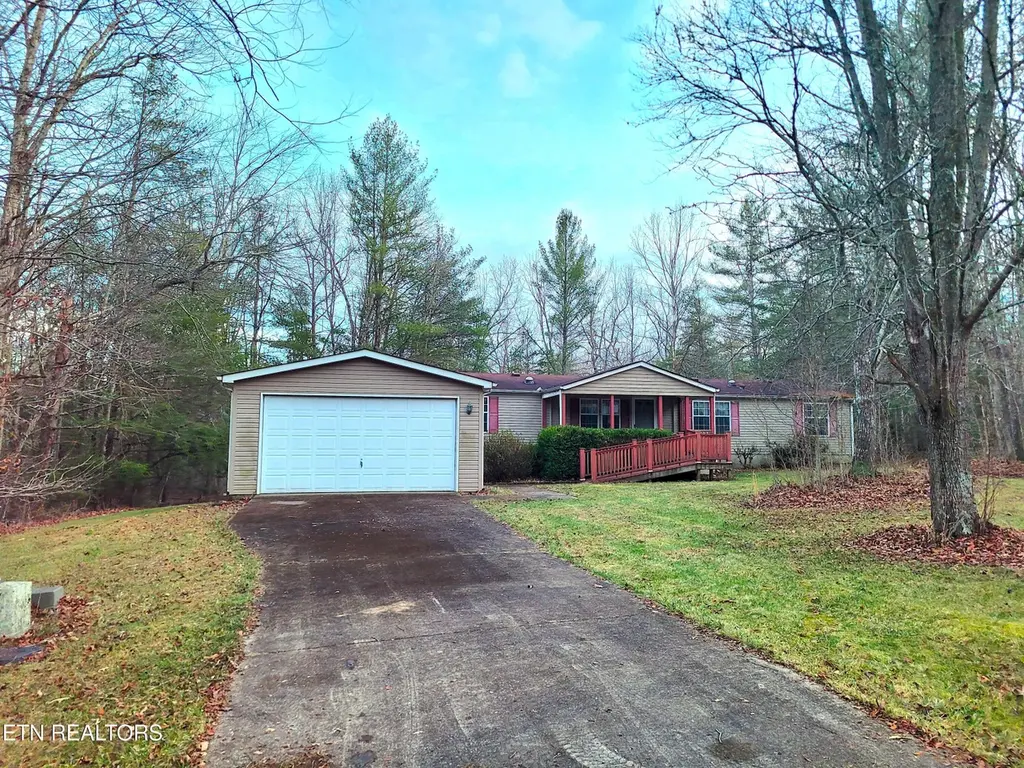
This single-level residence in the established Prestonwood Estates community offers 1,560 square feet of functional living space. The interior features a rectangular design with a versatile open-concept layout, including a spacious kitchen with a center island and vaulted ceilings that enhance the natural light. The primary suite includes a private bathroom with dual vanities and a large soaking tub, while the additional bedrooms provide flexible space for guests or a home office. The property is situated on a rolling lot and includes significant exterior amenities, such as a 20x22 detached garage, a secondary carport, and a 136-square-foot wood deck. The home is serviced by public water an
Key facts
- Dual vanities
- Spacious kitchen
- Private bathroom
Tags
Property features AI
Finance
- HOA & community: Monthly association fee of $71
Exterior
- Parking: Detached 2-car garage
- Utilities: Septic tank
- Home design: Not attached to another unit; 1,560 building area (tax records)
- Construction: Vinyl siding; Frame construction; Crawl space foundation
- Exterior features: Cul-de-sac lot; Private setting; Wooded lot; Irregular lot; Country/wooded view
Interior
- Kitchen: Dishwasher; Self-cleaning oven
- Flooring: Laminate; Carpet; Vinyl
- Bathrooms: 2 full bathrooms
- Heating & cooling: Central heating (propane); Central cooling; Ceiling fan(s)
- Interior features: Walk-in closet(s); Pantry; 7 total rooms; Electric fireplace
Neighborhood map
What this means for you Summary
Snapshot
- This is a 3-bed/2.0-bath single-family listed at $175k.
Deal economics
- At list price, monthly cash flow is $455 ($5k/yr) — positive.
- The deal already cash-flows at list — no discount required.
- Meets the 1% rule at list price ($2k rent vs $175k).
- Recommended offer: $170k (3.0% below list) — sets the bar for market timing.
- Cap rate 9.4% vs local median 2.2% in Fairfield Glade — top-decile yield for the area; either an underpriced asset or a hidden risk that comps aren't pricing in. Stress-test before assuming the spread holds.
Location & tenants
- Location reads 61/100 on livability (#249 in TN) — a middle-class / working-renter tenant base. Strengths: cost of living A+, housing A+, employment B; Watch: schools D, amenities F, commute F.
- Cumberland County (rural): math 30% / reading 31% proficiency, ranked #59 of 139 in TN (top 42%) — families likely to look elsewhere, expect single-tenant / working-renter base with shorter leases.
- Market conditions: 596 active listings in the ZIP; 114 units permitted in Cumberland County in 2024 (0 in 5+ unit buildings).
Forward outlook
- Local home prices are declining (-2.1%/yr); year-one equity from $1k of loan paydown is wiped out by about $4k of value loss. Plan a longer hold.
- Cumberland County population projected at +7% by 2050 — modest demand growth; plan on rents tracking national, not racing it.
- At projected returns (-2.1% appreciation + 3.0% rent growth), your $49k cash investment doubles in ~9 years — after that, you're playing with house money.
Negotiation context
- It's been on market 49 days — a 3% lower offer ($170k) is reasonable based on typical stale-listing flexibility.
- 2 sale attempts with the ask held roughly flat each time — persistent listings suggest the price (not the market) is what's stuck; bring a comps-based counter.
Questions for the listing agent
- It's been on market 49 days. Have you received any prior offers? Is the seller open to a 3% concession, seller financing, or rate buy-down credit?
- What does the HOA fee cover, when was the last increase, and are there any pending special assessments or reserve-fund shortfalls?
- Is there a deadline driving the sale (1031 exchange, divorce, estate, relocation)? That informs how much negotiation room exists.
- Schools are D-rated, which usually means shorter tenancies and higher turnover. Who's the typical renter profile here, and what's been the actual vacancy rate?
- What's the average days-on-market for RENTAL listings here right now (not sales)? A rising rental-DOM trend means longer vacancies and softer asking-rent achievability than the comps imply.
- What's the recent tenant-quality profile in this submarket — average credit score on applications, eviction rate, late-payment / NSF rate, and stable-employment percentage? A property-management company in the area should have these aggregated.
- How much new for-sale + rental construction is in the pipeline within 1–3 miles? Heavy new supply typically softens prices + rents 12–24 months out; constrained supply supports both.
Investment metrics
- 1% rule
- 1.13% ✓
- Cap rate
- 9.41%
- Cash-on-cash
- 11.14%
- DSCR
- 1.50
- GRM
- 7.4
CMA / ARV
No comps found within radius.
Projected returns pro-forma
-2.06% appreciation · 3.0% rent growth · sell at horizon
- IRR
- 3.7%
- Equity multiple
- 1.15×
- Total profit
- $7,576
- Equity at exit
- $33,542
- IRR
- 11.7%
- Equity multiple
- 2.02×
- Total profit
- $49,981
- Equity at exit
- $28,241
Cash invested: $49,000 (down + closing). Projections, not guarantees.
Landlord ↔ Tenant lean methodology
- Overall (STATE)
- 87 Strongly Landlord-Friendly
- State Tennessee
- 87 Strongly Landlord-Friendly · R+13
- County
- — inherits STATE
- City
- — inherits STATE
ZIP-level market 38558
- Home prices YoY
- -0.8%
- Active inventory
- 596
- Price-to-rent
- 7.4×
Monthly cashflow live
- Estimated rent
- $1,973 medium interval (Pro) →
- Mortgage (P&I)
- −$918
- Tax from tax record
- −$42 /mo · $507/yr
- Insurance
- −$73
- HOA
- −$71
- Vacancy / Maint / Mgmt
- −$414
- Net cashflow
- $455
Break-even live
UW: 25.0% down · 7.5% · 30yr · 1.5% tax · 5.0% vac · 8.0% maint · 8.0% mgmt
Financing live
Cash to close
- Down payment
- $43,750
- Closing costs
- $5,250
- Reserves months
- —
- Total cash needed
- —
Loan-product check · same deal, 3 products live
Conventional
25% down · 7.5% · 30yr
- Down + closing
- —
- Monthly P&I
- —
- Monthly cashflow
- —
- DSCR
- —
- Eligible?
- —
Personal DTI + credit; lowest rate.
DSCR
20% down · 8.5% · 30yr
- Down + closing
- —
- Monthly P&I
- —
- Monthly cashflow
- —
- DSCR
- —
- Eligible?
- —
No personal income docs; deal must DSCR.
Hard money
10% down · 12.0% · 12mo
- Down + closing
- —
- Monthly P&I
- —
- Monthly cashflow
- —
- DSCR
- —
- Eligible?
- —
Short-term bridge; refi at stabilization.
HOA detail
- Monthly dues
- $71 · $852/yr
- Likely covers
- water
Listing history 19 events
-
2026-06-18days on market $175,000 Active 49 DOM
-
2026-06-17days on market $175,000 Active 48 DOM
-
2026-06-16days on market $175,000 Active 47 DOM
-
2026-06-15statusdays on market $175,000 Active 46 DOM
-
2026-06-13days on market $175,000 Pending - Continue to Show 44 DOM
-
2026-06-12days on market $175,000 Pending - Continue to Show 43 DOM
-
2026-06-09days on market $175,000 Pending - Continue to Show 40 DOM
-
2026-06-08days on market $175,000 Pending - Continue to Show 39 DOM
-
2026-06-08days on market $175,000 Pending - Continue to Show 38 DOM
-
2026-06-07days on market $175,000 Pending - Continue to Show 37 DOM
-
2026-06-03days on market $175,000 Pending - Continue to Show 34 DOM
-
2026-06-02days on market $175,000 Pending - Continue to Show 33 DOM
-
2026-06-01days on market $175,000 Pending - Continue to Show 32 DOM
-
2026-05-31days on market $175,000 Pending - Continue to Show 31 DOM
-
2026-04-30$175,000 Active
-
2026-04-22historical
-
2026-04-17price $175,000
-
2026-03-03price $185,000
-
2026-01-22$199,000 Active
ⓘ Source: listings_history table (triggers on properties + properties_extension) + one-shot
backfill from property_details.listing_events for pre-trigger history.
Tax reassessment forecast TN · Resets to sale price
- Current annual tax
- $507 · $42/mo
- Projected year-2 tax
- $1,242 · $104/mo
- Expected delta
- +$736/yr (+$61/mo · 145.1%)
ⓘ Screening estimate from a state-policy table — verify with the county assessor before closing.
Climate risk First Street
- Flood 1/10 Low FEMA zone X (unshaded) · 0% chance over 30 yrs
- Wildfire 4/10 Moderate
- Heat 4/10 Moderate 7 d/yr ≥98°F today · 20 d/yr by 30 yrs out
- Wind 3/10 Moderate 6% chance of damaging wind over 30 yrs
- Air quality 2/10 Low 1 unhealthy d/yr today · 2 by 30 yrs out
Nearby sold comps map
Loading sold comps map…
Walkable amenities ~0.75 mi
Loading nearby amenities…
Taxation est. · year 1
- Rental income
- $23,676
- − Mortgage interest
- −$9,803
- − Property taxes
- −$507
- − Insurance
- −$875
- − Repairs & maintenance
- −$1,894
- − Management
- −$1,894
- − HOA
- −$852
- − Depreciation
- −$5,091
- Taxable income
- $2,761
- Est. tax owed @ 24.0%
- −$663
- After-tax cash flow
- $4,795/yr
For passive investors: Depreciation is non-cash, so a rental often shows a tax loss while cash-flowing — sheltering income. Rental losses are passive: they offset passive income freely, and up to $25,000/yr can offset ordinary (W-2) income if you actively participate and your MAGI is under $100k (phasing out to $0 by $150k); unused losses carry forward. On sale, claimed depreciation is recaptured at up to 25%, and gains may owe capital-gains tax (a 1031 exchange can defer both). Figures are a year-1 estimate at your 24.0% rate — not tax advice; consult a CPA.
Schools (NCES district)
- District
- Cumberland County
- NCES district ID
- 4700900
- Math proficiency
- 30% ▼ -10.00%
- Reading proficiency
- 31% ▼ -7.00%
- Median HH income
- $38,510
- Composite
- 25.52/100
- National rank
- #7438
- State rank
- #59 of 139 in TN
Livability — Fairfield Glade
- Score
- 61/100
- State rank
- #249
- US rank
- #17907
Category grades
Schools grade is shown separately in the Schools card above.
Census & demographics
- Census place
- Fairfield Glade, TN
- City population
- 9,270
- Population (ZIP)
- 9,270
Population outlook (Cumberland County) Hauer SSP2
- Today (2025)
- 61,344 people
- By 2030
- 62,611 · +2.1%
- By 2040
- 64,547 · +5.2%
- By 2050
- 65,462 · +6.7%
- By 2075
- 66,839 · +9.0%
- By 2100
- 63,855 · +4.1%
Race, ethnicity, and origin ACS 2023
- Neighborhood character
- Predominantly White (94%)
- Race & ethnicity
- White 94% Hispanic / Latino 3% Two or more races 3% Asian 1%
- Common ancestry
- Romanian 4% Slovak 4% Lithuanian 3%
- Foreign-born
- 2% · Canada
- Languages at home
- 98% English-only · Spanish 1% Other Asian/Pacific 1%
Political lean MEDSL · Cumberland
- 2024 margin
- Solid R (+58.9) · D 20.2% · R 79.1%
- 2008→2024 swing
- -21.8pp toward R · 2008: -37.1pp · 2024: -58.9pp
- All cycles
- 2024: R+58.9 2020: R+57.1 2016: R+57.8 2012: R+49.1 2008: R+37.1
Not yet ingested
- Civics
- —
Market trends
- HPI YoY
- ▼ -2.06%
- Current HPI
- 261.4637
- Rent YoY
- —
- Metro
- —
- State GDP YoY
- ▲ 2.78%
- F500 in state
- 22
Industry mix (Fortune 500 HQ in TN)
| Industry | F500 HQs | Revenue |
|---|---|---|
| Healthcare | 3 | $91B |
|
||
| Retail | 3 | $72B |
|
||
| Transportation / Logistics | 1 | $88B |
|
||
| Paper / Packaging | 1 | $19B |
|
||
| Insurance | 1 | $13B |
|
||
| Energy | 1 | $12B |
|
||
Price history
-12.1% since first listed5 events — show timeline
- 2026-04-30 Listed $175,000 Knoxville MLS
- 2026-04-22 Listing Removed — Knoxville MLS
- 2026-04-17 Price Changed $175,000 Knoxville MLS
- 2026-03-03 Price Changed $185,000 Knoxville MLS
- 2026-01-22 Listed $199,000 Knoxville MLS
Property tax history
+1.6%/yrLatest (2025): $507 · +0.0% YoY. Source: county tax records.
Cash-flow waterfall
monthlySold comps — $/sqft
last 12 mo · ≤1 miLoading sold comps…