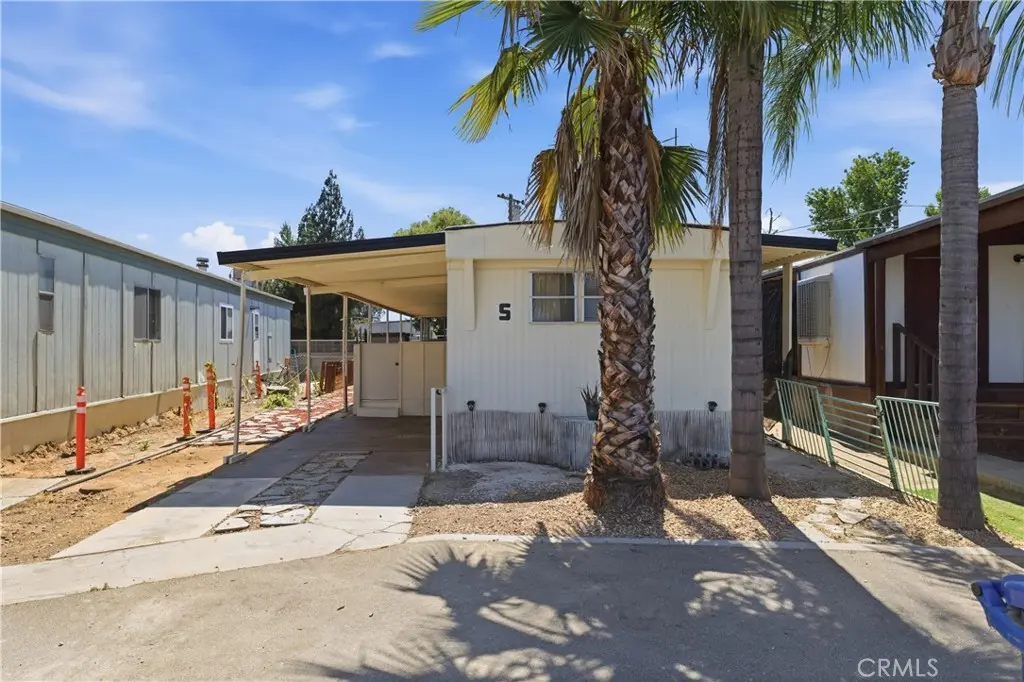
5000 Pierce Rd #5 · Oildale, CA
Flood risk 1/10 · Minimal
- FEMA flood zone
- X (unshaded)
- Chance of flooding over 30 yrs
- 0.0%
- Est. flood insurance / yr
- $507 – $1,088
Fire risk 1/10 · Minimal
- Est. fire insurance / yr
- $659 – $1,223
Heat risk 8/10 · Major
- Hot days now (above 105°F)
- 7 days/yr
- Hot days in 30 yrs
- 18 days/yr
Wind risk 1/10 · Minimal
- Chance of severe wind over 30 yrs
- —
Air-quality risk 10/10 · Severe
- Unhealthy air days now
- 39 days/yr
- Unhealthy air days in 30 yrs
- 45 days/yr
Risk factors via First Street. Map © Google.
Why this score? — see what drove the B grade
The composite is a weighted blend of 9 inputs, each scored 0–100. Each bar is that input's sub-score; the figure is the points it added to the 100-point composite (weight × sub-score).
- Cash flow +30.0/30.0
- 1% rule +10.0/10.0
- DSCR +10.0/10.0
- ARV discount +7.5/15.0
- Condition / age +4.0/5.0
- Rent growth +3.1/5.0
- Livability +2.9/5.0
- Appreciation +2.7/10.0
- Schools +1.0/10.0
$84,999
🖨 Deal sheet 📄 Offer letter ✓ Due diligence
Listing remarks
Welcome Home to 5000 Piercer Road spc 5, Bakersfield, CA! Discover this beautifully updated mobile home located in Bakersfield, offering comfortable living and modern appeal. This property features a spacious layout with 3 bedrooms and 2 full bathrooms, perfect for families or those seeking extra space. This property also offers a bonus room for more space.
Key facts
- Garage
- Community pool
- Built 1971
Property features AI
Finance
- Other: Lot reported as 0-1 unit/acre; Elevation units in feet
- HOA & community: Part of an association; Suburban community; Located in Bakersfield MHP (land-lease community); Land lease: $795
Exterior
- Parking: Attached garage; 1 garage space (1 total parking space)
- Utilities: Public sewer; Public/District water
- Home design: Single-unit mobile home; Single-story; Entry level: 1
- Construction: Mobile home approximately 12 ft by 65 ft; Year-built source: Builder
- Exterior features: Community pool; One shed on the property; Mobile home remains on site
Interior
- Bathrooms: 2 full bathrooms
- Interior features: One-level home; Entry on the left side
- Laundry & utility: No laundry hook-ups on site
Neighborhood map
What this means for you Summary
Snapshot
- This is a 3-bed/2.0-bath manufactured listed at $85k. Condition is rated good.
Deal economics
- At list price, monthly cash flow is $571 ($7k/yr) — positive.
- The deal already cash-flows at list — no discount required.
- Meets the 1% rule at list price ($1k rent vs $85k).
- Recommended offer: $84k (1.5% below list) — sets the bar for market timing.
- Cap rate 14.4% vs local median 3.9% in Oildale — top-decile yield for the area; either an underpriced asset or a hidden risk that comps aren't pricing in. Stress-test before assuming the spread holds.
Location & tenants
- Location reads 58/100 on livability (#680 in CA) — a working-class tenant base; expect higher turnover. Strengths: housing A+, schools B+; Watch: crime F, amenities F, commute F.
- Beardsley Elementary (suburban): math 7% / reading 18% proficiency, ranked #501 of 517 in CA (top 97%) — low school quality limits family demand, transient renter base, plan for 1-2y turnover; 76% free/reduced lunch — lower-income household profile, screen leases tightly.
- Market conditions: Rents rising (+2.2%/yr); 307 active listings in the ZIP; 20 comparable units currently listed for rent nearby; rentals leasing fast (median 3d on market — plan ~1-2 weeks tenant-placement turnaround); 3,244 units permitted in Kern County in 2024 (73 in 5+ unit buildings).
Forward outlook
- Local home prices are declining (-3.0%/yr); year-one equity from $587 of loan paydown is wiped out by about $3k of value loss. Plan a longer hold.
- Kern County population projected at +17% by 2050 — long-run rental-demand tailwind backs the buy-and-hold thesis.
- At projected returns (-3.0% appreciation + 2.2% rent growth), your $24k cash investment doubles in ~5 years — after that, you're playing with house money.
Negotiation context
- It's been on market 16 days — a 2% lower offer ($84k) is reasonable based on typical stale-listing flexibility.
Risks & watch-outs
- Climate carrying-cost: extreme-heat days projected 7→18/yr by 2055 (HVAC capex compounding) — expect insurance premiums to compound above CPI over the hold.
Questions for the listing agent
- Built in 1971 — when were the roof, HVAC, electrical panel, plumbing, and water heater last replaced?
- Is there a deadline driving the sale (1031 exchange, divorce, estate, relocation)? That informs how much negotiation room exists.
- Schools are B-rated — typically a magnet for longer-tenancy family renters. What's the average tenant stay here, and is there a school-zone premium baked into asking?
- Crime grade is F in this area — have there been break-ins, vandalism, or insurance claims at this property in the last 3 years? What carrier currently insures it and at what premium?
- What's the average days-on-market for RENTAL listings here right now (not sales)? A rising rental-DOM trend means longer vacancies and softer asking-rent achievability than the comps imply.
- What's the recent tenant-quality profile in this submarket — average credit score on applications, eviction rate, late-payment / NSF rate, and stable-employment percentage? A property-management company in the area should have these aggregated.
- How much new for-sale + rental construction is in the pipeline within 1–3 miles? Heavy new supply typically softens prices + rents 12–24 months out; constrained supply supports both.
Investment metrics
- 1% rule
- 1.73% ✓
- Cap rate
- 14.35%
- Cash-on-cash
- 28.79%
- DSCR
- 2.28
- GRM
- 4.8
CMA / ARV
- ARV (on-the-fly)
- $50,700
- Comps found
- 10
Show comp detail 10 sales within ~0.75 mi
| Address | Dist | Beds/Ba | Sqft | Sold | Price | $/sf | Match |
|---|---|---|---|---|---|---|---|
| 287 Florence Ln | 0.44mi | 2/2.0 (-1) | 790 (+1%) | 1mo | $17,500 | $22 | 72 |
| 5000 Pierce #19 | 0.01mi | 2/1.5 (-1) | 860 (+10%) | 10mo | $7,500 | $9 | 68 |
| 281 Teakwood Ln | 0.45mi | 2/2.0 (-1) | 764 (-2%) | 9mo | $50,000 | $65 | 64 |
| 324 Nita Ln | 0.49mi | 2/1.0 (-1) | 732 (-6%) | 5mo | $50,000 | $68 | 54 |
| 77 Cinnamon Ln | 0.34mi | 2/1.0 (-1) | 672 (-14%) | 2mo | $43,000 | $64 | 50 |
| 279 Teakwood Ln | 0.42mi | 2/1.5 (-1) | 720 (-8%) | 16mo | $75,000 | $104 | 48 |
| 144 Torrey Pine Ln | 0.42mi | 2/2.0 (-1) | 880 (+13%) | 13mo | $32,000 | $36 | 43 |
| 188 Kings Ln | 0.40mi | 2/1.0 (-1) | 720 (-8%) | 20mo | $61,000 | $85 | 42 |
| 269 Teakwood Ln | 0.39mi | 2/1.0 (-1) | 864 (+11%) | 16mo | $35,000 | $41 | 41 |
| 166 Hickorywood Ln | 0.51mi | 2/1.0 (-1) | 720 (-8%) | 24mo | $62,000 | $86 | 34 |
Match score weights: distance 35% · size 25% · config 20% · recency 20%. Top-matched comps best support the ARV.
Projected returns pro-forma
-3.0% appreciation · 2.22% rent growth · sell at horizon
- IRR
- 22.2%
- Equity multiple
- 1.90×
- Total profit
- $21,474
- Equity at exit
- $12,674
- IRR
- 29.8%
- Equity multiple
- 3.56×
- Total profit
- $61,005
- Equity at exit
- $7,349
Cash invested: $23,800 (down + closing). Projections, not guarantees.
Landlord ↔ Tenant lean methodology
- Overall (STATE)
- 18 Strongly Tenant-Friendly
- State California
- 18 Strongly Tenant-Friendly · D+13
- County
- — inherits STATE
- City
- — inherits STATE
ZIP-level market 93308
- Home prices YoY
- -0.5%
- Rents YoY
- 2.2%
- Active inventory
- 307
- Price-to-rent
- 4.8×
Monthly cashflow live
- Estimated rent
- $1,466 high interval (Pro) →
- Mortgage (P&I)
- −$446
- Tax est. 1.5%
- −$106 /mo · $1,275/yr
- Insurance
- −$35
- HOA
- −$0
- Vacancy / Maint / Mgmt
- −$308
- Net cashflow
- $571
Break-even live
UW: 25.0% down · 7.5% · 30yr · 1.5% tax · 5.0% vac · 8.0% maint · 8.0% mgmt
Financing live
Cash to close
- Down payment
- $21,250
- Closing costs
- $2,550
- Reserves months
- —
- Total cash needed
- —
Loan-product check · same deal, 3 products live
Conventional
25% down · 7.5% · 30yr
- Down + closing
- —
- Monthly P&I
- —
- Monthly cashflow
- —
- DSCR
- —
- Eligible?
- —
Personal DTI + credit; lowest rate.
DSCR
20% down · 8.5% · 30yr
- Down + closing
- —
- Monthly P&I
- —
- Monthly cashflow
- —
- DSCR
- —
- Eligible?
- —
No personal income docs; deal must DSCR.
Hard money
10% down · 12.0% · 12mo
- Down + closing
- —
- Monthly P&I
- —
- Monthly cashflow
- —
- DSCR
- —
- Eligible?
- —
Short-term bridge; refi at stabilization.
Rent comps 20 comps
| Address | Beds | Baths | Sqft | Rent | $/sqft | DOM | Units | Dist |
|---|---|---|---|---|---|---|---|---|
| 811 Beardsley Ave Bakersfield, CA | 2.0 | 1.0 | 800 | $1,295 | $1.62 | 3d | 1 | 0.36mi |
| 117 Harris Dr Bakersfield, CA | 2.0 | 1.0 | 560 | $1,300 | $2.32 | 19d | 1 | 0.41mi |
| 706 Huskey Dr Bakersfield, CA | 2.0 | 1.0 | 832 | $1,450 | $1.74 | 44d | 1 | 0.48mi |
| 627 Beardsley Ave Bakersfield, CA | 3.0 | 1.0 | 967 | $1,575 | $1.63 | 44d | 1 | 0.52mi |
| 213 Oildale Dr Unit A Bakersfield, CA | 2.0 | 2.0 | 928 | $1,195 | $1.29 | 3d | 1 | 0.74mi |
| 819 Washington Ave Bakersfield, CA | 2.0 | 1.0 | 767 | $1,295 | $1.69 | 3d | 1 | 0.75mi |
| 448 S Oildale Dr Bakersfield, CA | 3.0 | 2.0 | 1080 | $1,500 | $1.39 | 3d | 1 | 0.78mi |
| 327 McCord Ave Unit 6 Bakersfield, CA | 3.0 | 1.0 | 1000 | $1,500 | $1.50 | 3d | 1 | 0.87mi |
| 901 Castaic Ave Bakersfield, CA | 2.0 | 1.0 | 1076 | $1,700 | $1.58 | 3d | 1 | 0.97mi |
| 611 Wilson Ave Unit B Bakersfield, CA | 2.0 | 1.0 | 750 | $1,195 | $1.59 | 44d | 1 | 0.99mi |
| 214 Beardsley Ave Unit 12 Bakersfield, CA | 2.0 | 2.0 | 655 | $1,095 | $1.67 | 3d | 1 | 1.04mi |
| 222 Moneta Ave Unit 222 Bakersfield, CA | 3.0 | 2.0 | 1040 | $1,700 | $1.63 | 3d | 1 | 1.05mi |
| 419 Washington Ave Unit 417 Bakersfield, CA | 3.0 | 2.0 | 975 | $1,500 | $1.54 | 3d | 1 | 1.06mi |
| 222 Harding Ave Unit B Bakersfield, CA | 3.0 | 2.0 | 1100 | $1,750 | $1.59 | 3d | 1 | 1.10mi |
| 3333 El Encanto Ct Bakersfield, CA | 2.0 | 1.5 | 990 | $1,495 | $1.51 | 3d | 1 | 1.13mi |
| 3333 El Encanto Ct Bakersfield, CA | 2.0 | 2.0 | 990 | $1,595 | $1.61 | 14d | 1 | 1.13mi |
| 1405 Yosemite Dr Unit 1405 Bakersfield, CA | 2.0 | 1.0 | 712 | $1,100 | $1.54 | 44d | 1 | 1.15mi |
| 1951 Golden State Ave Bakersfield, CA | 1.0–3.0 | 1.0–2.5 | 1017 | $1,695 | $1.67 | 3d | 2 | 1.25mi |
| 5451 Norris Rd Bakersfield, CA | 2.0 | 1.0 | 570 | $1,158 | $2.03 | 3d | 1 | 1.47mi |
| 1905 McCray St Bakersfield, CA | 2.0 | 1.0 | 736 | $1,450 | $1.97 | 3d | 1 | 1.47mi |
Listing history 12 events
-
2026-06-18days on market $84,999 Active 16 DOM
-
2026-06-17days on market $84,999 Active 15 DOM
-
2026-06-16days on market $84,999 Active 14 DOM
-
2026-06-15days on market $84,999 Active 13 DOM
-
2026-06-14days on market $84,999 Active 11 DOM
-
2026-06-10days on market $84,999 Active 8 DOM
-
2026-06-09days on market $84,999 Active 7 DOM
-
2026-06-08days on market $84,999 Active 6 DOM
-
2026-06-07days on market $84,999 Active 5 DOM
-
2026-06-05days on market $84,999 Active 2 DOM
-
2026-06-03remarks 359-char remark
-
2026-06-03$84,999 Active 1 DOM
ⓘ Source: listings_history table (triggers on properties + properties_extension) + one-shot
backfill from property_details.listing_events for pre-trigger history.
Climate risk First Street
- Flood 1/10 Low FEMA zone X (unshaded) · 0% chance over 30 yrs
- Wildfire 1/10 Low
- Heat 8/10 Severe 7 d/yr ≥105°F today · 18 d/yr by 30 yrs out
- Wind 1/10 Low
- Air quality 10/10 Extreme 39 unhealthy d/yr today · 45 by 30 yrs out
Nearby sold comps map
Loading sold comps map…
Walkable amenities ~0.75 mi
Loading nearby amenities…
Taxation est. · year 1
- Rental income
- $17,596
- − Mortgage interest
- −$4,761
- − Property taxes
- −$1,275
- − Insurance
- −$425
- − Repairs & maintenance
- −$1,408
- − Management
- −$1,408
- − Depreciation
- −$2,473
- Taxable income
- $5,847
- Est. tax owed @ 24.0%
- −$1,403
- After-tax cash flow
- $5,449/yr
For passive investors: Depreciation is non-cash, so a rental often shows a tax loss while cash-flowing — sheltering income. Rental losses are passive: they offset passive income freely, and up to $25,000/yr can offset ordinary (W-2) income if you actively participate and your MAGI is under $100k (phasing out to $0 by $150k); unused losses carry forward. On sale, claimed depreciation is recaptured at up to 25%, and gains may owe capital-gains tax (a 1031 exchange can defer both). Figures are a year-1 estimate at your 24.0% rate — not tax advice; consult a CPA.
Condition & rehab AI · 12 photos
This beautifully updated mobile home in Bakersfield, CA is in good condition with minimal repairs needed. It offers a spacious layout with 3 bedrooms and 2 full bathrooms, perfect for families or those seeking extra space. The home's curb appeal and clean exterior make it an attractive option for both resale and rental.
Value-add opportunities
- Resale Paint exterior siding — Painting the exterior siding can enhance the home's curb appeal and increase its resale value.
- Rental Clean gutters — Clean gutters can prevent water damage and improve the home's rental value by reducing maintenance costs for potential tenants.
Renovation cost estimate screening
Value-add ROI direction
- Resale Paint exterior siding — Painting the exterior siding can enhance the home's curb appeal and increase its resale value. ↑
- Rental Clean gutters — Clean gutters can prevent water damage and improve the home's rental value by reducing maintenance costs for potential tenants. ↑
ⓘ Cost ranges are severity-bucket heuristics (US national rule-of-thumb). Get contractor quotes + a written scope before underwriting a rehab budget.
Schools (NCES district)
- District
- Beardsley Elementary
- NCES district ID
- 0604260
- Math proficiency
- 7% ▼ -12.00%
- Reading proficiency
- 18% ▼ -16.00%
- Median HH income
- $28,808
- Composite
- 9.63/100
- National rank
- #9841
- State rank
- #501 of 517 in CA
Livability — Oildale
- Score
- 58/100
- State rank
- #680
- US rank
- #20848
Category grades
Schools grade is shown separately in the Schools card above.
Census & demographics
- Census place
- Oildale, CA
- County
- Kern County · 710,371 people
- Metro
- Bakersfield, CA
- Population (ZIP)
- 55,078
- Household income
- $62,445
- Rent vs Own
- Severe rent burden
- 2931.0
Population outlook (Kern County) Hauer SSP2
- Today (2025)
- 947,286 people
- By 2030
- 978,984 · +3.3%
- By 2040
- 1,045,018 · +10.3%
- By 2050
- 1,105,232 · +16.7%
- By 2075
- 1,229,538 · +29.8%
- By 2100
- 1,238,059 · +30.7%
Race, ethnicity, and origin ACS 2023
- Neighborhood character
- Diverse neighborhood (Simpson 0.57)
- Race & ethnicity
- White 57% Hispanic / Latino 32% Two or more races 15% Black 3% Asian 3% Native American 1%
- Hispanic origin (detail)
- Mexican 26%
- Common ancestry
- Slovak 3% Italian 1% Romanian 1%
- Foreign-born
- 8% · Canada, Vietnam
- Languages at home
- 80% English-only · Spanish 17%
Political lean MEDSL · Kern
- 2024 margin
- Strong R (+21.1) · D 38.2% · R 59.3% · Other 2.5%
- 2008→2024 swing
- -3.3pp toward R · 2008: -17.8pp · 2024: -21.1pp
- All cycles
- 2024: R+21.1 2020: R+10.2 2016: R+15.0 2012: R+20.9 2008: R+17.8
Not yet ingested
- Civics
- —
Market trends
- HPI YoY
- ▼ -4.52%
- Current HPI
- 825.65
- Rent YoY
- ▲ 2.22%
- Metro
- Bakersfield, CA
- State GDP YoY
- ▲ 3.21%
- F500 in state
- 116
Industry mix (Fortune 500 HQ in CA)
| Industry | F500 HQs | Revenue |
|---|---|---|
| Technology | 27 | $1,492B |
|
||
| Financial Services | 3 | $174B |
|
||
| Retail | 3 | $44B |
|
||
| Insurance | 3 | $26B |
|
||
| Media / Entertainment | 2 | $115B |
|
||
| Pharmaceuticals / Biotech | 2 | $62B |
|
||
Price history
1 event — show timeline
- 2026-06-02 Listed $84,999 CRMLS
Cash-flow waterfall
monthlySold comps — $/sqft
last 12 mo · ≤1 miLoading sold comps…