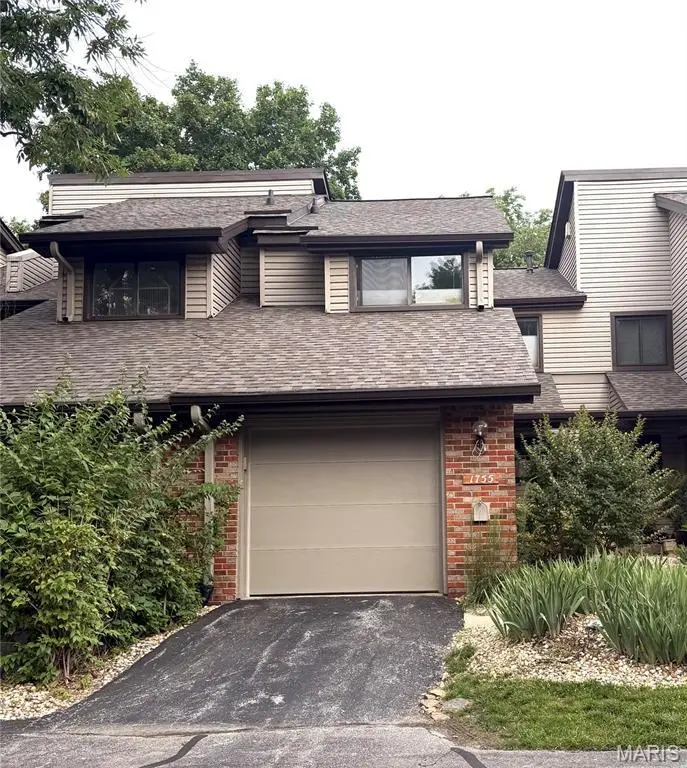
1755 Robin Knoll Ct · Maryland Heights, MO
Flood risk 6/10 · Moderate
- FEMA flood zone
- X (unshaded)
- Chance of flooding over 30 yrs
- 0.71%
- Est. flood insurance / yr
- $473 – $860
Fire risk 1/10 · Minimal
- Est. fire insurance / yr
- $1,054 – $1,958
Heat risk 5/10 · Moderate
- Hot days now (above 107°F)
- 7 days/yr
- Hot days in 30 yrs
- 21 days/yr
Wind risk 2/10 · Minimal
- Chance of severe wind over 30 yrs
- 1.0%
Air-quality risk 2/10 · Minimal
- Unhealthy air days now
- 1 days/yr
- Unhealthy air days in 30 yrs
- 3 days/yr
Risk factors via First Street. Map © Google.
Why this score? — see what drove the D grade
The composite is a weighted blend of 9 inputs, each scored 0–100. Each bar is that input's sub-score; the figure is the points it added to the 100-point composite (weight × sub-score).
- Appreciation +10.0/10.0
- ARV discount +7.5/15.0
- Cash flow +7.1/30.0
- 1% rule +4.0/10.0
- Livability +3.6/5.0
- Schools +3.4/10.0
- Condition / age +2.5/5.0
- Rent growth +1.8/5.0
- DSCR +1.2/10.0
$230,000
🖨 Deal sheet 📄 Offer letter ✓ Due diligence
Listing remarks
Welcome home to this inviting 2 bed, 2 bath condo offering the perfect blend of comfort, convenience, and lifestyle! Tucked against a peaceful wooded backdrop, this charming condo features a private fenced courtyard perfect for relaxing or entertaining. Inside, the cozy living room with gas fireplace flows seamlessly into the dining area, creating a warm and welcoming space to gather. The bright white kitchen has plenty of cabinet space and is accented by rich granite countertops. Upstairs you will find the spacious primary suite featuring a walk-in closet, while the second bedroom is conveniently located across the hall near a shared full bath and loft area, ideal for a home office, readin
Key facts
- $489 HOA
- Garage
- Community pool
Property features AI
Finance
- Other: Living area: 2,004 (per public records) with finished space above and below grade; Above-grade finished area uses public records; Below-grade finished area uses public records; Property type: Residential condominium; Association amenities include clubhouse, pool and tennis courts
- HOA & community: HOA: Westport Crossings; Monthly association fee ($489) covering clubhouse, grounds maintenance, parking/road maintenance, common area maintenance, pool maintenance and pool, recreational facilities, sewer, trash and water
Exterior
- Parking: Attached garage (1 car total parking, 1 garage space)
- Utilities: Public water; Public sewer; Electric service by Ameren; Cable available
- Home design: Attached condominium; Two levels
- Construction: Brick and vinyl siding exterior; Shingle roof; Concrete perimeter foundation; Basement: full, partially finished, concrete pour, 8 ft+ ceiling
- Exterior features: Level lot; Back yard fencing with gate; Sliding door(s); Patio; Community pool; Clubhouse; Tennis courts
Interior
- Kitchen: Cooktop (electric); Free‑standing electric oven; Dishwasher; Disposal; Microwave; Refrigerator
- Bedrooms: 2 bedrooms (both located on the upper level); Loft; Recreation room (lower level)
- Flooring: Carpet; Wood
- Bathrooms: 1 full bath; 1 half bath
- Heating & cooling: Forced air heating; Central air conditioning; Ceiling fans
- Interior features: Ceiling fans; Storage; Wi-Fi
- Laundry & utility: Washer and dryer included; Laundry located in basement; Water softener
Neighborhood map
What this means for you Summary
Snapshot
- This is a 3-bed/2.5-bath condo listed at $230k.
Deal economics
- At list price, monthly cash flow is $-332 ($-4k/yr) — negative.
- To cash-flow at today's rent, offer at most $171k (25.5% below list).
- To meet the 1% rule (rent ≥ 1% of price), the offer needs to be $207k (9.8% below list).
- Recommended offer: $171k (25.5% below list) — sets the bar for cash-flow.
Location & tenants
- Location reads 71/100 on livability (#101 in MO) — a middle-class / working-renter tenant base. Strengths: cost of living A+, housing A+, crime A-; Watch: health & safety C-, amenities F, commute F.
- Pattonville R-III (suburban): math 32% / reading 46% proficiency, ranked #147 of 324 in MO (top 45%) — families likely to look elsewhere, expect single-tenant / working-renter base with shorter leases.
- Zoned schools: Willow Brook Elem. (math 42% / reading 47%, grade F, #413 of 1,115 statewide, top 42%, 470 students, 40% FRL); Pattonville Sr. High (math 33% / reading 64%, grade D, #147 of 521 statewide, top 29%, 1,893 students, 39% FRL) — zoned schools at 40% FRL track the district average.
- Market conditions: Rents soft (-3.0%/yr); 170 active listings in the ZIP; 11 comparable units currently listed for rent nearby; rentals leasing fast (median 4d on market — plan ~1-2 weeks tenant-placement turnaround); solid renter incomes; 920 units permitted in St. Louis County in 2024 (250 in 5+ unit buildings).
Forward outlook
- In year one you build about $25k of equity ($2k loan paydown + $23k appreciation (10.0% local appreciation)).
- By year 2, paydown + projected appreciation supports a ~$40k cash-out refi (75% LTV) — recoverable capital for the next deal without selling this one.
Negotiation context
- Only 14 days on market — expect competitive offers; lowballing is unlikely to land.
- Current owner paid $151k; list at $230k implies a 52% gain — meaningful room to come down on a strong offer.
Risks & watch-outs
- Watch-outs: HOA is 24% of rent.
- Climate carrying-cost: major flood risk; extreme-heat days projected 7→21/yr by 2055 (HVAC capex compounding) — expect insurance premiums to compound above CPI over the hold.
Questions for the listing agent
- What do current leases actually rent for vs. the listed asking? Can we see a recent rent roll and the last 12 months of T-12 income?
- What does the HOA fee cover, when was the last increase, and are there any pending special assessments or reserve-fund shortfalls?
- Any open or pending special assessments — roof, HVAC, plumbing, elevator, façade? What's the per-unit balance and payoff schedule, and is the seller paying it off at close or rolling it to the buyer?
- Is there a deadline driving the sale (1031 exchange, divorce, estate, relocation)? That informs how much negotiation room exists.
- Schools are B-rated — typically a magnet for longer-tenancy family renters. What's the average tenant stay here, and is there a school-zone premium baked into asking?
- The area grade is low — what's the realistic commute time and amenity access for the typical tenant pool here? Any planned neighborhood developments (good or bad) we should know about?
- What's the average days-on-market for RENTAL listings here right now (not sales)? A rising rental-DOM trend means longer vacancies and softer asking-rent achievability than the comps imply.
- What's the recent tenant-quality profile in this submarket — average credit score on applications, eviction rate, late-payment / NSF rate, and stable-employment percentage? A property-management company in the area should have these aggregated.
- How much new apartment / multifamily construction is in the pipeline within 1–3 miles? Heavy new supply (>2% of stock underway) typically softens rents 12–24 months out; light construction supports rent growth.
Investment metrics
- 1% rule
- 0.90% ✗
- Cap rate
- 4.56%
- Cash-on-cash
- -6.19%
- DSCR
- 0.72
- GRM
- 9.2
CMA / ARV
No comps found within radius.
Projected returns pro-forma
10.0% appreciation · 0.0% rent growth · sell at horizon
- IRR
- 18.9%
- Equity multiple
- 2.53×
- Total profit
- $98,302
- Equity at exit
- $207,202
- IRR
- 16.8%
- Equity multiple
- 5.59×
- Total profit
- $295,762
- Equity at exit
- $446,839
Cash invested: $64,400 (down + closing). Projections, not guarantees.
Landlord ↔ Tenant lean methodology
- Overall (STATE)
- 81 Strongly Landlord-Friendly
- State Missouri
- 81 Strongly Landlord-Friendly · R+10
- County
- — inherits STATE
- City
- — inherits STATE
ZIP-level market 63146
- Home prices YoY
- 4.9%
- Rents YoY
- -3.0%
- Active inventory
- 170
- Price-to-rent
- 9.2×
Monthly cashflow live
- Estimated rent
- $2,074 high interval (Pro) →
- Mortgage (P&I)
- −$1,206
- Tax from tax record
- −$179 /mo · $2,150/yr
- Insurance
- −$96
- HOA
- −$489
- Vacancy / Maint / Mgmt
- −$435
- Net cashflow
- $-332
Break-even live
UW: 25.0% down · 7.5% · 30yr · 1.5% tax · 5.0% vac · 8.0% maint · 8.0% mgmt
Financing live
Cash to close
- Down payment
- $57,500
- Closing costs
- $6,900
- Reserves months
- —
- Total cash needed
- —
Loan-product check · same deal, 3 products live
Conventional
25% down · 7.5% · 30yr
- Down + closing
- —
- Monthly P&I
- —
- Monthly cashflow
- —
- DSCR
- —
- Eligible?
- —
Personal DTI + credit; lowest rate.
DSCR
20% down · 8.5% · 30yr
- Down + closing
- —
- Monthly P&I
- —
- Monthly cashflow
- —
- DSCR
- —
- Eligible?
- —
No personal income docs; deal must DSCR.
Hard money
10% down · 12.0% · 12mo
- Down + closing
- —
- Monthly P&I
- —
- Monthly cashflow
- —
- DSCR
- —
- Eligible?
- —
Short-term bridge; refi at stabilization.
Rent comps 11 comps
| Address | Beds | Baths | Sqft | Rent | $/sqft | DOM | Units | Dist |
|---|---|---|---|---|---|---|---|---|
| 11752 Russet Meadow Dr Saint Louis, MO | 3.0 | 2.5 | 1578 | $2,000 | $1.27 | 3d | 1 | 0.09mi |
| 11864 Featherwood Dr Saint Louis, MO | 3.0 | 3.0 | 1460 | $2,600 | $1.78 | 1d | 1 | 0.44mi |
| 1638 Prestonpark Ln Saint Louis, MO | 3.0 | 2.5 | 1734 | $2,610 | $1.51 | 43d | 1 | 0.95mi |
| 1380 Willow Brook Cove Ct St. Louis, MO | 2.0 | 1.5 | 910 | $1,550 | $1.70 | 14d | 1 | 1.10mi |
| 11164 De Malle Dr Saint Louis, MO | 3.0 | 2.5 | 1146 | $2,475 | $2.16 | 11d | 1 | 1.11mi |
| 12401 Boulder Springs Pkwy St. Louis, MO | 1.0–3.0 | 1.0–2.0 | 1006 | $2,867 | $2.85 | 1d | 10 | 1.14mi |
| 1434 Willow Brook Cove Ct St. Louis, MO | 2.0 | 1.5 | 910 | $1,395 | $1.53 | 43d | 1 | 1.15mi |
| 1895 Boulder Springs Dr St. Louis, MO | 1.0–3.0 | 1.0–2.5 | 1083 | $2,900 | $2.68 | 1d | 6 | 1.22mi |
| 10900 Oak Forest Pkwy Dr St. Louis, MO | 1.0–2.0 | 1.0 | 800 | $1,600 | $2.00 | 3d | 6 | 1.24mi |
| 1145 Mackinac Dr Saint Louis, MO | 4.0 | 2.5 | 1588 | $2,490 | $1.57 | 1d | 1 | 1.34mi |
| 1432 Glenmeade Dr Maryland Heights, MO | 3.0 | 2.0 | 1090 | $2,176 | $2.00 | 10d | 1 | 1.40mi |
HOA detail condo
- Monthly dues
- $489 · $5,868/yr
- Likely covers
- gas
- Assessments
- None detected in remarks — confirm with the listing agent.
Listing history 12 events
-
2026-06-18days on market $230,000 Active 14 DOM
-
2026-06-17days on market $230,000 Active 13 DOM
-
2026-06-16days on market $230,000 Active 12 DOM
-
2026-06-15days on market $230,000 Active 11 DOM
-
2026-06-13days on market $230,000 Active 9 DOM
-
2026-06-13days on market $230,000 Active 8 DOM
-
2026-06-09days on market $230,000 Active 5 DOM
-
2026-06-08days on market $230,000 Active 4 DOM
-
2026-06-07statusdays on market $230,000 Active 3 DOM
-
2026-06-03days on market $230,000 Coming Soon 2 DOM
-
2026-06-02remarks 699-char remark
-
2026-06-02$230,000 Coming Soon 1 DOM
ⓘ Source: listings_history table (triggers on properties + properties_extension) + one-shot
backfill from property_details.listing_events for pre-trigger history.
Tax reassessment forecast MO · Resets to sale price
- Current annual tax
- $2,150 · $179/mo
- Projected year-2 tax
- $2,231 · $186/mo
- Expected delta
- +$81/yr (+$7/mo · 3.8%)
ⓘ Screening estimate from a state-policy table — verify with the county assessor before closing.
Climate risk First Street
- Flood 6/10 Major FEMA zone X (unshaded) · 71% chance over 30 yrs
- Wildfire 1/10 Low
- Heat 5/10 Major 7 d/yr ≥107°F today · 21 d/yr by 30 yrs out
- Wind 2/10 Low 100% chance of damaging wind over 30 yrs
- Air quality 2/10 Low 1 unhealthy d/yr today · 3 by 30 yrs out
Nearby sold comps map
Loading sold comps map…
Walkable amenities ~0.75 mi
Loading nearby amenities…
Taxation est. · year 1
- Rental income
- $24,882
- − Mortgage interest
- −$12,884
- − Property taxes
- −$2,150
- − Insurance
- −$1,150
- − Repairs & maintenance
- −$1,991
- − Management
- −$1,991
- − HOA
- −$5,868
- − Depreciation
- −$6,691
- Taxable loss
- −$7,842
- Est. tax savings @ 24.0%
- +$1,882
- After-tax cash flow
- $-2,103/yr
For passive investors: Depreciation is non-cash, so a rental often shows a tax loss while cash-flowing — sheltering income. Rental losses are passive: they offset passive income freely, and up to $25,000/yr can offset ordinary (W-2) income if you actively participate and your MAGI is under $100k (phasing out to $0 by $150k); unused losses carry forward. On sale, claimed depreciation is recaptured at up to 25%, and gains may owe capital-gains tax (a 1031 exchange can defer both). Figures are a year-1 estimate at your 24.0% rate — not tax advice; consult a CPA.
Schools (NCES district)
- District
- Pattonville R-III
- NCES district ID
- 2923700
- Math proficiency
- 32% ▼ -11.00%
- Reading proficiency
- 46% ▼ -5.00%
- Median HH income
- $50,786
- Composite
- 33.69/100
- National rank
- #5383
- State rank
- #147 of 324 in MO
Livability — Maryland Heights
- Score
- 71/100
- State rank
- #101
- US rank
- #6808
Category grades
Schools grade is shown separately in the Schools card above.
Census & demographics
- County
- Saint Louis County · 888,823 people
- City population
- 21,924
- Metro
- St. Louis, MO-IL
- Population (ZIP)
- 30,678
- Household income
- $84,756
- Rent vs Own
- Severe rent burden
- 1156.0
Population outlook (St. Louis County) Hauer SSP2
- Today (2025)
- 1,025,227 people
- By 2030
- 1,028,023 · +0.3%
- By 2040
- 1,020,940 · -0.4%
- By 2050
- 1,007,280 · -1.8%
- By 2075
- 987,277 · -3.7%
- By 2100
- 921,984 · -10.1%
Race, ethnicity, and origin ACS 2023
- Neighborhood character
- Diverse neighborhood (Simpson 0.56)
- Race & ethnicity
- White 63% Asian 17% Black 13% Two or more races 4% Hispanic / Latino 3%
- Common ancestry
- Scotch-Irish 3% Romanian 3% Italian 2%
- Foreign-born
- 19% · China, South Korea, Canada
- Languages at home
- 79% English-only · Other Asian/Pacific 7% Other Indo-European 4% Chinese 3%
Political lean MEDSL · St. Louis
- 2024 margin
- Strong D (+23.4) · D 60.8% · R 37.4% · Other 1.7%
- 2008→2024 swing
- +3.5pp toward D · 2008: 19.9pp · 2024: 23.4pp
- All cycles
- 2024: D+23.4 2020: D+24.0 2016: D+16.2 2012: D+13.7 2008: D+19.9
Not yet ingested
- Civics
- —
Market trends
- HPI YoY
- ▲ 33.10%
- Current HPI
- 711.49
- Rent YoY
- ▼ -2.96%
- Metro
- St. Louis, MO-IL
- State GDP YoY
- ▲ 1.84%
- F500 in state
- 20
Industry mix (Fortune 500 HQ in MO)
| Industry | F500 HQs | Revenue |
|---|---|---|
| Healthcare | 1 | $163B |
|
||
| Insurance | 1 | $21B |
|
||
| Industrial Technology | 1 | $17B |
|
||
| Retail | 1 | $16B |
|
||
| Industrial Distribution | 1 | $10B |
|
||
| Utilities | 1 | $9B |
|
||
Price history
+180.5% since first listed8 events — show timeline
- 2026-06-02 Coming Soon $230,000 MARIS as Distributed by MLS Grid
- 2007-04-05 Sold (Public Records) $151,000 Public Records
- 2004-09-30 Sold (Public Records) $154,900 Public Records
- 2001-09-27 Sold (Public Records) $126,500 Public Records
- 1993-08-25 Sold (Public Records) $79,100 Public Records
- 1990-01-01 Sold (Public Records) — Public Records
- 1990-01-01 Sold (Public Records) $81,140 Public Records
- 1982-03-01 Sold (Public Records) $81,990 Public Records
Property tax history
+2.4%/yrLatest (2022): $2,150 · +0.5% YoY. Source: county tax records.
Cash-flow waterfall
monthlySold comps — $/sqft
last 12 mo · ≤1 miLoading sold comps…