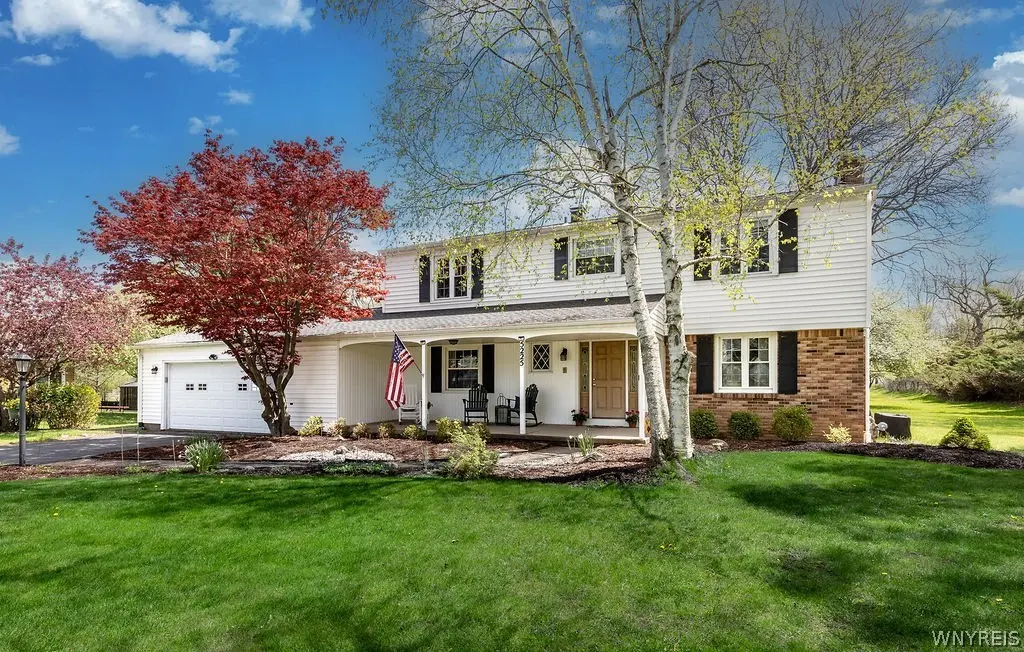
5225 Brookfield Ln · Harris Hill, NY
Flood risk 4/10 · Minor
- FEMA flood zone
- X (unshaded)
- Chance of flooding over 30 yrs
- 0.2%
- Est. flood insurance / yr
- $473 – $860
Fire risk 1/10 · Minimal
- Est. fire insurance / yr
- $691 – $1,283
Heat risk 2/10 · Minimal
- Hot days now (above 94°F)
- 7 days/yr
- Hot days in 30 yrs
- 15 days/yr
Wind risk 1/10 · Minimal
- Chance of severe wind over 30 yrs
- —
Air-quality risk 2/10 · Minimal
- Unhealthy air days now
- 2 days/yr
- Unhealthy air days in 30 yrs
- 2 days/yr
Risk factors via First Street. Map © Google.
Why this score? — see what drove the C- grade
The composite is a weighted blend of 9 inputs, each scored 0–100. Each bar is that input's sub-score; the figure is the points it added to the 100-point composite (weight × sub-score).
- ARV discount +15.0/15.0
- Cash flow +14.7/30.0
- Schools +6.5/10.0
- DSCR +4.5/10.0
- 1% rule +3.8/10.0
- Livability +3.6/5.0
- Rent growth +2.5/5.0
- Condition / age +2.5/5.0
- Appreciation +0.0/10.0
$474,900
🖨 Deal sheet 📄 Offer letter ✓ Due diligence
Listing remarks
Carefully maintained and beautifully spacious, this center-entrance Colonial is tucked away on a quiet Clarence street just moments from the Clarence Bike Path, Brookfield Country Club and many amenities. A welcoming front porch invites you to relax and enjoy peaceful summer evenings. Inside, the large living room is anchored by a gas fireplace framed with new custom built-in bookcases, creating a warm and inviting focal point. Coffered ceilings add timeless character and continue seamlessly into the adjoining dining room. The sunroom overlooks the deep backyard and fills the home with natural light, offering flexible space for both dining and everyday living. With its own heat source, it s
Key facts
- Coffered ceilings
- Gas fireplace
- Sunroom
Tags
Property features AI
Exterior
- Parking: Attached garage with door opener; Approximately 2.5 garage spaces
- Utilities: Electricity connected (circuit breakers); Water available / public water (note: also listed as not connected); Septic tank
- Home design: Two-story house; Existing structure; City street frontage; Rectangular residential lot (approx. 0.82 acre, dimensions 125 x 284)
- Construction: Brick and vinyl siding exterior; Asphalt roof; Block foundation; Copper plumbing
- Exterior features: Blacktop driveway; Open patio; Porch; Shed(s) and storage
Interior
- Kitchen: Dishwasher; Gas cooktop; Gas oven; Gas range; Microwave; Refrigerator
- Bedrooms: Bedroom (one located on the main level)
- Flooring: Carpet; Hardwood; Laminate; Tile; Varied flooring
- Bathrooms: Three full bathrooms; One main-level bathroom
- Heating & cooling: Central air conditioning; Electric forced-air heating
- Interior features: Ceiling fans; Entrance foyer; Eat-in kitchen; Separate/formal living room; Home office; Kitchen island; Pantry; Quartz countertops; Sliding glass doors; Skylights; Accessible bedroom; Low cabinetry; Low-threshold shower; Bedroom on main level; Primary bedroom with bath
- Laundry & utility: Laundry located in the basement; Gas water heater; Water softener (owned)
Neighborhood map
What this means for you Summary
Snapshot
- This is a 4-bed/2.0-bath single-family listed at $475k.
Deal economics
- At list price, monthly cash flow is $119 ($1k/yr) — positive.
- The deal already cash-flows at list — no discount required.
- To meet the 1% rule (rent ≥ 1% of price), the offer needs to be $420k (11.6% below list).
- Recommended offer: $420k (11.6% below list) — sets the bar for 1% rule.
- Cap rate 6.6% vs local median 2.6% in Harris Hill — top-decile yield for the area; either an underpriced asset or a hidden risk that comps aren't pricing in. Stress-test before assuming the spread holds.
Location & tenants
- Location reads 72/100 on livability (#345 in NY) — a middle-class / working-renter tenant base. Strengths: employment A+, housing A+, health & safety A-; Watch: amenities F, commute F, cost of living F.
- Clarence Central School District (suburban): math 70% / reading 76% proficiency, ranked #94 of 590 in NY (top 16%) — strong family-tenant draw, lease renewals of 3-5y typical; only 7% free/reduced lunch — higher-income household profile.
- Market conditions: 77 active listings in the ZIP; 1 comparable units currently listed for rent nearby; 1,244 units permitted in Erie County in 2024 (563 in 5+ unit buildings).
Forward outlook
- Local home prices are declining (-3.0%/yr); year-one equity from $3k of loan paydown is wiped out by about $14k of value loss. Plan a longer hold.
Negotiation context
- Only 10 days on market — expect competitive offers; lowballing is unlikely to land.
- Current owner paid $194k; list at $475k implies a 145% gain — meaningful room to come down on a strong offer.
Questions for the listing agent
- Built in 1964 — when were the roof, HVAC, electrical panel, plumbing, and water heater last replaced?
- Is there a deadline driving the sale (1031 exchange, divorce, estate, relocation)? That informs how much negotiation room exists.
- Schools are B-rated — typically a magnet for longer-tenancy family renters. What's the average tenant stay here, and is there a school-zone premium baked into asking?
- What's the average days-on-market for RENTAL listings here right now (not sales)? A rising rental-DOM trend means longer vacancies and softer asking-rent achievability than the comps imply.
- What's the recent tenant-quality profile in this submarket — average credit score on applications, eviction rate, late-payment / NSF rate, and stable-employment percentage? A property-management company in the area should have these aggregated.
- How much new for-sale + rental construction is in the pipeline within 1–3 miles? Heavy new supply typically softens prices + rents 12–24 months out; constrained supply supports both.
Investment metrics
- 1% rule
- 0.88% ✗
- Cap rate
- 6.59%
- Cash-on-cash
- 1.08%
- DSCR
- 1.05
- GRM
- 9.4
CMA / ARV
- ARV (median comp)
- $624,291
- List price
- $474,900
- Delta
- -23.93%
- Verdict
- UNDERPRICED
- Comps
- 20 within 1.0 mi
Show comp detail 12 sales within ~0.75 mi
| Address | Dist | Beds/Ba | Sqft | Sold | Price | $/sf | Match |
|---|---|---|---|---|---|---|---|
| 5327 Briannas Nook | 0.30mi | 4/2.5 | 2,277 (-4%) | 3mo | $630,000 | $277 | 74 |
| 8918 Hurlburt Ln | 0.22mi | 5/2.5 (+1) | 2,417 (+2%) | 10mo | $515,000 | $213 | 71 |
| 5390 Briannas Nook | 0.44mi | 4/2.5 | 2,335 (-2%) | 7mo | $670,000 | $287 | 69 |
| 5286 Thompson Rd | 0.53mi | 4/2.5 | 2,497 (+5%) | 6mo | $400,000 | $160 | 60 |
| 5354 Thompson Rd | 0.56mi | 4/2.0 | 2,525 (+6%) | 8mo | $575,000 | $228 | 57 |
| 4900 Cliffside Dr W | 0.59mi | 4/2.0 | 2,504 (+5%) | 8mo | $440,000 | $176 | 56 |
| 5336 Briannas Nook | 0.29mi | 4/2.5 | 2,067 (-13%) | 9mo | $590,000 | $285 | 55 |
| 5085 Meadowbrook Rd | 0.67mi | 3/2.5 (-1) | 2,416 (+2%) | 7mo | $656,000 | $272 | 53 |
| 5000 Brookfield Ln | 0.32mi | 5/3.0 (+1) | 2,626 (+10%) | 11mo | $420,000 | $160 | 49 |
| 8961 The Fairways | 0.47mi | 4/1.5 | 2,103 (-12%) | 10mo | $425,000 | $202 | 48 |
| 9005 Cliffside Dr | 0.60mi | 4/3.0 | 2,556 (+8%) | 12mo | $585,000 | $229 | 45 |
| 4857 Shimerville Rd | 0.63mi | 4/2.5 | 2,672 (+12%) | 12mo | $504,000 | $189 | 38 |
Match score weights: distance 35% · size 25% · config 20% · recency 20%. Top-matched comps best support the ARV.
Projected returns pro-forma
-3.0% appreciation · 3.0% rent growth · sell at horizon
- IRR
- -14.6%
- Equity multiple
- 0.48×
- Total profit
- $-69,348
- Equity at exit
- $70,809
- IRR
- -5.9%
- Equity multiple
- 0.62×
- Total profit
- $-50,558
- Equity at exit
- $41,061
Cash invested: $132,972 (down + closing). Projections, not guarantees.
Landlord ↔ Tenant lean methodology
- Overall (STATE)
- 15 Strongly Tenant-Friendly
- State New York
- 15 Strongly Tenant-Friendly · D+10
- County
- — inherits STATE
- City
- — inherits STATE
ZIP-level market 14031
- Home prices YoY
- -16.4%
- Active inventory
- 77
- Price-to-rent
- 9.4×
Monthly cashflow live
- Estimated rent
- $4,200 medium interval (Pro) →
- Mortgage (P&I)
- −$2,490
- Tax from tax record
- −$510 /mo · $6,126/yr
- Insurance
- −$198
- HOA
- −$0
- Vacancy / Maint / Mgmt
- −$882
- Net cashflow
- $119
Break-even live
UW: 25.0% down · 7.5% · 30yr · 1.5% tax · 5.0% vac · 8.0% maint · 8.0% mgmt
Financing live
Cash to close
- Down payment
- $118,725
- Closing costs
- $14,247
- Reserves months
- —
- Total cash needed
- —
Loan-product check · same deal, 3 products live
Conventional
25% down · 7.5% · 30yr
- Down + closing
- —
- Monthly P&I
- —
- Monthly cashflow
- —
- DSCR
- —
- Eligible?
- —
Personal DTI + credit; lowest rate.
DSCR
20% down · 8.5% · 30yr
- Down + closing
- —
- Monthly P&I
- —
- Monthly cashflow
- —
- DSCR
- —
- Eligible?
- —
No personal income docs; deal must DSCR.
Hard money
10% down · 12.0% · 12mo
- Down + closing
- —
- Monthly P&I
- —
- Monthly cashflow
- —
- DSCR
- —
- Eligible?
- —
Short-term bridge; refi at stabilization.
Rent comps 1 comps
| Address | Beds | Baths | Sqft | Rent | $/sqft | DOM | Units | Dist |
|---|---|---|---|---|---|---|---|---|
| 5558 Marthas Vineyard Clarence Center, NY | 4.0 | 2.5 | 2454 | $4,200 | $1.71 | 11d | 1 | 1.40mi |
Listing history 2 events
-
2026-05-11$474,900 Active 2046-char remark
-
2002-09-05soldstatus $194,000
ⓘ Source: listings_history table (triggers on properties + properties_extension) + one-shot
backfill from property_details.listing_events for pre-trigger history.
Tax reassessment forecast NY · Partial reset (capped growth)
- Current annual tax
- $6,126 · $510/mo
- Projected year-2 tax
- $7,076 · $590/mo
- Expected delta
- +$950/yr (+$79/mo · 15.5%)
ⓘ Screening estimate from a state-policy table — verify with the county assessor before closing.
Climate risk First Street
- Flood 4/10 Moderate FEMA zone X (unshaded) · 20% chance over 30 yrs
- Wildfire 1/10 Low
- Heat 2/10 Low 7 d/yr ≥94°F today · 15 d/yr by 30 yrs out
- Wind 1/10 Low
- Air quality 2/10 Low 2 unhealthy d/yr today · 2 by 30 yrs out
Nearby sold comps map
Loading sold comps map…
Walkable amenities ~0.75 mi
Loading nearby amenities…
Taxation est. · year 1
- Rental income
- $50,400
- − Mortgage interest
- −$26,602
- − Property taxes
- −$6,126
- − Insurance
- −$2,374
- − Repairs & maintenance
- −$4,032
- − Management
- −$4,032
- − Depreciation
- −$13,815
- Taxable loss
- −$6,581
- Est. tax savings @ 24.0%
- +$1,579
- After-tax cash flow
- $3,010/yr
For passive investors: Depreciation is non-cash, so a rental often shows a tax loss while cash-flowing — sheltering income. Rental losses are passive: they offset passive income freely, and up to $25,000/yr can offset ordinary (W-2) income if you actively participate and your MAGI is under $100k (phasing out to $0 by $150k); unused losses carry forward. On sale, claimed depreciation is recaptured at up to 25%, and gains may owe capital-gains tax (a 1031 exchange can defer both). Figures are a year-1 estimate at your 24.0% rate — not tax advice; consult a CPA.
Schools (NCES district)
- District
- Clarence Central School District
- NCES district ID
- 3607590
- Math proficiency
- 70% ▼ -9.00%
- Reading proficiency
- 76% ▲ 2.00%
- Median HH income
- $81,568
- Composite
- 64.85/100
- National rank
- #514
- State rank
- #94 of 590 in NY
Livability — Harris Hill
- Score
- 72/100
- State rank
- #345
- US rank
- #5816
Category grades
Schools grade is shown separately in the Schools card above.
Census & demographics
- Population (ZIP)
- 9,741
Population outlook (Erie County) Hauer SSP2
- Today (2025)
- 933,037 people
- By 2030
- 935,181 · +0.2%
- By 2040
- 928,531 · -0.5%
- By 2050
- 905,725 · -2.9%
- By 2075
- 834,037 · -10.6%
- By 2100
- 708,033 · -24.1%
Race, ethnicity, and origin ACS 2023
- Neighborhood character
- Predominantly White (88%)
- Race & ethnicity
- White 88% Two or more races 6% Hispanic / Latino 3%
- Common ancestry
- Romanian 13% Portuguese 2% Scotch-Irish 2%
- Foreign-born
- 7% · Canada
- Languages at home
- 96% English-only · Spanish 2% Russian/Polish/Slavic 1% Other Indo-European 1%
Political lean MEDSL · Erie
- 2024 margin
- Lean D (+9.7) · D 54.8% · R 45.2%
- 2008→2024 swing
- -7.9pp toward R · 2008: 17.5pp · 2024: 9.7pp
- All cycles
- 2024: D+9.7 2020: D+14.7 2016: D+4.8 2012: D+15.6 2008: D+17.5
Not yet ingested
- Civics
- —
Market trends
- HPI YoY
- ▼ -67.27%
- Current HPI
- 344.136
- Rent YoY
- —
- Metro
- —
- State GDP YoY
- ▲ 2.60%
- F500 in state
- 92
Industry mix (Fortune 500 HQ in NY)
| Industry | F500 HQs | Revenue |
|---|---|---|
| Financial Services | 10 | $950B |
|
||
| Consumer Goods | 9 | $162B |
|
||
| Insurance | 4 | $225B |
|
||
| Telecommunications | 2 | $144B |
|
||
| Pharmaceuticals | 2 | $112B |
|
||
| Media / Entertainment | 2 | $69B |
|
||
Price history
+144.8% since first listed3 events — show timeline
- 2026-05-21 Pending — WNYREIS
- 2026-05-11 Listed $474,900 WNYREIS
- 2002-09-05 Sold (Public Records) $194,000 Public Records
Property tax history
+1.9%/yrLatest (2025): $6,126 · -0.9% YoY. Source: county tax records.
Cash-flow waterfall
monthlySold comps — $/sqft
last 12 mo · ≤1 miLoading sold comps…