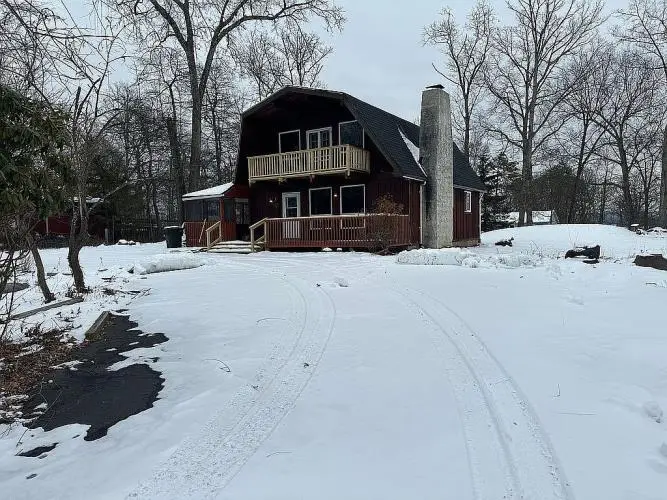
220 Saturn Dr · Saw Creek, PA
Flood risk 1/10 · Minimal
- FEMA flood zone
- X (unshaded)
- Chance of flooding over 30 yrs
- 0.0%
- Est. flood insurance / yr
- $473 – $860
Fire risk 4/10 · Minor
- Est. fire insurance / yr
- $511 – $949
Heat risk 3/10 · Minor
- Hot days now (above 97°F)
- 6 days/yr
- Hot days in 30 yrs
- 13 days/yr
Wind risk 4/10 · Minor
- Chance of severe wind over 30 yrs
- 11.0%
Air-quality risk 2/10 · Minimal
- Unhealthy air days now
- 1 days/yr
- Unhealthy air days in 30 yrs
- 2 days/yr
Risk factors via First Street. Map © Google.
Why this score? — see what drove the D+ grade
The composite is a weighted blend of 9 inputs, each scored 0–100. Each bar is that input's sub-score; the figure is the points it added to the 100-point composite (weight × sub-score).
- ARV discount +12.1/15.0
- Cash flow +11.9/30.0
- Appreciation +6.8/10.0
- DSCR +3.5/10.0
- 1% rule +3.3/10.0
- Schools +3.0/10.0
- Livability +3.0/5.0
- Rent growth +2.5/5.0
- Condition / age +2.5/5.0
$265,000
🖨 Deal sheet 📄 Offer letter ✓ Due diligence
Listing remarks MLS
This is a really neat older country cabin style home in a non dues community. The road is unpaved but the circular driveway is paved. The roof, kitchen, and septic system were new in 2020. New carpet just installed in all four bedrooms. There is a front porch, upstairs deck, and side screened in porch. There is also an attached utility shed. The crawlspace has a concrete floor and is accessible through the downstairs bedroom closet. There are lots of possibilities with this home.
Key facts
- Front porch
- Upstairs deck
- Circular driveway
Tags
Neighborhood map
What this means for you Summary
Snapshot
- This is a 3-bed/2.0-bath single-family listed at $265k.
Deal economics
- At list price, monthly cash flow is $-70 ($-841/yr) — negative.
- To cash-flow at today's rent, offer at most $253k (4.7% below list).
- To meet the 1% rule (rent ≥ 1% of price), the offer needs to be $220k (17.0% below list).
- Recommended offer: $220k (17.0% below list) — sets the bar for 1% rule.
- Cap rate 6.0% vs local median 4.3% in Saw Creek — top-decile yield for the area; either an underpriced asset or a hidden risk that comps aren't pricing in. Stress-test before assuming the spread holds.
Location & tenants
- Location reads 59/100 on livability (#1,538 in PA) — a working-class tenant base; expect higher turnover. Strengths: crime A+, cost of living A+, housing A+; Watch: employment C-, health & safety D, schools F.
- East Stroudsburg Area SD (rural): math 25% / reading 43% proficiency, ranked #413 of 539 in PA (top 77%) — families likely to look elsewhere, expect single-tenant / working-renter base with shorter leases.
- Market conditions: 290 active listings in the ZIP; 1 comparable units currently listed for rent nearby; 213 units permitted in Pike County in 2024 (0 in 5+ unit buildings).
Forward outlook
- In year one you build about $11k of equity ($2k loan paydown + $9k appreciation (3.5% local appreciation)).
- Pike County population projected at -25% by 2050 — secular population decline; favor cash flow + early exit over multi-decade hold.
- At projected returns (3.5% appreciation + 3.0% rent growth), your $74k cash investment doubles in ~6 years — after that, you're playing with house money.
- By year 4, paydown + projected appreciation supports a ~$38k cash-out refi (75% LTV) — recoverable capital for the next deal without selling this one.
Negotiation context
- It's been on market 163 days — a 12% lower offer ($233k) is reasonable based on typical stale-listing flexibility.
Risks & watch-outs
- Watch-outs: built in 1958 — expect roof / HVAC / electrical / plumbing capex.
Questions for the listing agent
- What do current leases actually rent for vs. the listed asking? Can we see a recent rent roll and the last 12 months of T-12 income?
- It's been on market 163 days. Have you received any prior offers? Is the seller open to a 17% concession, seller financing, or rate buy-down credit?
- Built in 1958 — when were the roof, HVAC, electrical panel, plumbing, and water heater last replaced?
- Why hasn't it sold? Are there any deal-killer items the seller is aware of (foundation, flood, title, zoning, code violations)?
- Is there a deadline driving the sale (1031 exchange, divorce, estate, relocation)? That informs how much negotiation room exists.
- Schools are F-rated, which usually means shorter tenancies and higher turnover. Who's the typical renter profile here, and what's been the actual vacancy rate?
- The area grade is low — what's the realistic commute time and amenity access for the typical tenant pool here? Any planned neighborhood developments (good or bad) we should know about?
- What's the average days-on-market for RENTAL listings here right now (not sales)? A rising rental-DOM trend means longer vacancies and softer asking-rent achievability than the comps imply.
- What's the recent tenant-quality profile in this submarket — average credit score on applications, eviction rate, late-payment / NSF rate, and stable-employment percentage? A property-management company in the area should have these aggregated.
- How much new for-sale + rental construction is in the pipeline within 1–3 miles? Heavy new supply typically softens prices + rents 12–24 months out; constrained supply supports both.
Investment metrics
- 1% rule
- 0.83% ✗
- Cap rate
- 5.98%
- Cash-on-cash
- -1.13%
- DSCR
- 0.95
- GRM
- 10.0
CMA / ARV
- ARV (median comp)
- $295,487
- List price
- $265,000
- Delta
- -10.32%
- Verdict
- UNDERPRICED
- Comps
- 20 within 1.0 mi
Show comp detail 8 sales within ~0.75 mi
| Address | Dist | Beds/Ba | Sqft | Sold | Price | $/sf | Match |
|---|---|---|---|---|---|---|---|
| 107 Minter Dr | 0.20mi | 4/2.0 (+1) | 1,592 (+2%) | 15mo | $355,000 | $223 | 71 |
| 3118 Long Ct | 0.20mi | 3/1.5 | 1,664 (+6%) | 17mo | $225,000 | $135 | 65 |
| 115 East Ct | 0.20mi | 3/2.0 | 1,450 (-8%) | 19mo | $329,900 | $228 | 63 |
| 244 Kirkham Rd | 0.59mi | 3/2.0 | 1,572 (+0%) | 12mo | $300,000 | $191 | 62 |
| 161 Dunchurch Dr | 0.38mi | 4/2.0 (+1) | 1,440 (-8%) | 7mo | $180,000 | $125 | 58 |
| 3326 Windermere Dr | 0.48mi | 3/1.5 | 1,665 (+6%) | 14mo | $185,000 | $111 | 53 |
| 3221 Windermere Dr | 0.56mi | 4/2.0 (+1) | 1,505 (-4%) | 11mo | $275,000 | $183 | 53 |
| 6116 Braintree Ct | 0.68mi | 2/2.0 (-1) | 1,658 (+6%) | 6mo | $255,000 | $154 | 49 |
Match score weights: distance 35% · size 25% · config 20% · recency 20%. Top-matched comps best support the ARV.
Projected returns pro-forma
3.51% appreciation · 3.0% rent growth · sell at horizon
- IRR
- 7.9%
- Equity multiple
- 1.47×
- Total profit
- $34,643
- Equity at exit
- $126,777
- IRR
- 10.3%
- Equity multiple
- 2.63×
- Total profit
- $120,961
- Equity at exit
- $201,524
Cash invested: $74,200 (down + closing). Projections, not guarantees.
Landlord ↔ Tenant lean methodology
- Overall (STATE)
- 62 Landlord-Friendly
- State Pennsylvania
- 62 Landlord-Friendly · EVEN
- County
- — inherits STATE
- City
- — inherits STATE
ZIP-level market 18324
- Home prices YoY
- 1.5%
- Active inventory
- 290
- Price-to-rent
- 10.0×
Monthly cashflow live
- Estimated rent
- $2,200 medium interval (Pro) →
- Mortgage (P&I)
- −$1,390
- Tax from tax record
- −$308 /mo · $3,696/yr
- Insurance
- −$110
- HOA
- −$0
- Vacancy / Maint / Mgmt
- −$462
- Net cashflow
- $-70
Break-even live
UW: 25.0% down · 7.5% · 30yr · 1.5% tax · 5.0% vac · 8.0% maint · 8.0% mgmt
Financing live
Cash to close
- Down payment
- $66,250
- Closing costs
- $7,950
- Reserves months
- —
- Total cash needed
- —
Loan-product check · same deal, 3 products live
Conventional
25% down · 7.5% · 30yr
- Down + closing
- —
- Monthly P&I
- —
- Monthly cashflow
- —
- DSCR
- —
- Eligible?
- —
Personal DTI + credit; lowest rate.
DSCR
20% down · 8.5% · 30yr
- Down + closing
- —
- Monthly P&I
- —
- Monthly cashflow
- —
- DSCR
- —
- Eligible?
- —
No personal income docs; deal must DSCR.
Hard money
10% down · 12.0% · 12mo
- Down + closing
- —
- Monthly P&I
- —
- Monthly cashflow
- —
- DSCR
- —
- Eligible?
- —
Short-term bridge; refi at stabilization.
Rent comps 1 comps
| Address | Beds | Baths | Sqft | Rent | $/sqft | DOM | Units | Dist |
|---|---|---|---|---|---|---|---|---|
| 272 Stafford Dr Bushkill, PA | 3.0 | 2.0 | 1218 | $2,200 | $1.81 | 1d | 1 | 1.11mi |
Listing history 19 events
-
2026-06-19days on market $265,000 Active 163 DOM
-
2026-06-18days on market $265,000 Active 162 DOM
-
2026-06-17days on market $265,000 Active 161 DOM
-
2026-06-16days on market $265,000 Active 160 DOM
-
2026-06-15days on market $265,000 Active 159 DOM
-
2026-06-14days on market $265,000 Active 157 DOM
-
2026-06-13days on market $265,000 Active 156 DOM
-
2026-06-10days on market $265,000 Active 154 DOM
-
2026-06-09days on market $265,000 Active 153 DOM
-
2026-06-08days on market $265,000 Active 152 DOM
-
2026-06-07days on market $265,000 Active 151 DOM
-
2026-06-05days on market $265,000 Active 148 DOM
-
2026-06-02days on market $265,000 Active 146 DOM
-
2026-06-01days on market $265,000 Active 145 DOM
-
2026-05-31days on market $265,000 Active 144 DOM
-
2026-05-30days on market $265,000 Active 143 DOM
-
2026-04-28soldstatus $250,000
-
2026-01-06$265,000 Active 486-char remark
Show marketing remark (486 chars)
This is a really neat older country cabin style home in a non dues community. The road is unpaved but the circular driveway is paved. The roof, kitchen, and septic system were new in 2020. New carpet just installed in all four bedrooms. There is a front porch, upstairs deck, and side screened in porch. There is also an attached utility shed. The crawlspace has a concrete floor and is accessible through the downstairs bedroom closet. There are lots of possibilities with this home.
-
2004-05-04soldstatus $91,000
ⓘ Source: listings_history table (triggers on properties + properties_extension) + one-shot
backfill from property_details.listing_events for pre-trigger history.
Tax reassessment forecast PA · Partial reset (capped growth)
- Current annual tax
- $3,696 · $308/mo
- Projected year-2 tax
- $3,941 · $328/mo
- Expected delta
- +$246/yr (+$20/mo · 6.6%)
ⓘ Screening estimate from a state-policy table — verify with the county assessor before closing.
Climate risk First Street
- Flood 1/10 Low FEMA zone X (unshaded) · 0% chance over 30 yrs
- Wildfire 4/10 Moderate
- Heat 3/10 Moderate 6 d/yr ≥97°F today · 13 d/yr by 30 yrs out
- Wind 4/10 Moderate 11% chance of damaging wind over 30 yrs
- Air quality 2/10 Low 1 unhealthy d/yr today · 2 by 30 yrs out
Nearby sold comps map
Loading sold comps map…
Walkable amenities ~0.75 mi
Loading nearby amenities…
Taxation est. · year 1
- Rental income
- $26,400
- − Mortgage interest
- −$14,844
- − Property taxes
- −$3,696
- − Insurance
- −$1,325
- − Repairs & maintenance
- −$2,112
- − Management
- −$2,112
- − Depreciation
- −$7,709
- Taxable loss
- −$5,398
- Est. tax savings @ 24.0%
- +$1,296
- After-tax cash flow
- $455/yr
For passive investors: Depreciation is non-cash, so a rental often shows a tax loss while cash-flowing — sheltering income. Rental losses are passive: they offset passive income freely, and up to $25,000/yr can offset ordinary (W-2) income if you actively participate and your MAGI is under $100k (phasing out to $0 by $150k); unused losses carry forward. On sale, claimed depreciation is recaptured at up to 25%, and gains may owe capital-gains tax (a 1031 exchange can defer both). Figures are a year-1 estimate at your 24.0% rate — not tax advice; consult a CPA.
Schools (NCES district)
- District
- East Stroudsburg Area SD
- NCES district ID
- 4208670
- Math proficiency
- 25% ▼ -11.00%
- Reading proficiency
- 43% ▼ -18.00%
- Median HH income
- $57,142
- Composite
- 30.13/100
- National rank
- #6332
- State rank
- #413 of 539 in PA
Livability — Saw Creek
- Score
- 59/100
- State rank
- #1538
- US rank
- #20241
Category grades
Schools grade is shown separately in the Schools card above.
Census & demographics
- Population (ZIP)
- 9,591
Population outlook (Pike County) Hauer SSP2
- Today (2025)
- 53,548 people
- By 2030
- 51,622 · -3.6%
- By 2040
- 46,490 · -13.2%
- By 2050
- 40,372 · -24.6%
- By 2075
- 31,951 · -40.3%
- By 2100
- 26,821 · -49.9%
Race, ethnicity, and origin ACS 2023
- Neighborhood character
- Diverse neighborhood (Simpson 0.67)
- Race & ethnicity
- White 47% Hispanic / Latino 26% Black 21% Two or more races 12% Asian 1%
- Hispanic origin (detail)
- Mexican 1% Puerto Rican 12% Cuban 3% Dominican 5%
- Common ancestry
- Romanian 2% Estonian 1% Lithuanian 1%
- Foreign-born
- 19% · Canada, South Korea
- Languages at home
- 69% English-only · Spanish 19% Russian/Polish/Slavic 4% French/Haitian/Cajun 3%
Political lean MEDSL · Pike
- 2024 margin
- Strong R (+24.1) · D 37.6% · R 61.6%
- 2008→2024 swing
- -19.8pp toward R · 2008: -4.2pp · 2024: -24.1pp
- All cycles
- 2024: R+24.1 2020: R+19.0 2016: R+26.0 2012: R+11.0 2008: R+4.2
Not yet ingested
- Civics
- —
Market trends
- HPI YoY
- ▲ 3.51%
- Current HPI
- 243.6754
- Rent YoY
- —
- Metro
- —
- State GDP YoY
- ▲ 1.68%
- F500 in state
- 34
Industry mix (Fortune 500 HQ in PA)
| Industry | F500 HQs | Revenue |
|---|---|---|
| Healthcare | 2 | $309B |
|
||
| Insurance | 2 | $27B |
|
||
| Telecommunications / Media | 1 | $124B |
|
||
| Industrial Distribution | 1 | $22B |
|
||
| Financial Services | 1 | $20B |
|
||
| Chemicals / Materials | 1 | $18B |
|
||
Price history
+174.7% since first listed3 events — show timeline
- 2026-04-28 Sold (Public Records) $250,000 Public Records
- 2026-01-06 Listed $265,000 Fizber.com
- 2004-05-04 Sold (Public Records) $91,000 Public Records
Property tax history
+1.0%/yrLatest (2026): $3,696 · +1.6% YoY. Source: county tax records.
Cash-flow waterfall
monthlySold comps — $/sqft
last 12 mo · ≤1 miLoading sold comps…