3560 Jeffersonville Rd · Macon-Bibb County, GA
Flood risk 1/10 · Minimal
- FEMA flood zone
- X (unshaded)
- Chance of flooding over 30 yrs
- 0.0%
- Est. flood insurance / yr
- $507 – $1,088
Fire risk 4/10 · Minor
- Est. fire insurance / yr
- $963 – $1,789
Heat risk 7/10 · Major
- Hot days now (above 107°F)
- 7 days/yr
- Hot days in 30 yrs
- 17 days/yr
Wind risk 6/10 · Moderate
- Chance of severe wind over 30 yrs
- 66.0%
Air-quality risk 4/10 · Minor
- Unhealthy air days now
- 5 days/yr
- Unhealthy air days in 30 yrs
- 5 days/yr
Risk factors via First Street. Map © Google.
Why this score? — see what drove the A- grade
The composite is a weighted blend of 9 inputs, each scored 0–100. Each bar is that input's sub-score; the figure is the points it added to the 100-point composite (weight × sub-score).
- Cash flow +30.0/30.0
- ARV discount +15.0/15.0
- 1% rule +10.0/10.0
- DSCR +10.0/10.0
- Appreciation +7.2/10.0
- Rent growth +5.0/5.0
- Livability +2.5/5.0
- Condition / age +2.5/5.0
- Schools +1.2/10.0
$30,000
🖨 Deal sheet 📄 Offer letter ✓ Due diligence
Listing remarks MLS
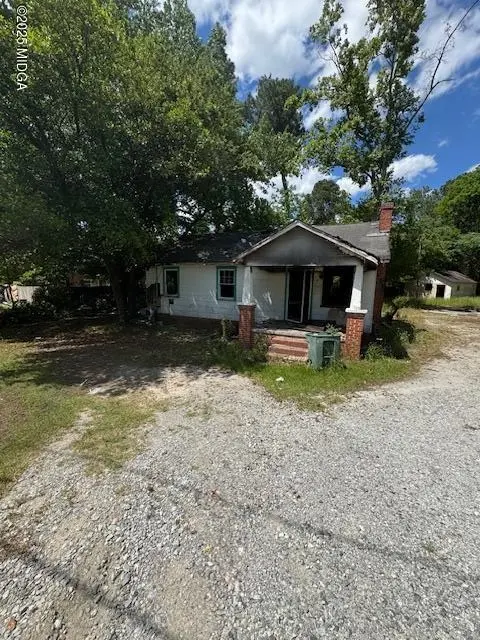
3 Structures on the Property. Front structure has fire damage. Contact Agent for more information.
Key facts
- 0.62 acre lot
- Listed 362 days
Neighborhood map
What this means for you Summary
Snapshot
- This is a 3-bed/1.0-bath single-family listed at $30k.
Deal economics
- At list price, monthly cash flow is $675 ($8k/yr) — positive.
- The deal already cash-flows at list — no discount required.
- Meets the 1% rule at list price ($1k rent vs $30k).
- Recommended offer: $26k (12.0% below list) — sets the bar for market timing.
- Cap rate 33.3% vs local median 5.4% in Macon-Bibb County — top-decile yield for the area; either an underpriced asset or a hidden risk that comps aren't pricing in. Stress-test before assuming the spread holds.
Location & tenants
- Location reads: area grade A — affects rentability + tenant quality, not the cash-flow math above.
- Bibb County (urban): math 11% / reading 18% proficiency, ranked #161 of 174 in GA (top 92%) — low school quality limits family demand, transient renter base, plan for 1-2y turnover; 75% free/reduced lunch — lower-income household profile, screen leases tightly.
- Market conditions: Rents rising fast (+10.8%/yr); 122 active listings in the ZIP; 3 comparable units currently listed for rent nearby; rentals leasing fast (median 14d on market — plan ~1-2 weeks tenant-placement turnaround); lower-income renter base — watch delinquency; 154 units permitted in Bibb County in 2024 (0 in 5+ unit buildings).
- This rent runs 30% of the median local income ($45k/yr) — at the standard rent-burdened threshold; future hikes will face affordability resistance.
Forward outlook
- In year one you build about $2k of equity ($207 loan paydown + $1k appreciation (4.3% local appreciation)).
- Bibb County population projected at -12% by 2050 — secular population decline; favor cash flow + early exit over multi-decade hold.
- At projected returns (4.3% appreciation + 8.0% rent growth), your $8k cash investment doubles in ~1 year — after that, you're playing with house money.
Negotiation context
- It's been on market 363 days — a 12% lower offer ($26k) is reasonable based on typical stale-listing flexibility.
- 3 sale attempts; this cycle's ask has dropped $10k (25%) from the opening price — seller is motivated, your offer sets the floor, not the list.
Risks & watch-outs
- Watch-outs: built in 1950 — expect roof / HVAC / electrical / plumbing capex.
- Climate carrying-cost: major wind risk, 66% chance of damaging wind over 30y; extreme-heat days projected 7→17/yr by 2055 (HVAC capex compounding) — expect insurance premiums to compound above CPI over the hold.
Questions for the listing agent
- It's been on market 363 days. Have you received any prior offers? Is the seller open to a 12% concession, seller financing, or rate buy-down credit?
- Built in 1950 — when were the roof, HVAC, electrical panel, plumbing, and water heater last replaced?
- Why hasn't it sold? Are there any deal-killer items the seller is aware of (foundation, flood, title, zoning, code violations)?
- Is there a deadline driving the sale (1031 exchange, divorce, estate, relocation)? That informs how much negotiation room exists.
- What's the average days-on-market for RENTAL listings here right now (not sales)? A rising rental-DOM trend means longer vacancies and softer asking-rent achievability than the comps imply.
- What's the recent tenant-quality profile in this submarket — average credit score on applications, eviction rate, late-payment / NSF rate, and stable-employment percentage? A property-management company in the area should have these aggregated.
- How much new for-sale + rental construction is in the pipeline within 1–3 miles? Heavy new supply typically softens prices + rents 12–24 months out; constrained supply supports both.
Investment metrics
- 1% rule
- 3.74% ✓
- Cap rate
- 33.29%
- Cash-on-cash
- 96.41%
- DSCR
- 5.29
- GRM
- 2.2
CMA / ARV
- ARV (median comp)
- $41,042
- List price
- $30,000
- Delta
- -26.90%
- Verdict
- UNDERPRICED
- Comps
- 3 within 1.0 mi
Show comp detail 9 sales within ~0.75 mi
| Address | Dist | Beds/Ba | Sqft | Sold | Price | $/sf | Match |
|---|---|---|---|---|---|---|---|
| 3724 Hitchcock Rd Rd | 0.16mi | 2/1.0 (-1) | 988 (+3%) | 5mo | $21,500 | $22 | 78 |
| 3497 Lancing Ct | 0.35mi | 3/1.0 | 1,000 (+4%) | 10mo | $23,000 | $23 | 68 |
| 3341 Masseyville Rd | 0.54mi | 3/1.0 | 996 (+4%) | 5mo | $99,000 | $99 | 65 |
| 3362 Kings Park | 0.21mi | 3/1.0 | 1,050 (+9%) | 17mo | $27,000 | $26 | 61 |
| 3499 Majestic Ct | 0.38mi | 3/1.0 | 1,040 (+8%) | 12mo | $22,000 | $21 | 58 |
| 3425 Majestic Ct | 0.49mi | 3/1.0 | 1,056 (+10%) | 3mo | $42,500 | $40 | 58 |
| 3388 Majestic Ln | 0.49mi | 3/1.5 | 1,056 (+10%) | 8mo | $60,000 | $57 | 52 |
| 3928 Kings Park Cir | 0.35mi | 2/1.5 (-1) | 1,056 (+10%) | 18mo | $50,000 | $47 | 46 |
| 3355 Finneydale Ct S | 0.49mi | 2/1.0 (-1) | 1,025 (+6%) | 23mo | $50,000 | $49 | 42 |
Match score weights: distance 35% · size 25% · config 20% · recency 20%. Top-matched comps best support the ARV.
Projected returns pro-forma
4.31% appreciation · 8.0% rent growth · sell at horizon
- IRR
- —
- Equity multiple
- 7.51×
- Total profit
- $54,682
- Equity at exit
- $15,761
- IRR
- —
- Equity multiple
- 18.03×
- Total profit
- $143,012
- Equity at exit
- $26,227
Cash invested: $8,400 (down + closing). Projections, not guarantees.
Landlord ↔ Tenant lean methodology
- Overall (STATE)
- 90 Strongly Landlord-Friendly
- State Georgia
- 90 Strongly Landlord-Friendly · R+3
- County
- — inherits STATE
- City
- — inherits STATE
ZIP-level market 31217
- Home prices YoY
- 2.1%
- Rents YoY
- 10.8%
- Active inventory
- 122
- Price-to-rent
- 2.2×
Monthly cashflow live
- Estimated rent
- $1,122 medium interval (Pro) →
- Mortgage (P&I)
- −$157
- Tax from tax record
- −$42 /mo · $503/yr
- Insurance
- −$12
- HOA
- −$0
- Vacancy / Maint / Mgmt
- −$236
- Net cashflow
- $675
Break-even live
UW: 25.0% down · 7.5% · 30yr · 1.5% tax · 5.0% vac · 8.0% maint · 8.0% mgmt
Financing live
Cash to close
- Down payment
- $7,500
- Closing costs
- $900
- Reserves months
- —
- Total cash needed
- —
Loan-product check · same deal, 3 products live
Conventional
25% down · 7.5% · 30yr
- Down + closing
- —
- Monthly P&I
- —
- Monthly cashflow
- —
- DSCR
- —
- Eligible?
- —
Personal DTI + credit; lowest rate.
DSCR
20% down · 8.5% · 30yr
- Down + closing
- —
- Monthly P&I
- —
- Monthly cashflow
- —
- DSCR
- —
- Eligible?
- —
No personal income docs; deal must DSCR.
Hard money
10% down · 12.0% · 12mo
- Down + closing
- —
- Monthly P&I
- —
- Monthly cashflow
- —
- DSCR
- —
- Eligible?
- —
Short-term bridge; refi at stabilization.
Rent comps 3 comps
| Address | Beds | Baths | Sqft | Rent | $/sqft | DOM | Units | Dist |
|---|---|---|---|---|---|---|---|---|
| 3716 Piedmont Dr Macon, GA | 2.0 | 1.0 | 640 | $850 | $1.33 | 13d | 1 | 0.07mi |
| 3722 Piedmont Dr Macon, GA | 3.0 | 1.0 | 780 | $895 | $1.15 | 13d | 1 | 0.09mi |
| 3258 Lancing Ln Macon, GA | 3.0 | 2.0 | 1000 | $1,200 | $1.20 | 13d | 1 | 0.27mi |
Listing history 22 events
-
2026-06-19days on market $30,000 Active 363 DOM
-
2026-06-18days on market $30,000 Active 362 DOM
-
2026-06-17days on market $30,000 Active 361 DOM
-
2026-06-16days on market $30,000 Active 360 DOM
-
2026-06-15days on market $30,000 Active 359 DOM
-
2026-06-14days on market $30,000 Active 357 DOM
-
2026-06-13days on market $30,000 Active 356 DOM
-
2026-06-10days on market $30,000 Active 354 DOM
-
2026-06-09days on market $30,000 Active 353 DOM
-
2026-06-09days on market $30,000 Active 352 DOM
-
2026-06-07days on market $30,000 Active 351 DOM
-
2026-06-03days on market $30,000 Active 347 DOM
-
2026-06-02pricedays on market $30,000 Active 346 DOM
-
2026-06-01days on market $40,000 Active 345 DOM
-
2026-05-31days on market $40,000 Active 344 DOM
-
2026-05-30days on market $40,000 Active 343 DOM
-
2025-11-17status Active 98-char remark
Show marketing remark (98 chars)
3 Structures on the Property. Front structure has fire damage. Contact Agent for more information.
-
2025-10-06historical 98-char remark
Show marketing remark (98 chars)
3 Structures on the Property. Front structure has fire damage. Contact Agent for more information.
-
2025-06-11status Active 98-char remark
Show marketing remark (98 chars)
3 Structures on the Property. Front structure has fire damage. Contact Agent for more information.
-
2025-06-03historical Active Under Contract 98-char remark
Show marketing remark (98 chars)
3 Structures on the Property. Front structure has fire damage. Contact Agent for more information.
-
2025-05-10$40,000 Active 98-char remark
Show marketing remark (98 chars)
3 Structures on the Property. Front structure has fire damage. Contact Agent for more information.
-
2024-09-05soldstatus $26,500
ⓘ Source: listings_history table (triggers on properties + properties_extension) + one-shot
backfill from property_details.listing_events for pre-trigger history.
Tax reassessment forecast GA · Resets to sale price
- Current annual tax
- $503 · $42/mo
- Projected year-2 tax
- $503 · $42/mo
- Expected delta
- $0/yr ($0/mo · 0.0%)
ⓘ Screening estimate from a state-policy table — verify with the county assessor before closing.
Climate risk First Street
- Flood 1/10 Low FEMA zone X (unshaded) · 0% chance over 30 yrs
- Wildfire 4/10 Moderate
- Heat 7/10 Severe 7 d/yr ≥107°F today · 17 d/yr by 30 yrs out
- Wind 6/10 Major 66% chance of damaging wind over 30 yrs
- Air quality 4/10 Moderate 5 unhealthy d/yr today · 5 by 30 yrs out
Nearby sold comps map
Loading sold comps map…
Walkable amenities ~0.75 mi
Loading nearby amenities…
Taxation est. · year 1
- Rental income
- $13,467
- − Mortgage interest
- −$1,680
- − Property taxes
- −$503
- − Insurance
- −$150
- − Repairs & maintenance
- −$1,077
- − Management
- −$1,077
- − Depreciation
- −$873
- Taxable income
- $8,106
- Est. tax owed @ 24.0%
- −$1,946
- After-tax cash flow
- $6,153/yr
For passive investors: Depreciation is non-cash, so a rental often shows a tax loss while cash-flowing — sheltering income. Rental losses are passive: they offset passive income freely, and up to $25,000/yr can offset ordinary (W-2) income if you actively participate and your MAGI is under $100k (phasing out to $0 by $150k); unused losses carry forward. On sale, claimed depreciation is recaptured at up to 25%, and gains may owe capital-gains tax (a 1031 exchange can defer both). Figures are a year-1 estimate at your 24.0% rate — not tax advice; consult a CPA.
Schools (NCES district)
- District
- Bibb County
- NCES district ID
- 1300420
- Math proficiency
- 11% ▼ -14.00%
- Reading proficiency
- 18% ▼ -11.00%
- Median HH income
- $37,426
- Composite
- 12.13/100
- National rank
- #9654
- State rank
- #161 of 174 in GA
Livability — Macon-Bibb County
No livability data for this city. (Only ~50 U.S. cities are tracked.)
Census & demographics
- Census place
- Macon-Bibb County, GA
- County
- Bibb County · 164,332 people
- City population
- 143,186
- Metro
- Macon-Bibb County, GA
- Population (ZIP)
- 17,732
- Household income
- $44,809
- Rent vs Own
- Severe rent burden
- 391.0
Population outlook (Bibb County) Hauer SSP2
- Today (2025)
- 148,772 people
- By 2030
- 145,904 · -1.9%
- By 2040
- 139,404 · -6.3%
- By 2050
- 131,603 · -11.5%
- By 2075
- 111,050 · -25.4%
- By 2100
- 83,346 · -44.0%
Race, ethnicity, and origin ACS 2023
- Neighborhood character
- Majority Black (57%)
- Race & ethnicity
- Black 57% White 38% Two or more races 4% Hispanic / Latino 2%
- Common ancestry
- Slovak 1% Italian 1%
- Foreign-born
- 1% · Canada
- Languages at home
- 98% English-only · Spanish 1%
Political lean MEDSL · Bibb
- 2024 margin
- Strong D (+22.4) · D 61.0% · R 38.5%
- 2008→2024 swing
- +4.4pp toward D · 2008: 18.0pp · 2024: 22.4pp
- All cycles
- 2024: D+22.4 2020: D+23.8 2016: D+20.2 2012: D+20.0 2008: D+18.0
Not yet ingested
- Civics
- —
Market trends
- HPI YoY
- ▲ 4.31%
- Current HPI
- 209.9166
- Rent YoY
- ▲ 10.85%
- Metro
- Macon-Bibb County, GA
- State GDP YoY
- ▲ 2.66%
- F500 in state
- 28
Industry mix (Fortune 500 HQ in GA)
| Industry | F500 HQs | Revenue |
|---|---|---|
| Paper / Packaging | 2 | $29B |
|
||
| Retail | 1 | $160B |
|
||
| Transportation / Logistics | 1 | $91B |
|
||
| Airlines | 1 | $62B |
|
||
| Consumer Goods | 1 | $47B |
|
||
| Utilities | 1 | $25B |
|
||
Price history
+50.9% since first listed6 events — show timeline
- 2025-11-17 Relisted — MGMLS
- 2025-10-06 Delisted — MGMLS
- 2025-06-11 Relisted — MGMLS
- 2025-06-03 Contingent — MGMLS
- 2025-05-10 Listed $40,000 MGMLS
- 2024-09-05 Sold (Public Records) $26,500 Public Records
Property tax history
+22.9%/yrLatest (2025): $503 · -1.3% YoY. Source: county tax records.
Cash-flow waterfall
monthlySold comps — $/sqft
last 12 mo · ≤1 miLoading sold comps…