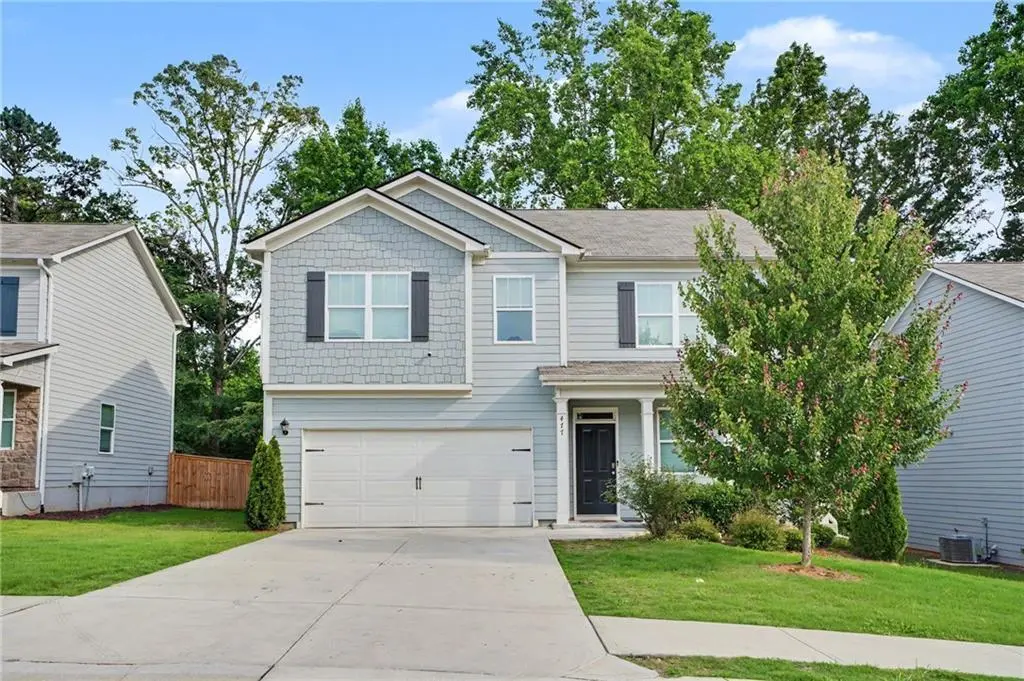
477 Starbuck Pkwy · Pendergrass, GA
Flood risk 1/10 · Minimal
- FEMA flood zone
- X (unshaded)
- Chance of flooding over 30 yrs
- 0.0%
- Est. flood insurance / yr
- $507 – $1,088
Fire risk 3/10 · Minor
- Est. fire insurance / yr
- $963 – $1,789
Heat risk 5/10 · Moderate
- Hot days now (above 105°F)
- 7 days/yr
- Hot days in 30 yrs
- 18 days/yr
Wind risk 4/10 · Minor
- Chance of severe wind over 30 yrs
- 14.0%
Air-quality risk 3/10 · Minor
- Unhealthy air days now
- 3 days/yr
- Unhealthy air days in 30 yrs
- 4 days/yr
Risk factors via First Street. Map © Google.
Why this score? — see what drove the D+ grade
The composite is a weighted blend of 9 inputs, each scored 0–100. Each bar is that input's sub-score; the figure is the points it added to the 100-point composite (weight × sub-score).
- ARV discount +13.4/15.0
- Appreciation +10.0/10.0
- Cash flow +7.1/30.0
- Livability +3.4/5.0
- Schools +3.3/10.0
- Rent growth +2.5/5.0
- Condition / age +2.5/5.0
- 1% rule +2.1/10.0
- DSCR +1.3/10.0
$375,000
🖨 Deal sheet (PDF) 📄 Offer letter ✓ Due diligence
Listing remarks
Beautiful 5-bedroom, 3-bath home offering comfortable living space in a desirable Pendergrass community. Open -concept-layout perfect for everyday living and entertaining. offering plenty of space for family, guests, or a home office. Residents enjoy access to outstanding community amenities, including a swimming pool and playground, creating opportunities for recreation and relaxation just steps from home. Seller motivated.
Key facts
- Community amenities
- Swimming pool
- Open concept layout
Tags
Property features AI
Finance
- Other: Asphalt road access; Located in Jackson County, GA; Directions: GPS
- HOA & community: Homeowners association with an annual fee of $650; Community playground; Community pool
Exterior
- Parking: Two-car garage; Driveway parking; Open parking available
- Utilities: Public water; Public sewer; Electric service with 110V and 220V; Electricity available; Sewer available; Underground utilities
- Home design: Two levels
- Construction: Wood siding construction; Composition roof; Slab foundation; Resale condition
- Exterior features: Front porch
Interior
- Kitchen: White cabinets; Kitchen island; Walk-in pantry; Stone countertops; Dishwasher; Electric range; Microwave
- Bedrooms: One main-level bedroom; Four upper-level bedrooms
- Flooring: Carpet; Vinyl
- Bathrooms: Three full bathrooms; Master bath with double vanity and separate tub and shower; One main-level bathroom; Two full upper-level bathrooms
- Heating & cooling: Central heating; Central air conditioning
- Interior features: Walk-in closets; Double-pane windows; No shared/common walls; Loft
- Laundry & utility: Laundry room on upper level
Neighborhood map
What this means for you Summary
Snapshot
- This is a 5-bed/2.5-bath single-family listed at $375k.
Deal economics
- At list price, monthly cash flow is $-525 ($-6k/yr) — negative.
- To cash-flow at today's rent, offer at most $282k (24.7% below list).
- To meet the 1% rule (rent ≥ 1% of price), the offer needs to be $267k (28.8% below list).
- Recommended offer: $267k (28.8% below list) — sets the bar for 1% rule.
- Cap rate 4.6% vs local median 3.6% in Pendergrass — meaningfully above typical; check what's discounted (condition, days-on-market, listing class) to confirm the premium yield is real.
Location & tenants
- Location reads 67/100 on livability (#174 in GA) — a middle-class / working-renter tenant base. Strengths: cost of living A+, housing A+, crime A; Watch: amenities F, commute F.
- Jackson County (rural): math 38% / reading 37% proficiency, ranked #50 of 174 in GA (top 29%) — families likely to look elsewhere, expect single-tenant / working-renter base with shorter leases.
- Zoned schools: North Jackson Elementary School (math 36% / reading 30%, grade F, #567 of 1,228 statewide, top 47%, 687 students, 43% FRL); West Jackson Middle School (math 39% / reading 43%, grade F, #135 of 470 statewide, top 29%, 1,502 students, 28% FRL); Jackson County High School (math 20% / reading 17%, grade F, #254 of 424 statewide, top 61%, 1,833 students, 26% FRL).
- Market conditions: 143 active listings in the ZIP; 7 comparable units currently listed for rent nearby; rentals lingering (median 46d on market — plan ~5-8 weeks vacancy on turnover, expect pricing pressure); 71% of comp listings sitting > 30 days — soft ceiling on asking rent; solid renter incomes; 2,167 units permitted in Jackson County in 2024 (59 in 5+ unit buildings).
- This rent runs 33% of the median local income ($97k/yr) — at the standard rent-burdened threshold; future hikes will face affordability resistance.
Forward outlook
- In year one you build about $40k of equity ($3k loan paydown + $38k appreciation (10.0% local appreciation)).
- Jackson County population projected at +14% by 2050 — modest demand growth; plan on rents tracking national, not racing it.
- By year 2, paydown + projected appreciation supports a ~$64k cash-out refi (75% LTV) — recoverable capital for the next deal without selling this one.
Negotiation context
- Only 13 days on market — expect competitive offers; lowballing is unlikely to land.
- 7 sale attempts with the ask held roughly flat each time — persistent listings suggest the price (not the market) is what's stuck; bring a comps-based counter.
Risks & watch-outs
- Climate carrying-cost: extreme-heat days projected 7→18/yr by 2055 (HVAC capex compounding) — expect insurance premiums to compound above CPI over the hold.
Questions for the listing agent
- What do current leases actually rent for vs. the listed asking? Can we see a recent rent roll and the last 12 months of T-12 income?
- What does the HOA fee cover, when was the last increase, and are there any pending special assessments or reserve-fund shortfalls?
- Is there a deadline driving the sale (1031 exchange, divorce, estate, relocation)? That informs how much negotiation room exists.
- Schools are F-rated, which usually means shorter tenancies and higher turnover. Who's the typical renter profile here, and what's been the actual vacancy rate?
- The area grade is low — what's the realistic commute time and amenity access for the typical tenant pool here? Any planned neighborhood developments (good or bad) we should know about?
- What's the average days-on-market for RENTAL listings here right now (not sales)? A rising rental-DOM trend means longer vacancies and softer asking-rent achievability than the comps imply.
- What's the recent tenant-quality profile in this submarket — average credit score on applications, eviction rate, late-payment / NSF rate, and stable-employment percentage? A property-management company in the area should have these aggregated.
- How much new for-sale + rental construction is in the pipeline within 1–3 miles? Heavy new supply typically softens prices + rents 12–24 months out; constrained supply supports both.
Investment metrics
- 1% rule
- 0.71% ✗
- Cap rate
- 4.61%
- Cash-on-cash
- -6.00%
- DSCR
- 0.73
- GRM
- 11.7
CMA / ARV
- ARV (on-the-fly)
- $431,985
- Comps found
- 12
Show comp detail 12 sales within ~0.75 mi
| Address | Dist | Beds/Ba | Sqft | Sold | Price | $/sf | Match |
|---|---|---|---|---|---|---|---|
| 297 Starbuck Pkwy | 0.18mi | 5/3.0 | 2,511 (-10%) | 2mo | $360,000 | $143 | 71 |
| 393 Walnut Grove Way | 0.25mi | 5/3.0 | 2,511 (-10%) | 2mo | $359,000 | $143 | 68 |
| 1004 Sope Creek Cir | 0.47mi | 5/3.0 | 2,937 (+5%) | 2mo | $420,000 | $143 | 66 |
| 928 Sope Creek Cir | 0.53mi | 5/3.0 | 2,674 (-4%) | 1mo | $410,000 | $153 | 65 |
| 1004 Sope Creek Cir | 0.47mi | 5/3.0 | 2,937 (+5%) | 2mo | $420,000 | $143 | 65 |
| 429 Morgan Creek Rd | 0.55mi | 5/3.0 | 2,674 (-4%) | 1mo | $416,480 | $156 | 64 |
| 296 Walnut Grove Way | 0.33mi | 4/2.5 (-1) | 2,420 (-13%) | 3mo | $349,900 | $145 | 55 |
| 1028 Sope Creek Cir | 0.45mi | 4/2.5 (-1) | 2,479 (-11%) | 3mo | $390,000 | $157 | 54 |
| 365 Morgan Creek Rd | 0.54mi | 4/2.5 (-1) | 2,479 (-11%) | 0mo | $384,990 | $155 | 51 |
| 1017 Sope Creek Cir | 0.49mi | 4/2.5 (-1) | 2,479 (-11%) | 3mo | $395,000 | $159 | 51 |
| 443 Morgan Crk | 0.56mi | 4/2.5 (-1) | 2,479 (-11%) | 3mo | $399,000 | $161 | 48 |
| 443 Morgan Creek Rd | 0.56mi | 4/2.5 (-1) | 2,479 (-11%) | 3mo | $399,000 | $161 | 48 |
Match score weights: distance 35% · size 25% · config 20% · recency 20%. Top-matched comps best support the ARV.
Projected returns pro-forma
10.0% appreciation · 3.0% rent growth · sell at horizon
- IRR
- 20.0%
- Equity multiple
- 2.63×
- Total profit
- $170,846
- Equity at exit
- $337,830
- IRR
- 18.3%
- Equity multiple
- 6.04×
- Total profit
- $529,558
- Equity at exit
- $728,543
Cash invested: $105,000 (down + closing). Projections, not guarantees.
Landlord ↔ Tenant lean methodology
- Overall (STATE)
- 90 Strongly Landlord-Friendly
- State Georgia
- 90 Strongly Landlord-Friendly · R+3
- County
- — inherits STATE
- City
- — inherits STATE
ZIP-level market 30567
- Home prices YoY
- 14.7%
- Active inventory
- 143
- Price-to-rent
- 11.7×
Monthly cashflow live
- Estimated rent
- $2,672 high interval (Pro) →
- Mortgage (P&I)
- −$1,967
- Tax from tax record
- −$459 /mo · $5,511/yr
- Insurance
- −$156
- HOA
- −$54
- Vacancy / Maint / Mgmt
- −$561
- Net cashflow
- $-525
Break-even live
Sensitivity live
| Price | -10% $-313 | -5% $-419 | +0% $-525 | +5% $-631 | +10% $-738 |
|---|---|---|---|---|---|
| Rent | -10% $-736 | -5% $-631 | +0% $-525 | +5% $-420 | +10% $-314 |
| Rate | -1.0pp $-336 | -0.5pp $-430 | base $-525 | +0.5pp $-622 | +1.0pp $-721 |
UW: 25.0% down · 7.5% · 30yr · 1.5% tax · 5.0% vac · 8.0% maint · 8.0% mgmt
Financing live
Cash to close
- Down payment
- $93,750
- Closing costs
- $11,250
- Reserves months
- —
- Total cash needed
- —
Loan-product check · same deal, 3 products live
Conventional
25% down · 7.5% · 30yr
- Down + closing
- —
- Monthly P&I
- —
- Monthly cashflow
- —
- DSCR
- —
- Eligible?
- —
Personal DTI + credit; lowest rate.
DSCR
20% down · 8.5% · 30yr
- Down + closing
- —
- Monthly P&I
- —
- Monthly cashflow
- —
- DSCR
- —
- Eligible?
- —
No personal income docs; deal must DSCR.
Hard money
10% down · 12.0% · 12mo
- Down + closing
- —
- Monthly P&I
- —
- Monthly cashflow
- —
- DSCR
- —
- Eligible?
- —
Short-term bridge; refi at stabilization.
Rent comps 7 comps
| Address | Beds | Baths | Sqft | Rent | $/sqft | DOM | Units | Dist |
|---|---|---|---|---|---|---|---|---|
| 112 Russell Rd Pendergrass, GA | 5.0 | 3.0 | 2933 | $2,600 | $0.89 | 23d | 1 | 0.14mi |
| 63 Steel Trl Pendergrass, GA | 4.0 | 2.5 | 2156 | $2,160 | $1.00 | 45d | 1 | 0.17mi |
| 306 Walnut Grove Way Pendergrass, GA | 5.0 | 3.0 | 2449 | $2,400 | $0.98 | 45d | 1 | 0.32mi |
| 274 Walnut Grove Way Pendergrass, GA | 5.0 | 3.0 | 2449 | $2,300 | $0.94 | 45d | 1 | 0.35mi |
| 250 Sope Creek Cir Pendergrass, GA | 4.0 | 3.0 | 2479 | $2,200 | $0.89 | 45d | 1 | 0.48mi |
| 25 Blue River Ct Pendergrass, GA | 4.0 | 2.5 | 1928 | $1,899 | $0.98 | 45d | 1 | 0.81mi |
| 107 Wynn Way Pendergrass, GA | 4.0 | 2.5 | 1928 | $2,300 | $1.19 | 23d | 1 | 0.85mi |
HOA detail
- Monthly dues
- $54 · $648/yr
- Likely covers
- pool
Listing history 11 events
-
2026-06-22days on market $375,000 Active 13 DOM
-
2026-06-19days on market $375,000 Active 11 DOM
-
2026-06-18days on market $375,000 Active 10 DOM
-
2026-06-17days on market $375,000 Active 9 DOM
-
2026-06-16days on market $375,000 Active 8 DOM
-
2026-06-15days on market $375,000 Active 7 DOM
-
2026-06-14days on market $375,000 Active 5 DOM
-
2026-06-13days on market $375,000 Active 4 DOM
-
2026-06-10days on market $375,000 Active 2 DOM
-
2026-06-09remarks 429-char remark
-
2026-06-09$375,000 Active 1 DOM
ⓘ Source: listings_history table (triggers on properties + properties_extension) + one-shot
backfill from property_details.listing_events for pre-trigger history.
Tax reassessment forecast GA · Resets to sale price
- Current annual tax
- $5,511 · $459/mo
- Projected year-2 tax
- $5,511 · $459/mo
- Expected delta
- $0/yr ($0/mo · 0.0%)
ⓘ Screening estimate from a state-policy table — verify with the county assessor before closing.
Climate risk First Street
- Flood 1/10 Low FEMA zone X (unshaded) · 0% chance over 30 yrs
- Wildfire 3/10 Moderate
- Heat 5/10 Major 7 d/yr ≥105°F today · 18 d/yr by 30 yrs out
- Wind 4/10 Moderate 14% chance of damaging wind over 30 yrs
- Air quality 3/10 Moderate 3 unhealthy d/yr today · 4 by 30 yrs out
Nearby sold comps map
Loading sold comps map…
Walkable amenities ~0.75 mi
Loading nearby amenities…
Taxation est. · year 1
- Rental income
- $32,062
- − Mortgage interest
- −$21,006
- − Property taxes
- −$5,511
- − Insurance
- −$1,875
- − Repairs & maintenance
- −$2,565
- − Management
- −$2,565
- − HOA
- −$648
- − Depreciation
- −$10,909
- Taxable loss
- −$13,017
- Est. tax savings @ 24.0%
- +$3,124
- After-tax cash flow
- $-3,180/yr
For passive investors: Depreciation is non-cash, so a rental often shows a tax loss while cash-flowing — sheltering income. Rental losses are passive: they offset passive income freely, and up to $25,000/yr can offset ordinary (W-2) income if you actively participate and your MAGI is under $100k (phasing out to $0 by $150k); unused losses carry forward. On sale, claimed depreciation is recaptured at up to 25%, and gains may owe capital-gains tax (a 1031 exchange can defer both). Figures are a year-1 estimate at your 24.0% rate — not tax advice; consult a CPA.
Schools (NCES district)
- District
- Jackson County
- NCES district ID
- 1302940
- Math proficiency
- 38% ▼ -14.00%
- Reading proficiency
- 37% ▼ -10.00%
- Median HH income
- $56,773
- Composite
- 33.08/100
- National rank
- #5566
- State rank
- #50 of 174 in GA
Livability — Pendergrass
- Score
- 67/100
- State rank
- #174
- US rank
- #10962
Category grades
Schools grade is shown separately in the Schools card above.
Census & demographics
- Census place
- Pendergrass, GA
- County
- Jackson County · 50,436 people
- City population
- 5,487
- Metro
- Jefferson, GA
- Population (ZIP)
- 5,487
- Household income
- $97,181
- Rent vs Own
- Severe rent burden
- 115.0
Population outlook (Jackson County) Hauer SSP2
- Today (2025)
- 68,403 people
- By 2030
- 70,771 · +3.5%
- By 2040
- 75,050 · +9.7%
- By 2050
- 78,022 · +14.1%
- By 2075
- 82,646 · +20.8%
- By 2100
- 80,701 · +18.0%
Race, ethnicity, and origin ACS 2023
- Neighborhood character
- Diverse neighborhood (Simpson 0.56)
- Race & ethnicity
- White 63% Hispanic / Latino 20% Two or more races 8% Black 7% Asian 4%
- Hispanic origin (detail)
- Mexican 13%
- Common ancestry
- Slovak 1% Serbian 1% Lithuanian 1%
- Foreign-born
- 15% · Canada, Vietnam
- Languages at home
- 81% English-only · Spanish 14% Other Asian/Pacific 1% Vietnamese 1%
Political lean MEDSL · Jackson
- 2024 margin
- Solid R (+55.1) · D 22.2% · R 77.2%
- 2008→2024 swing
- +0.8pp no change · 2008: -55.9pp · 2024: -55.1pp
- All cycles
- 2024: R+55.1 2020: R+58.0 2016: R+63.9 2012: R+62.9 2008: R+55.9
Not yet ingested
- Civics
- —
Market trends
- HPI YoY
- ▲ 46.83%
- Current HPI
- 364.4902
- Rent YoY
- —
- Metro
- Jefferson, GA
- State GDP YoY
- ▲ 2.66%
- F500 in state
- 28
Industry mix (Fortune 500 HQ in GA)
| Industry | F500 HQs | Revenue |
|---|---|---|
| Paper / Packaging | 2 | $29B |
|
||
| Retail | 1 | $160B |
|
||
| Transportation / Logistics | 1 | $91B |
|
||
| Airlines | 1 | $62B |
|
||
| Consumer Goods | 1 | $47B |
|
||
| Utilities | 1 | $25B |
|
||
Price history
+14323.1% since first listed14 events — show timeline
- 2026-06-02 Listed $375,000 FMLS
- 2025-08-20 Listing Removed — GAMLS
- 2025-08-19 Listing Removed — FMLS
- 2025-08-07 Rental Removed $2,600 GAMLS
- 2025-06-24 Listed $380,000 FMLS
- 2025-06-24 Listed $380,000 GAMLS
- 2025-05-30 Listed for Rent $2,600 GAMLS
- 2025-05-29 Rental Removed $2,600 FMLS
- 2025-05-13 Listed for Rent $2,600 FMLS
- 2025-04-08 Rental Removed $2,600 GAMLS
- 2025-03-18 Listed $2,600 FMLS
- 2025-03-18 Listing Removed — FMLS
- 2025-03-17 Coming Soon — FMLS
- 2025-03-17 Listed for Rent $2,600 GAMLS
Property tax history
+73.0%/yrLatest (2025): $5,511 · -0.9% YoY. Source: county tax records.
Cash-flow waterfall
monthlySold comps — $/sqft
last 12 mo · ≤1 miLoading sold comps…