 Multi-family
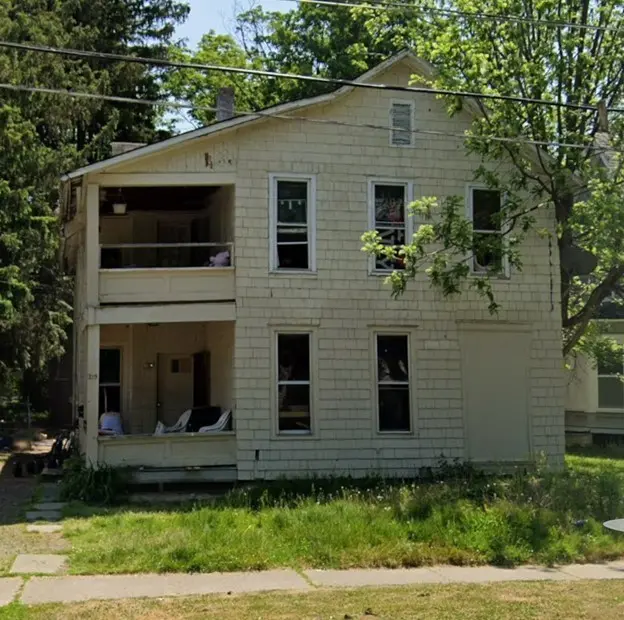
215 W Hudson St · Elmira, NY
Flood risk 5/10 · Moderate
- FEMA flood zone
- X (shaded)
- Chance of flooding over 30 yrs
- 0.27%
- Est. flood insurance / yr
- $473 – $860
Fire risk 2/10 · Minimal
- Est. fire insurance / yr
- $691 – $1,283
Heat risk 3/10 · Minor
- Hot days now (above 96°F)
- 7 days/yr
- Hot days in 30 yrs
- 16 days/yr
Wind risk 2/10 · Minimal
- Chance of severe wind over 30 yrs
- 1.0%
Air-quality risk 1/10 · Minimal
- Unhealthy air days now
- 0 days/yr
- Unhealthy air days in 30 yrs
- 0 days/yr
Risk factors via First Street. Map © Google.
Why this score? — see what drove the D grade
The composite is a weighted blend of 9 inputs, each scored 0–100. Each bar is that input's sub-score; the figure is the points it added to the 100-point composite (weight × sub-score).
- Cash flow +15.0/30.0
- ARV discount +7.5/15.0
- 1% rule +5.0/10.0
- DSCR +5.0/10.0
- Livability +3.1/5.0
- Rent growth +2.5/5.0
- Condition / age +2.5/5.0
- Schools +2.4/10.0
- Appreciation +0.0/10.0
$22,000
🖨 Deal sheet 📄 Offer letter ✓ Due diligence
Multi-family units
County records classify this as Multi-Family (2-4 Unit). Listing-text estimate: 1 unit. estimate disagrees with records
Listing remarks
This spacious property is a true handyman special with serious upside potential for investors, flippers, or buyers looking to build equity. Featuring a large footprint with multiple bedrooms and baths, this home offers the space and layout needed to bring your vision to life.
Key facts
- 9,360 sq ft lot
- 2 garage spots
- Built 1920
Neighborhood map
What this means for you Summary
Snapshot
- This is a 4-bed/2.0-bath multifamily listed at $22k.
Deal economics
- At list price, monthly cash flow is $2k ($23k/yr) — positive.
- The deal already cash-flows at list — no discount required.
- Meets the 1% rule at list price ($3k rent vs $22k).
- Recommended offer: $21k (3.0% below list) — sets the bar for market timing.
- Cap rate 111.6% vs local median 10.1% in Elmira — top-decile yield for the area; either an underpriced asset or a hidden risk that comps aren't pricing in. Stress-test before assuming the spread holds.
Location & tenants
- Location reads 62/100 on livability (#832 in NY) — a middle-class / working-renter tenant base. Strengths: cost of living A+, housing A+, health & safety A+; Watch: schools F, crime F, amenities F.
- Elmira City School District (urban): math 23% / reading 35% proficiency, ranked #580 of 590 in NY (top 98%) — low school quality limits family demand, transient renter base, plan for 1-2y turnover.
- Market conditions: 101 active listings in the ZIP; 2 comparable units currently listed for rent nearby; 91 units permitted in Chemung County in 2024 (63 in 5+ unit buildings).
Forward outlook
- Local home prices are declining (-3.0%/yr); year-one equity from $152 of loan paydown is wiped out by about $660 of value loss. Plan a longer hold.
- Chemung County population projected at -17% by 2050 — secular population decline; favor cash flow + early exit over multi-decade hold.
- At projected returns (-3.0% appreciation + 3.0% rent growth), your $6k cash investment doubles in ~1 year — after that, you're playing with house money.
Negotiation context
- It's been on market 36 days — a 3% lower offer ($21k) is reasonable based on typical stale-listing flexibility.
- 5 sale attempts since 21y ago with the ask held roughly flat each time — persistent listings suggest the price (not the market) is what's stuck; bring a comps-based counter.
- Current owner paid $19k; 16% above their basis — modest negotiation headroom, anchor on the comps not their cost.
Risks & watch-outs
- Watch-outs: built in 1920 — expect roof / HVAC / electrical / plumbing capex.
- Climate carrying-cost: moderate flood risk — expect insurance premiums to compound above CPI over the hold.
Questions for the listing agent
- It's been on market 36 days. Have you received any prior offers? Is the seller open to a 3% concession, seller financing, or rate buy-down credit?
- Built in 1920 — when were the roof, HVAC, electrical panel, plumbing, and water heater last replaced?
- Is there a deadline driving the sale (1031 exchange, divorce, estate, relocation)? That informs how much negotiation room exists.
- Schools are F-rated, which usually means shorter tenancies and higher turnover. Who's the typical renter profile here, and what's been the actual vacancy rate?
- Crime grade is F in this area — have there been break-ins, vandalism, or insurance claims at this property in the last 3 years? What carrier currently insures it and at what premium?
- The area grade is low — what's the realistic commute time and amenity access for the typical tenant pool here? Any planned neighborhood developments (good or bad) we should know about?
- What's the average days-on-market for RENTAL listings here right now (not sales)? A rising rental-DOM trend means longer vacancies and softer asking-rent achievability than the comps imply.
- What's the recent tenant-quality profile in this submarket — average credit score on applications, eviction rate, late-payment / NSF rate, and stable-employment percentage? A property-management company in the area should have these aggregated.
- How much new apartment / multifamily construction is in the pipeline within 1–3 miles? Heavy new supply (>2% of stock underway) typically softens rents 12–24 months out; light construction supports rent growth.
Investment metrics
- 1% rule
- 11.99% ✓
- Cap rate
- 111.63%
- Cash-on-cash
- 376.21%
- DSCR
- 17.74
- GRM
- 0.7
CMA / ARV
- ARV (on-the-fly)
- $98,428
- Comps found
- 12
Show comp detail 12 sales within ~0.75 mi
| Address | Dist | Beds/Ba | Sqft | Sold | Price | $/sf | Match |
|---|---|---|---|---|---|---|---|
| 200 Harmon St | 0.04mi | 4/2.0 | 2,095 (-6%) | 3mo | $24,900 | $12 | 85 |
| 239 Mount Zoar St | 0.30mi | 4/2.0 | 2,045 (-9%) | 6mo | $100,000 | $49 | 66 |
| 112 E Chemung Pl | 0.26mi | 4/2.0 | 2,009 (-10%) | 7mo | $45,000 | $22 | 65 |
| 336 Broadway St | 0.36mi | 4/2.0 | 1,957 (-12%) | 12mo | $93,100 | $48 | 53 |
| 307 South Ave | 0.59mi | 5/2.0 (+1) | 2,168 (-3%) | 12mo | $100,000 | $46 | 52 |
| 407 Elm St | 0.72mi | 4/2.0 | 2,372 (+6%) | 5mo | $105,000 | $44 | 52 |
| 260 Caldwell Ave | 0.44mi | 5/2.0 (+1) | 2,079 (-7%) | 13mo | $30,000 | $14 | 52 |
| 405 W 1st St | 0.58mi | 4/2.0 | 1,926 (-14%) | 8mo | $109,000 | $57 | 43 |
| 509 Columbia St | 0.74mi | 4/2.0 | 2,016 (-10%) | 8mo | $33,000 | $16 | 42 |
| 509 W 1st St | 0.69mi | 5/2.0 (+1) | 2,014 (-10%) | 5mo | $50,000 | $25 | 42 |
| 501 Davis St | 0.74mi | 4/2.0 | 2,014 (-10%) | 12mo | $82,900 | $41 | 39 |
| 356 W Second St | 0.62mi | 5/3.0 (+1) | 2,560 (+14%) | 8mo | $120,000 | $47 | 32 |
Match score weights: distance 35% · size 25% · config 20% · recency 20%. Top-matched comps best support the ARV.
Projected returns pro-forma
-3.0% appreciation · 3.0% rent growth · sell at horizon
- IRR
- —
- Equity multiple
- 20.40×
- Total profit
- $119,474
- Equity at exit
- $3,280
- IRR
- —
- Equity multiple
- 43.63×
- Total profit
- $262,578
- Equity at exit
- $1,902
Cash invested: $6,160 (down + closing). Projections, not guarantees.
Landlord ↔ Tenant lean methodology
- Overall (STATE)
- 15 Strongly Tenant-Friendly
- State New York
- 15 Strongly Tenant-Friendly · D+10
- County
- — inherits STATE
- City
- — inherits STATE
ZIP-level market 14904
- Home prices YoY
- -9.6%
- Active inventory
- 101
- Price-to-rent
- 1.4×
Monthly cashflow live
- Estimated rent
- $2,637 high interval (Pro) →
- Mortgage (P&I)
- −$115
- Tax est. 1.5%
- −$28 /mo · $330/yr
- Insurance
- −$9
- HOA
- −$0
- Vacancy / Maint / Mgmt
- −$554
- Net cashflow
- $1,931
Break-even live
2-unit breakdown (identical units grouped — click to expand)
| Units | Beds | Baths | Est. rent |
|---|---|---|---|
| 2× units | 2 | 1 | $2,636 |
| #1 | 2 | 1 | $1,318 |
| #2 | 2 | 1 | $1,318 |
| Total (2 units) | $2,637 | ||
UW: 25.0% down · 7.5% · 30yr · 1.5% tax · 5.0% vac · 8.0% maint · 8.0% mgmt
Financing live
Cash to close
- Down payment
- $5,500
- Closing costs
- $660
- Reserves months
- —
- Total cash needed
- —
Loan-product check · same deal, 3 products live
Conventional
25% down · 7.5% · 30yr
- Down + closing
- —
- Monthly P&I
- —
- Monthly cashflow
- —
- DSCR
- —
- Eligible?
- —
Personal DTI + credit; lowest rate.
DSCR
20% down · 8.5% · 30yr
- Down + closing
- —
- Monthly P&I
- —
- Monthly cashflow
- —
- DSCR
- —
- Eligible?
- —
No personal income docs; deal must DSCR.
Hard money
10% down · 12.0% · 12mo
- Down + closing
- —
- Monthly P&I
- —
- Monthly cashflow
- —
- DSCR
- —
- Eligible?
- —
Short-term bridge; refi at stabilization.
Rent comps 2 comps
| Address | Beds | Baths | Sqft | Rent | $/sqft | DOM | Units | Dist |
|---|---|---|---|---|---|---|---|---|
| 514 W 1st St Unit A Elmira, NY | 4.0 | 1.0 | 1416 | $1,275 | $0.90 | 43d | 1 | 0.71mi |
| 355 W Clinton St Unit 1 Elmira, NY | 3.0 | 1.5 | 1650 | $1,400 | $0.85 | 43d | 1 | 0.75mi |
Listing history 13 events
-
2026-04-28status Pending
-
2026-03-23$22,000 Active
-
2021-01-07historical
-
2020-09-22$29,000
-
2019-04-16historical
-
2019-01-09$19,900
-
2012-01-12soldstatus $19,000
-
2007-11-17historical
-
2007-05-17$35,000
-
2005-12-19soldstatus $29,500
-
2005-12-16soldstatus $29,500
-
2005-03-25$31,000
-
2001-04-13soldstatus $30,000
ⓘ Source: listings_history table (triggers on properties + properties_extension) + one-shot
backfill from property_details.listing_events for pre-trigger history.
Climate risk First Street
- Flood 5/10 Major FEMA zone X (shaded) · 27% chance over 30 yrs
- Wildfire 2/10 Low
- Heat 3/10 Moderate 7 d/yr ≥96°F today · 16 d/yr by 30 yrs out
- Wind 2/10 Low 100% chance of damaging wind over 30 yrs
- Air quality 1/10 Low 0 unhealthy d/yr today · 0 by 30 yrs out
Nearby sold comps map
Loading sold comps map…
Walkable amenities ~0.75 mi
Loading nearby amenities…
Taxation est. · year 1
- Rental income
- $31,644
- − Mortgage interest
- −$1,232
- − Property taxes
- −$330
- − Insurance
- −$110
- − Repairs & maintenance
- −$2,532
- − Management
- −$2,532
- − Depreciation
- −$640
- Taxable income
- $24,269
- Est. tax owed @ 24.0%
- −$5,824
- After-tax cash flow
- $17,350/yr
For passive investors: Depreciation is non-cash, so a rental often shows a tax loss while cash-flowing — sheltering income. Rental losses are passive: they offset passive income freely, and up to $25,000/yr can offset ordinary (W-2) income if you actively participate and your MAGI is under $100k (phasing out to $0 by $150k); unused losses carry forward. On sale, claimed depreciation is recaptured at up to 25%, and gains may owe capital-gains tax (a 1031 exchange can defer both). Figures are a year-1 estimate at your 24.0% rate — not tax advice; consult a CPA.
Schools (NCES district)
- District
- Elmira City School District
- NCES district ID
- 3610560
- Math proficiency
- 23% ▼ -7.00%
- Reading proficiency
- 35% ▲ 7.00%
- Median HH income
- $40,180
- Composite
- 24.39/100
- National rank
- #7688
- State rank
- #580 of 590 in NY
Livability — Elmira
- Score
- 62/100
- State rank
- #832
- US rank
- #16139
Category grades
Schools grade is shown separately in the Schools card above.
Census & demographics
- Census place
- Elmira, NY
- City population
- 14,276
- Population (ZIP)
- 14,276
Population outlook (Chemung County) Hauer SSP2
- Today (2025)
- 82,931 people
- By 2030
- 80,356 · -3.1%
- By 2040
- 74,745 · -9.9%
- By 2050
- 69,012 · -16.8%
- By 2075
- 55,689 · -32.8%
- By 2100
- 41,428 · -50.0%
Race, ethnicity, and origin ACS 2023
- Neighborhood character
- Predominantly White (83%)
- Race & ethnicity
- White 83% Two or more races 7% Black 7% Hispanic / Latino 5% Native American 1%
- Common ancestry
- Romanian 7% Lithuanian 3% Slovak 2%
- Foreign-born
- 2% · Canada, Jamaica, Dominican Republic
- Languages at home
- 97% English-only · Spanish 2%
Political lean MEDSL · Chemung
- 2024 margin
- R (+16.8) · D 41.6% · R 58.4%
- 2008→2024 swing
- -15.6pp toward R · 2008: -1.2pp · 2024: -16.8pp
- All cycles
- 2024: R+16.8 2020: R+13.4 2016: R+20.0 2012: R+2.9 2008: R+1.2
Not yet ingested
- Civics
- —
Market trends
- HPI YoY
- ▼ -23.33%
- Current HPI
- 220.688
- Rent YoY
- —
- Metro
- —
- State GDP YoY
- ▲ 2.60%
- F500 in state
- 92
Industry mix (Fortune 500 HQ in NY)
| Industry | F500 HQs | Revenue |
|---|---|---|
| Financial Services | 10 | $950B |
|
||
| Consumer Goods | 9 | $162B |
|
||
| Insurance | 4 | $225B |
|
||
| Telecommunications | 2 | $144B |
|
||
| Pharmaceuticals | 2 | $112B |
|
||
| Media / Entertainment | 2 | $69B |
|
||
Price history
-26.7% since first listed13 events — show timeline
- 2026-04-28 Pending — UNYREIS
- 2026-03-23 Listed $22,000 UNYREIS
- 2021-01-07 Listing Removed — UNYREIS
- 2020-09-22 Listed $29,000 UNYREIS
- 2019-04-16 Listing Removed — UNYREIS
- 2019-01-09 Listed $19,900 UNYREIS
- 2012-01-12 Sold (Public Records) $19,000 Public Records
- 2007-11-17 Listing Removed — UNYREIS
- 2007-05-17 Listed $35,000 UNYREIS
- 2005-12-19 Sold (Public Records) $29,500 Public Records
- 2005-12-16 Sold (MLS) $29,500 UNYREIS
- 2005-03-25 Listed $31,000 UNYREIS
- 2001-04-13 Sold (Public Records) $30,000 Public Records
Property tax history
+33.3%/yrLatest (2025): $31,270 · +452.2% YoY. Source: county tax records.
Cash-flow waterfall
monthlySold comps — $/sqft
last 12 mo · ≤1 miLoading sold comps…