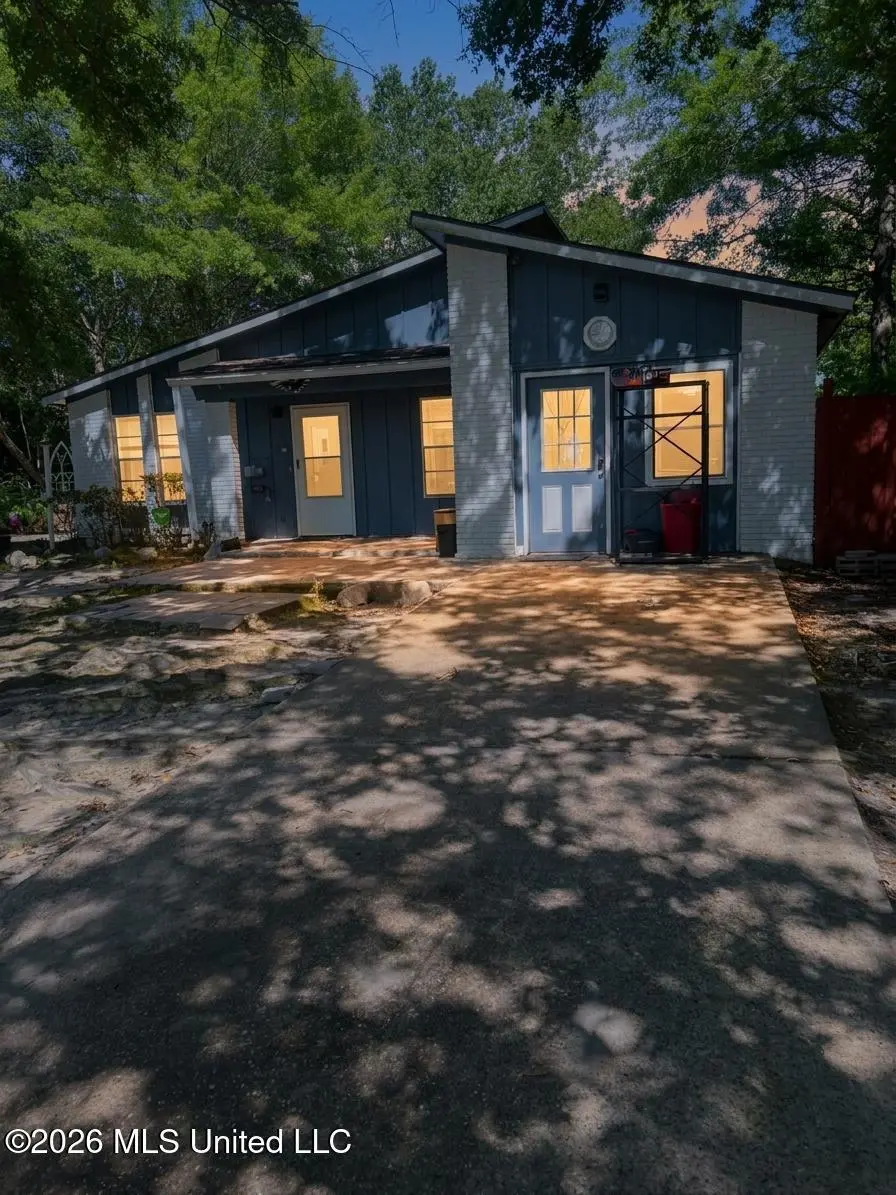
916 E Birch Dr · Gulfport, MS
Flood risk 1/10 · Minimal
- FEMA flood zone
- X (unshaded)
- Chance of flooding over 30 yrs
- 0.0%
- Est. flood insurance / yr
- $507 – $1,088
Fire risk 3/10 · Minor
- Est. fire insurance / yr
- $1,241 – $2,305
Heat risk 10/10 · Severe
- Hot days now (above 107°F)
- 7 days/yr
- Hot days in 30 yrs
- 22 days/yr
Wind risk 9/10 · Severe
- Chance of severe wind over 30 yrs
- 99.0%
Air-quality risk 1/10 · Minimal
- Unhealthy air days now
- 0 days/yr
- Unhealthy air days in 30 yrs
- 0 days/yr
Risk factors via First Street. Map © Google.
Why this score? — see what drove the B grade
The composite is a weighted blend of 9 inputs, each scored 0–100. Each bar is that input's sub-score; the figure is the points it added to the 100-point composite (weight × sub-score).
- Cash flow +27.0/30.0
- ARV discount +15.0/15.0
- DSCR +9.3/10.0
- 1% rule +7.1/10.0
- Rent growth +4.2/5.0
- Schools +4.2/10.0
- Livability +3.7/5.0
- Condition / age +2.5/5.0
- Appreciation +0.0/10.0
$124,000
🖨 Deal sheet 📄 Offer letter ✓ Due diligence
Listing remarks
916 E Birch Dr in Gulfport offers the opportunity to create something truly your own on the Mississippi Gulf Coast. This spacious fixer-upper is full of potential and features a functional layout with generous living spaces, 3 bedrooms, 2 bathrooms, an additional bonus room that could be used as a home office, playroom, second living area, hobby space, or extra storage, and plenty of room to customize to fit your needs and vision. Inside, you'll find comfortable living areas filled with natural light, durable flooring throughout much of the home, ample kitchen cabinet space, and a layout designed for practical everyday living. One bathroom features double sinks for added convenience, while
Key facts
- Large backyard
- Bonus room
- Functional layout
Tags
Property features AI
Exterior
- Parking: Concrete driveway; Direct access; No garage
- Utilities: Public water; Sewer connected; Electricity connected; Sewer listed as unknown (detail)
- Home design: Single-family house; One story; Fixer condition
- Construction: Brick and wood siding exterior; Slab foundation; Composition/shingle roof; Built in public records (year built source)
- Exterior features: Front porch; Rear porch; Patio; Courtyard; Garden; Shed(s); Chain link and privacy fencing; City lot
Interior
- Kitchen: Electric range; Microwave
- Flooring: Carpet; Tile
- Bathrooms: 2 full bathrooms
- Heating & cooling: Central heating; Central air conditioning
- Interior features: Ceiling fans; Double vanity in bathroom; Eat-in kitchen; Granite countertops; Storage space; Deadbolt locks
Neighborhood map
What this means for you Summary
Snapshot
- This is a 3-bed/1.0-bath single-family listed at $124k.
Deal economics
- At list price, monthly cash flow is $347 ($4k/yr) — positive.
- The deal already cash-flows at list — no discount required.
- Meets the 1% rule at list price ($1k rent vs $124k).
- Recommended offer: $120k (3.0% below list) — sets the bar for market timing.
- Cap rate 9.7% vs local median 4.9% in Gulfport — top-decile yield for the area; either an underpriced asset or a hidden risk that comps aren't pricing in. Stress-test before assuming the spread holds.
Location & tenants
- Location reads 73/100 on livability (#15 in MS) — a middle-class / working-renter tenant base. Strengths: cost of living A+, housing A+, health & safety A+; Watch: schools D, amenities F, commute F.
- Harrison County School District (rural): math 52% / reading 46% proficiency, ranked #14 of 130 in MS (top 11%) — families likely to look elsewhere, expect single-tenant / working-renter base with shorter leases; 62% free/reduced lunch — lower-income household profile, screen leases tightly.
- Market conditions: Rents rising fast (+7.0%/yr); 763 active listings in the ZIP; 15 comparable units currently listed for rent nearby; rentals lingering (median 44d on market — plan ~5-8 weeks vacancy on turnover, expect pricing pressure); 60% of comp listings sitting > 30 days — soft ceiling on asking rent; 2,194 units permitted in Harrison County in 2024 (0 in 5+ unit buildings).
Forward outlook
- Local home prices are declining (-3.0%/yr); year-one equity from $857 of loan paydown is wiped out by about $4k of value loss. Plan a longer hold.
- Harrison County population projected at +27% by 2050 — long-run rental-demand tailwind backs the buy-and-hold thesis.
- At projected returns (-3.0% appreciation + 7.0% rent growth), your $35k cash investment doubles in ~7 years — after that, you're playing with house money.
Negotiation context
- It's been on market 38 days — a 3% lower offer ($120k) is reasonable based on typical stale-listing flexibility.
Risks & watch-outs
- Climate carrying-cost: severe wind risk, 99% chance of damaging wind over 30y; extreme-heat days projected 7→22/yr by 2055 (HVAC capex compounding) — expect insurance premiums to compound above CPI over the hold.
Questions for the listing agent
- It's been on market 38 days. Have you received any prior offers? Is the seller open to a 3% concession, seller financing, or rate buy-down credit?
- Is there a deadline driving the sale (1031 exchange, divorce, estate, relocation)? That informs how much negotiation room exists.
- Schools are D-rated, which usually means shorter tenancies and higher turnover. Who's the typical renter profile here, and what's been the actual vacancy rate?
- What's the average days-on-market for RENTAL listings here right now (not sales)? A rising rental-DOM trend means longer vacancies and softer asking-rent achievability than the comps imply.
- What's the recent tenant-quality profile in this submarket — average credit score on applications, eviction rate, late-payment / NSF rate, and stable-employment percentage? A property-management company in the area should have these aggregated.
- How much new for-sale + rental construction is in the pipeline within 1–3 miles? Heavy new supply typically softens prices + rents 12–24 months out; constrained supply supports both.
Investment metrics
- 1% rule
- 1.21% ✓
- Cap rate
- 9.66%
- Cash-on-cash
- 12.01%
- DSCR
- 1.53
- GRM
- 6.9
CMA / ARV
- ARV (median comp)
- $181,979
- List price
- $124,000
- Delta
- -31.86%
- Verdict
- UNDERPRICED
- Comps
- 20 within 1.0 mi
Show comp detail 12 sales within ~0.75 mi
| Address | Dist | Beds/Ba | Sqft | Sold | Price | $/sf | Match |
|---|---|---|---|---|---|---|---|
| 921 Sweetgum Dr | 0.22mi | 3/1.5 | 1,023 (-2%) | 8mo | $119,000 | $116 | 78 |
| 801 Latimer Rd | 0.17mi | 3/1.5 | 1,100 (+6%) | 12mo | $124,900 | $114 | 71 |
| 2309 Cottonwood Dr | 0.37mi | 3/2.0 | 1,128 (+8%) | 8mo | $167,900 | $149 | 58 |
| 2501 Woolmarket St | 0.45mi | 3/1.5 | 1,104 (+6%) | 12mo | $133,000 | $120 | 57 |
| 9 Joanna Ln | 0.34mi | 3/2.0 | 1,149 (+10%) | 8mo | $170,000 | $148 | 56 |
| 2614 George St | 0.65mi | 3/1.5 | 1,080 (+4%) | 7mo | $139,900 | $130 | 56 |
| 504 Harvey Ave | 0.56mi | 3/1.5 | 1,144 (+10%) | 1mo | $115,000 | $101 | 54 |
| 10569 Sharp Blvd | 0.72mi | 2/2.0 (-1) | 1,050 (+1%) | 12mo | $139,900 | $133 | 46 |
| 10741 E Bay Tree Dr | 0.57mi | 3/2.0 | 1,172 (+13%) | 8mo | $142,999 | $122 | 42 |
| 13372 Chris Dr | 0.70mi | 3/2.0 | 1,137 (+9%) | 8mo | $148,000 | $130 | 41 |
| 11389 Jessica Dr | 0.70mi | 3/2.0 | 1,196 (+15%) | 1mo | $198,000 | $166 | 38 |
| 10589 E Bay Tree Dr | 0.70mi | 3/2.0 | 1,192 (+15%) | 6mo | $152,200 | $128 | 34 |
Match score weights: distance 35% · size 25% · config 20% · recency 20%. Top-matched comps best support the ARV.
Projected returns pro-forma
-3.0% appreciation · 6.99% rent growth · sell at horizon
- IRR
- 5.9%
- Equity multiple
- 1.24×
- Total profit
- $8,286
- Equity at exit
- $18,489
- IRR
- 18.5%
- Equity multiple
- 2.83×
- Total profit
- $63,553
- Equity at exit
- $10,721
Cash invested: $34,720 (down + closing). Projections, not guarantees.
Landlord ↔ Tenant lean methodology
- Overall (STATE)
- 90 Strongly Landlord-Friendly
- State Mississippi
- 90 Strongly Landlord-Friendly · R+11
- County
- — inherits STATE
- City
- — inherits STATE
ZIP-level market 39503
- Home prices YoY
- -21.5%
- Rents YoY
- 7.0%
- Active inventory
- 763
- Price-to-rent
- 6.9×
Monthly cashflow live
- Estimated rent
- $1,495 high interval (Pro) →
- Mortgage (P&I)
- −$650
- Tax from tax record
- −$131 /mo · $1,577/yr
- Insurance
- −$52
- HOA
- −$0
- Vacancy / Maint / Mgmt
- −$314
- Net cashflow
- $347
Break-even live
UW: 25.0% down · 7.5% · 30yr · 1.5% tax · 5.0% vac · 8.0% maint · 8.0% mgmt
Financing live
Cash to close
- Down payment
- $31,000
- Closing costs
- $3,720
- Reserves months
- —
- Total cash needed
- —
Loan-product check · same deal, 3 products live
Conventional
25% down · 7.5% · 30yr
- Down + closing
- —
- Monthly P&I
- —
- Monthly cashflow
- —
- DSCR
- —
- Eligible?
- —
Personal DTI + credit; lowest rate.
DSCR
20% down · 8.5% · 30yr
- Down + closing
- —
- Monthly P&I
- —
- Monthly cashflow
- —
- DSCR
- —
- Eligible?
- —
No personal income docs; deal must DSCR.
Hard money
10% down · 12.0% · 12mo
- Down + closing
- —
- Monthly P&I
- —
- Monthly cashflow
- —
- DSCR
- —
- Eligible?
- —
Short-term bridge; refi at stabilization.
Rent comps 15 comps
| Address | Beds | Baths | Sqft | Rent | $/sqft | DOM | Units | Dist |
|---|---|---|---|---|---|---|---|---|
| 11310 Fairfield Ln Gulfport, MS | 3.0 | 2.0 | 1084 | $1,625 | $1.50 | 44d | 1 | 0.54mi |
| 10669 E Bay Tree Dr Gulfport, MS | 3.0 | 2.0 | 1200 | $1,425 | $1.19 | 21d | 1 | 0.61mi |
| 12271 Dedeaux Rd Gulfport, MS | 3.0 | 1.5 | 1462 | $1,350 | $0.92 | 44d | 1 | 0.62mi |
| 12062 Jessica Cir Gulfport, MS | 3.0 | 2.0 | 1385 | $1,700 | $1.23 | 13d | 1 | 0.65mi |
| 13181 Warren Dr Gulfport, MS | 3.0 | 2.0 | 1188 | $1,375 | $1.16 | 44d | 1 | 0.67mi |
| 13242 Warren Dr Gulfport, MS | 2.0 | 2.0 | 1012 | $1,100 | $1.09 | 44d | 1 | 0.71mi |
| 11312 Jessica Dr Gulfport, MS | 3.0 | 2.0 | 1092 | $1,625 | $1.49 | 21d | 1 | 0.71mi |
| 10596 E Bay Tree Dr Gulfport, MS | 2.0 | 2.0 | 1047 | $1,200 | $1.15 | 44d | 1 | 0.73mi |
| 12147 Prudie Cir Gulfport, MS | 3.0 | 2.0 | 1100 | $975 | $0.89 | 44d | 1 | 0.78mi |
| 12040 Highland Ave Gulfport, MS | 3.0 | 2.0 | 1019 | $950 | $0.93 | 13d | 1 | 0.86mi |
| 1009 Michelle Dr Gulfport, MS | 4.0 | 2.0 | 1254 | $1,650 | $1.32 | 44d | 1 | 1.33mi |
| 11200 Three Rivers Rd Gulfport, MS | 2.0 | 2.0 | 1042 | $1,147 | $1.10 | 44d | 1 | 1.39mi |
| 11200 Three Rivers Rd Gulfport, MS | 3.0 | 2.0 | 1124 | $1,445 | $1.29 | 13d | 1 | 1.39mi |
| 12450 Three Rivers Rd Gulfport, MS | 3.0 | 2.0 | 1098 | $1,295 | $1.18 | 44d | 1 | 1.45mi |
| 13070 Tracewood Dr Gulfport, MS | 3.0 | 2.0 | 1190 | $1,400 | $1.18 | 21d | 1 | 1.49mi |
Listing history 16 events
-
2026-06-18days on market $124,000 Active 38 DOM
-
2026-06-17days on market $124,000 Active 37 DOM
-
2026-06-16days on market $124,000 Active 36 DOM
-
2026-06-15days on market $124,000 Active 35 DOM
-
2026-06-14days on market $124,000 Active 33 DOM
-
2026-06-13pricedays on market $124,000 Active 32 DOM
-
2026-06-10days on market $139,000 Active 30 DOM
-
2026-06-09days on market $139,000 Active 29 DOM
-
2026-06-08days on market $139,000 Active 28 DOM
-
2026-06-07days on market $139,000 Active 27 DOM
-
2026-06-02days on market $139,000 Active 22 DOM
-
2026-06-01days on market $139,000 Active 21 DOM
-
2026-05-31days on market $139,000 Active 20 DOM
-
2026-05-30days on market $139,000 Active 19 DOM
-
2026-05-11$139,000 Active 1736-char remark
-
2004-12-15soldstatus
ⓘ Source: listings_history table (triggers on properties + properties_extension) + one-shot
backfill from property_details.listing_events for pre-trigger history.
Tax reassessment forecast MS · Resets to sale price
- Current annual tax
- $1,577 · $131/mo
- Projected year-2 tax
- $1,577 · $131/mo
- Expected delta
- $0/yr ($0/mo · 0.0%)
ⓘ Screening estimate from a state-policy table — verify with the county assessor before closing.
Climate risk First Street
- Flood 1/10 Low FEMA zone X (unshaded) · 0% chance over 30 yrs
- Wildfire 3/10 Moderate
- Heat 10/10 Extreme 7 d/yr ≥107°F today · 22 d/yr by 30 yrs out
- Wind 9/10 Extreme 99% chance of damaging wind over 30 yrs
- Air quality 1/10 Low 0 unhealthy d/yr today · 0 by 30 yrs out
Nearby sold comps map
Loading sold comps map…
Walkable amenities ~0.75 mi
Loading nearby amenities…
Taxation est. · year 1
- Rental income
- $17,937
- − Mortgage interest
- −$6,946
- − Property taxes
- −$1,577
- − Insurance
- −$620
- − Repairs & maintenance
- −$1,435
- − Management
- −$1,435
- − Depreciation
- −$3,607
- Taxable income
- $2,316
- Est. tax owed @ 24.0%
- −$556
- After-tax cash flow
- $3,614/yr
For passive investors: Depreciation is non-cash, so a rental often shows a tax loss while cash-flowing — sheltering income. Rental losses are passive: they offset passive income freely, and up to $25,000/yr can offset ordinary (W-2) income if you actively participate and your MAGI is under $100k (phasing out to $0 by $150k); unused losses carry forward. On sale, claimed depreciation is recaptured at up to 25%, and gains may owe capital-gains tax (a 1031 exchange can defer both). Figures are a year-1 estimate at your 24.0% rate — not tax advice; consult a CPA.
Schools (NCES district)
- District
- Harrison County School District
- NCES district ID
- 2801770
- Math proficiency
- 52% ▼ -4.00%
- Reading proficiency
- 46% ▼ -4.00%
- Median HH income
- $46,504
- Composite
- 41.66/100
- National rank
- #3419
- State rank
- #14 of 130 in MS
Livability — Gulfport
- Score
- 73/100
- State rank
- #15
- US rank
- #5010
Category grades
Schools grade is shown separately in the Schools card above.
Census & demographics
- Census place
- Gulfport, MS
- County
- Harrison County · 178,171 people
- City population
- 96,188
- Metro
- Gulfport-Biloxi, MS
- Population (ZIP)
- 55,059
- Household income
- $62,641
- Rent vs Own
- Severe rent burden
- 1686.0
Population outlook (Harrison County) Hauer SSP2
- Today (2025)
- 228,444 people
- By 2030
- 241,942 · +5.9%
- By 2040
- 267,531 · +17.1%
- By 2050
- 291,062 · +27.4%
- By 2075
- 346,711 · +51.8%
- By 2100
- 378,165 · +65.5%
Race, ethnicity, and origin ACS 2023
- Neighborhood character
- Diverse neighborhood (Simpson 0.58)
- Race & ethnicity
- White 58% Black 27% Two or more races 9% Hispanic / Latino 6% Asian 2%
- Hispanic origin (detail)
- Mexican 2% Puerto Rican 1%
- Common ancestry
- Lithuanian 5% Slovak 1% Portuguese 1%
- Foreign-born
- 3% · Canada
- Languages at home
- 95% English-only · Spanish 3%
Political lean MEDSL · Harrison
- 2024 margin
- Strong R (+28.9) · D 35.0% · R 63.9% · Other 1.1%
- 2008→2024 swing
- -2.9pp toward R · 2008: -26.0pp · 2024: -28.9pp
- All cycles
- 2024: R+28.9 2020: R+25.2 2016: R+30.7 2012: R+26.6 2008: R+26.0
Not yet ingested
- Civics
- —
Market trends
- HPI YoY
- ▼ -51.39%
- Current HPI
- 187.285
- Rent YoY
- ▲ 6.99%
- Metro
- Gulfport-Biloxi, MS
- State GDP YoY
- —
- F500 in state
- 0
Price history
-10.8% since first listed3 events — show timeline
- 2026-06-12 Price Changed $124,000 MLSU
- 2026-05-11 Listed $139,000 MLSU
- 2004-12-15 Sold (Public Records) — Public Records
Property tax history
+0.4%/yrLatest (2025): $1,577 · +3.9% YoY. Source: county tax records.
Cash-flow waterfall
monthlySold comps — $/sqft
last 12 mo · ≤1 miLoading sold comps…