 6-Plex
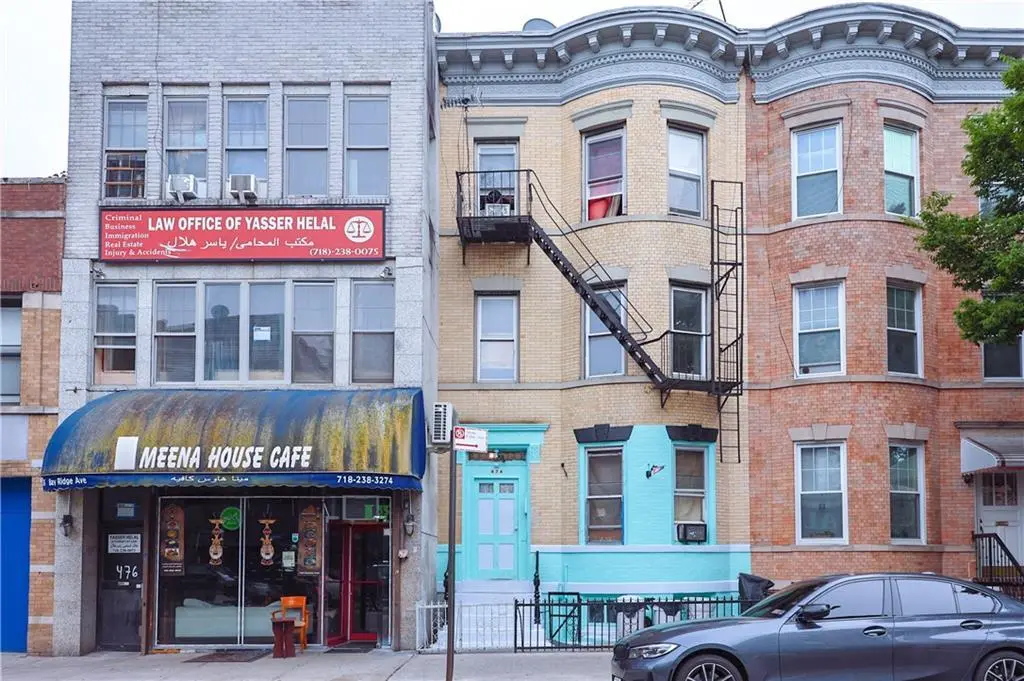
474 Bay Ridge Ave · New York, NY
Flood risk 1/10 · Minimal
- FEMA flood zone
- X (unshaded)
- Chance of flooding over 30 yrs
- 0.0%
- Est. flood insurance / yr
- $507 – $1,088
Fire risk 1/10 · Minimal
- Est. fire insurance / yr
- $691 – $1,283
Heat risk 7/10 · Major
- Hot days now (above 97°F)
- 7 days/yr
- Hot days in 30 yrs
- 16 days/yr
Wind risk 6/10 · Moderate
- Chance of severe wind over 30 yrs
- 61.0%
Air-quality risk 4/10 · Minor
- Unhealthy air days now
- 5 days/yr
- Unhealthy air days in 30 yrs
- 7 days/yr
Risk factors via First Street. Map © Google.
Why this score? — see what drove the A- grade
The composite is a weighted blend of 9 inputs, each scored 0–100. Each bar is that input's sub-score; the figure is the points it added to the 100-point composite (weight × sub-score).
- Cash flow +30.0/30.0
- 1% rule +10.0/10.0
- DSCR +10.0/10.0
- Appreciation +7.8/10.0
- ARV discount +7.5/15.0
- Rent growth +5.0/5.0
- Schools +5.0/10.0
- Livability +3.8/5.0
- Condition / age +2.5/5.0
$999,000
🖨 Deal sheet 📄 Offer letter ✓ Due diligence
Multi-family units
County records classify this as Multi-Family (2-4 Unit). Listing-text estimate: 6 units. estimate disagrees with records
Listing remarks
Rare opportunity to own a solid brick 6-family building in the heart of Bay Ridge, just minutes from the neighborhood's vibrant commercial corridor. This income-producing property features 4 vacant apartments, including the front and rear units on both the first and second floors, two tenants occupied on 3rd floor front and rear. Offering exceptional flexibility for investors or owner-occupants. Situated on a 20' x 96' lot with a building size of approximately 20' x 55', this property offers strong upside potential in one of Brooklyn's most desirable neighborhoods. Annual property taxes are approximately $10,385. Conveniently located near shopping, dining, transportation, and local ameniti
Key facts
- Front and rear units
- 6-family building
- 20 x 96 lot
Tags
Property features AI
Finance
- Other: Property located in Brooklyn (Bay Ridge area)
- Financial info: Financing considered: bank mortgage, cash, or exchange
Exterior
- Parking: No designated parking
- Utilities: Electric: 110V, 220V, circuit breakers; Hot water: Oil; Heating fuel: Oil
- Home design: Attached residential building; Flat roof; Building footprint approximately 1,100 sq ft; Building dimensions 55.00 x 20.00; Zoned R5B
- Construction: Brick exterior; Poured concrete foundation
- Exterior features: Front yard; Back yard
Interior
- Kitchen: Includes refrigerator and stove
- Bedrooms: Total of 11 rooms (includes bedrooms and living spaces)
- Flooring: Carpeting; Laminate floors; Tile floors
- Bathrooms: 7 full bathrooms
- Heating & cooling: Oil-fired hot water (steam/radiator) heating; No central AC units
- Interior features: Refrigerator; Stove
Neighborhood map
What this means for you Summary
Snapshot
- This is a 6 × 5-bed/7.0-bath units multifamily listed at $999k.
Deal economics
- At list price, monthly cash flow is $9k ($106k/yr) — positive. Per door: $1k/mo.
- The deal already cash-flows at list — no discount required.
- Meets the 1% rule at list price ($19k rent vs $999k).
- Recommended offer: $984k (1.5% below list) — sets the bar for market timing.
- Cap rate 16.9% vs local median 2.6% in New York — top-decile yield for the area; either an underpriced asset or a hidden risk that comps aren't pricing in. Stress-test before assuming the spread holds.
Location & tenants
- Location reads 75/100 on livability (#268 in NY, #4,188 nationally) — a middle-class / working-renter tenant base. Strengths: amenities A+, commute A+, health & safety A; Watch: crime F, cost of living F.
- Market conditions: Rents rising fast (+11.0%/yr); 271 active listings in the ZIP; 10,063 units permitted in Kings County in 2024 (9,789 in 5+ unit buildings).
- At $19,393/mo this rent would consume 333% of the median local household income ($70k/yr) (locally 6563% of renters already pay >50% of income on rent) — very limited rent-growth headroom before tenants either downsize or default.
Forward outlook
- In year one you build about $63k of equity ($7k loan paydown + $56k appreciation (5.6% local appreciation)).
- Kings County population projected at +13% by 2050 — modest demand growth; plan on rents tracking national, not racing it.
- At projected returns (5.6% appreciation + 8.0% rent growth), your $280k cash investment doubles in ~2 years — after that, you're playing with house money.
- By year 2, paydown + projected appreciation supports a ~$101k cash-out refi (75% LTV) — recoverable capital for the next deal without selling this one.
Negotiation context
- It's been on market 20 days — a 2% lower offer ($984k) is reasonable based on typical stale-listing flexibility.
- 3 sale attempts since 11y ago with the ask held roughly flat each time — persistent listings suggest the price (not the market) is what's stuck; bring a comps-based counter.
Risks & watch-outs
- Watch-outs: built in 1910 — expect roof / HVAC / electrical / plumbing capex.
- Climate carrying-cost: major wind risk, 61% chance of damaging wind over 30y; extreme-heat days projected 7→16/yr by 2055 (HVAC capex compounding) — expect insurance premiums to compound above CPI over the hold.
Questions for the listing agent
- Can we see the unit-by-unit rent roll, current vacancy, and any below-market leases? What's the average tenancy length?
- What capital expenditures (roof, boiler, parking lot, exteriors) have been made in the last 5 years, and what's planned in the next 2?
- Built in 1910 — when were the roof, HVAC, electrical panel, plumbing, and water heater last replaced?
- Is there a deadline driving the sale (1031 exchange, divorce, estate, relocation)? That informs how much negotiation room exists.
- Schools are B-rated — typically a magnet for longer-tenancy family renters. What's the average tenant stay here, and is there a school-zone premium baked into asking?
- Crime grade is F in this area — have there been break-ins, vandalism, or insurance claims at this property in the last 3 years? What carrier currently insures it and at what premium?
- What's the average days-on-market for RENTAL listings here right now (not sales)? A rising rental-DOM trend means longer vacancies and softer asking-rent achievability than the comps imply.
- What's the recent tenant-quality profile in this submarket — average credit score on applications, eviction rate, late-payment / NSF rate, and stable-employment percentage? A property-management company in the area should have these aggregated.
- How much new apartment / multifamily construction is in the pipeline within 1–3 miles? Heavy new supply (>2% of stock underway) typically softens rents 12–24 months out; light construction supports rent growth.
Investment metrics
- 1% rule
- 1.94% ✓
- Cap rate
- 16.88%
- Cash-on-cash
- 37.80%
- DSCR
- 2.68
- GRM
- 4.3
CMA / ARV
No comps found within radius.
Projected returns pro-forma
5.63% appreciation · 8.0% rent growth · sell at horizon
- IRR
- 51.1%
- Equity multiple
- 4.33×
- Total profit
- $930,482
- Equity at exit
- $604,995
- IRR
- 50.5%
- Equity multiple
- 10.15×
- Total profit
- $2,558,129
- Equity at exit
- $1,077,792
Cash invested: $279,720 (down + closing). Projections, not guarantees.
Landlord ↔ Tenant lean methodology
- Overall (CITY)
- 0 Strongly Tenant-Friendly
- State New York
- 15 Strongly Tenant-Friendly · D+10
- County
- — inherits STATE
- City New York
- 0 Strongly Tenant-Friendly · D+34
ZIP-level market 11220
- Home prices YoY
- 2.5%
- Rents YoY
- 11.0%
- Active inventory
- 271
- Price-to-rent
- 25.8×
Monthly cashflow live
- Estimated rent
- $19,393 medium interval (Pro) →
- Mortgage (P&I)
- −$5,239
- Tax from tax record
- −$855 /mo · $10,258/yr
- Insurance
- −$416
- HOA
- −$0
- Vacancy / Maint / Mgmt
- −$4,073
- Net cashflow
- $8,811
Break-even live
6-unit breakdown (identical units grouped — click to expand)
| Units | Beds | Baths | Est. rent |
|---|---|---|---|
| 6× units | 5 | 7 | $19,392 |
| #1 | 5 | 7 | $3,232 |
| #2 | 5 | 7 | $3,232 |
| #3 | 5 | 7 | $3,232 |
| #4 | 5 | 7 | $3,232 |
| #5 | 5 | 7 | $3,232 |
| #6 | 5 | 7 | $3,232 |
| Total (6 units) | $19,393 | ||
UW: 25.0% down · 7.5% · 30yr · 1.5% tax · 5.0% vac · 8.0% maint · 8.0% mgmt
Financing live
Cash to close
- Down payment
- $249,750
- Closing costs
- $29,970
- Reserves months
- —
- Total cash needed
- —
Loan-product check · same deal, 3 products live
Conventional
25% down · 7.5% · 30yr
- Down + closing
- —
- Monthly P&I
- —
- Monthly cashflow
- —
- DSCR
- —
- Eligible?
- —
Personal DTI + credit; lowest rate.
DSCR
20% down · 8.5% · 30yr
- Down + closing
- —
- Monthly P&I
- —
- Monthly cashflow
- —
- DSCR
- —
- Eligible?
- —
No personal income docs; deal must DSCR.
Hard money
10% down · 12.0% · 12mo
- Down + closing
- —
- Monthly P&I
- —
- Monthly cashflow
- —
- DSCR
- —
- Eligible?
- —
Short-term bridge; refi at stabilization.
Listing history 13 events
-
2026-06-18days on market $999,000 Active 20 DOM
-
2026-06-17days on market $999,000 Active 19 DOM
-
2026-06-16days on market $999,000 Active 18 DOM
-
2026-06-15days on market $999,000 Active 17 DOM
-
2026-06-13days on market $999,000 Active 15 DOM
-
2026-06-09days on market $999,000 Active 11 DOM
-
2026-06-08days on market $999,000 Active 10 DOM
-
2026-06-08days on market $999,000 Active 9 DOM
-
2026-06-04days on market $999,000 Active 6 DOM
-
2026-06-03days on market $999,000 Active 5 DOM
-
2026-06-02days on market $999,000 Active 4 DOM
-
2026-06-01days on market $999,000 Active 3 DOM
-
2026-05-31days on market $999,000 Active 2 DOM
ⓘ Source: listings_history table (triggers on properties + properties_extension) + one-shot
backfill from property_details.listing_events for pre-trigger history.
Tax reassessment forecast NY · Partial reset (capped growth)
- Current annual tax
- $10,258 · $855/mo
- Projected year-2 tax
- $13,571 · $1,131/mo
- Expected delta
- +$3,313/yr (+$276/mo · 32.3%)
ⓘ Screening estimate from a state-policy table — verify with the county assessor before closing.
Climate risk First Street
- Flood 1/10 Low FEMA zone X (unshaded) · 0% chance over 30 yrs
- Wildfire 1/10 Low
- Heat 7/10 Severe 7 d/yr ≥97°F today · 16 d/yr by 30 yrs out
- Wind 6/10 Major 61% chance of damaging wind over 30 yrs
- Air quality 4/10 Moderate 5 unhealthy d/yr today · 7 by 30 yrs out
Nearby sold comps map
Loading sold comps map…
Walkable amenities ~0.75 mi
Loading nearby amenities…
Taxation est. · year 1
- Rental income
- $232,716
- − Mortgage interest
- −$55,960
- − Property taxes
- −$10,258
- − Insurance
- −$4,995
- − Repairs & maintenance
- −$18,617
- − Management
- −$18,617
- − Depreciation
- −$29,062
- Taxable income
- $95,207
- Est. tax owed @ 24.0%
- −$22,850
- After-tax cash flow
- $82,877/yr
For passive investors: Depreciation is non-cash, so a rental often shows a tax loss while cash-flowing — sheltering income. Rental losses are passive: they offset passive income freely, and up to $25,000/yr can offset ordinary (W-2) income if you actively participate and your MAGI is under $100k (phasing out to $0 by $150k); unused losses carry forward. On sale, claimed depreciation is recaptured at up to 25%, and gains may owe capital-gains tax (a 1031 exchange can defer both). Figures are a year-1 estimate at your 24.0% rate — not tax advice; consult a CPA.
Schools (NCES district)
No district data.
Livability — New York
- Score
- 75/100
- State rank
- #268
- US rank
- #4188
Category grades
Schools grade is shown separately in the Schools card above.
Census & demographics
- Census place
- New York, NY
- County
- Kings County · 2,614,986 people
- City population
- 7,731,280
- Metro
- New York-Newark-Jersey City, NY-NJ-PA
- Population (ZIP)
- 90,652
- Household income
- $69,883
- Rent vs Own
- Severe rent burden
- 6563.0
Population outlook (Kings County) Hauer SSP2
- Today (2025)
- 2,847,441 people
- By 2030
- 2,937,006 · +3.1%
- By 2040
- 3,095,491 · +8.7%
- By 2050
- 3,228,968 · +13.4%
- By 2075
- 3,321,723 · +16.7%
- By 2100
- 3,111,387 · +9.3%
Race, ethnicity, and origin ACS 2023
- Neighborhood character
- Diverse neighborhood (Simpson 0.65)
- Race & ethnicity
- Asian 40% Hispanic / Latino 40% White 16% Two or more races 7% Black 2% Native American 2%
- Hispanic origin (detail)
- Mexican 17% Puerto Rican 8% Dominican 5%
- Common ancestry
- Romanian 1% Scotch-Irish 1% Subsaharan African 1%
- Foreign-born
- 52% · China, Canada, Jamaica
- Languages at home
- 20% English-only · Spanish 35% Chinese 35% Arabic 3%
Political lean MEDSL · Kings
- 2024 margin
- Solid D (+44.0) · D 72.0% · R 28.0%
- 2008→2024 swing
- -15.5pp toward R · 2008: 59.4pp · 2024: 44.0pp
- All cycles
- 2024: D+44.0 2020: D+54.8 2016: D+61.8 2012: D+63.9 2008: D+59.4
Not yet ingested
- Civics
- —
Market trends
- HPI YoY
- ▲ 5.63%
- Current HPI
- 226.624
- Rent YoY
- ▲ 11.02%
- Metro
- New York-Newark-Jersey City, NY-NJ-PA
- State GDP YoY
- ▲ 2.60%
- F500 in state
- 92
Industry mix (Fortune 500 HQ in NY)
| Industry | F500 HQs | Revenue |
|---|---|---|
| Financial Services | 10 | $950B |
|
||
| Consumer Goods | 9 | $162B |
|
||
| Insurance | 4 | $225B |
|
||
| Telecommunications | 2 | $144B |
|
||
| Pharmaceuticals | 2 | $112B |
|
||
| Media / Entertainment | 2 | $69B |
|
||
Price history
+42.7% since first listed13 events — show timeline
- 2026-05-29 Listed $999,000 BNYMLS
- 2026-03-27 Price Changed $1,198,700 BNYMLS
- 2026-01-04 Price Changed $1,198,800 BNYMLS
- 2025-06-26 Price Changed $1,250,000 BNYMLS
- 2024-10-31 Price Changed $1,288,000 BNYMLS
- 2024-09-28 Price Changed $1,350,000 BNYMLS
- 2022-10-13 Price Changed $1,450,000 BNYMLS
- 2022-07-14 Price Changed $1,499,000 BNYMLS
- 2022-06-11 Listing Removed — SIBORMLS
- 2022-04-16 Listed $1,599,000 SIBORMLS
- 2016-06-10 Sold (Public Records) $990,000 Public Records
- 2015-12-16 Listed $1,230,000 BNYMLS
- 2011-04-29 Sold (Public Records) $700,000 Public Records
Property tax history
+5.1%/yrLatest (2025): $10,258 · +3.4% YoY. Source: county tax records.
Cash-flow waterfall
monthlySold comps — $/sqft
last 12 mo · ≤1 miLoading sold comps…