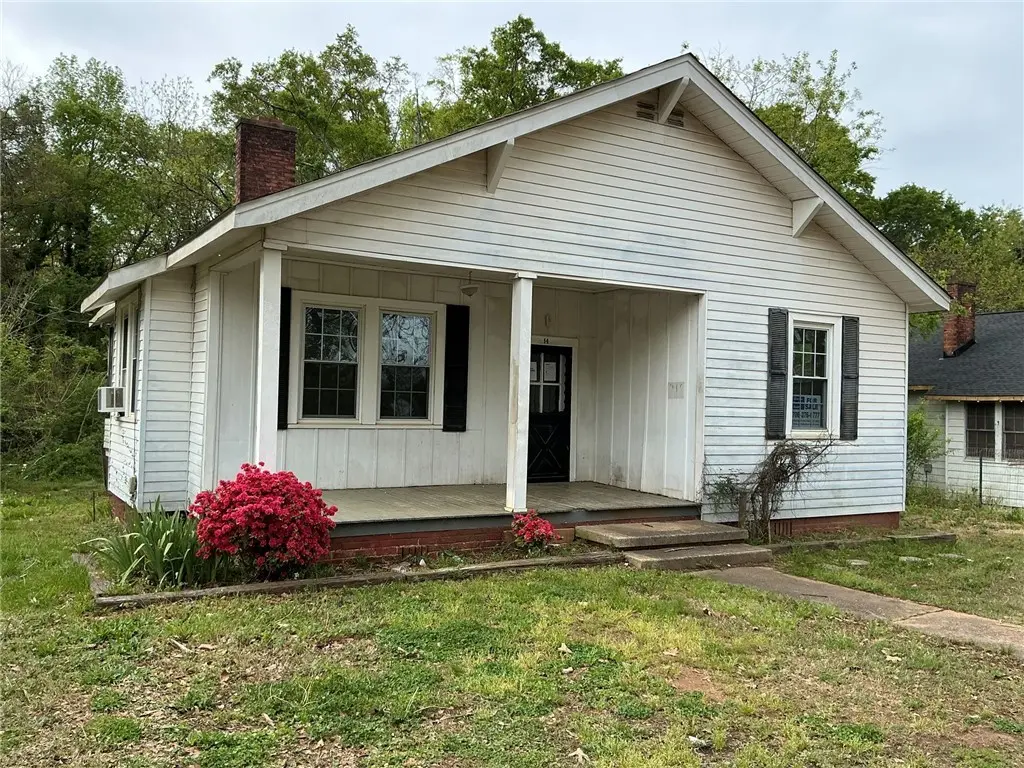
14 Ames Street St · Utica, SC
Flood risk 1/10 · Minimal
- FEMA flood zone
- X (unshaded)
- Chance of flooding over 30 yrs
- 0.0%
- Est. flood insurance / yr
- $507 – $1,088
Fire risk 4/10 · Minor
- Est. fire insurance / yr
- $783 – $1,453
Heat risk 5/10 · Moderate
- Hot days now (above 104°F)
- 7 days/yr
- Hot days in 30 yrs
- 15 days/yr
Wind risk 2/10 · Minimal
- Chance of severe wind over 30 yrs
- 1.0%
Air-quality risk 3/10 · Minor
- Unhealthy air days now
- 3 days/yr
- Unhealthy air days in 30 yrs
- 3 days/yr
Risk factors via First Street. Map © Google.
Why this score? — see what drove the B grade
The composite is a weighted blend of 9 inputs, each scored 0–100. Each bar is that input's sub-score; the figure is the points it added to the 100-point composite (weight × sub-score).
- Cash flow +30.0/30.0
- 1% rule +10.0/10.0
- DSCR +10.0/10.0
- ARV discount +7.5/15.0
- Rent growth +4.4/5.0
- Schools +3.7/10.0
- Livability +3.2/5.0
- Condition / age +2.5/5.0
- Appreciation +0.0/10.0
$84,900
🖨 Deal sheet (PDF) 📄 Offer letter ✓ Due diligence
Listing remarks
Three-bedroom one bath home on . 26 acres. Schedule all appointments through Showing Time. ALL offers must have POF for CASH offers and Lender PQ's for Financed offers. Cash offers require 10% EMD. Rehab Offers must have one rehab bid in hand pre-offer, no exceptions. Under FinCEN's new RRE Rule, transfers will be subject to reporting when buyers use entities or trusts to take title to residential real estate, when the transaction is all cash, privately financed or HELOC"
Key facts
- 0.26 acre lot
- Built 1944
- Listed 78 days
Property features AI
Exterior
- Utilities: Public sewer
- Home design: Single-story home; Over 50 years old; Vinyl siding
- Construction: Vinyl siding construction; Crawlspace foundation; Built over 50 years ago
- Exterior features: Outside city limits; Located in a subdivision
Interior
- Bedrooms: 3 main-level bedrooms
- Bathrooms: 1 full bathroom on the main level
- Heating & cooling: Natural gas heating
- Interior features: Crawl space basement
Neighborhood map
What this means for you Summary
Snapshot
- This is a 2-bed/1.0-bath single-family listed at $85k.
Deal economics
- At list price, monthly cash flow is $798 ($10k/yr) — positive.
- The deal already cash-flows at list — no discount required.
- Meets the 1% rule at list price ($2k rent vs $85k).
- Recommended offer: $80k (6.0% below list) — sets the bar for market timing.
- Cap rate 17.6% vs local median 2.6% in Utica — top-decile yield for the area; either an underpriced asset or a hidden risk that comps aren't pricing in. Stress-test before assuming the spread holds.
Location & tenants
- Location reads 64/100 on livability (#158 in SC) — a middle-class / working-renter tenant base. Strengths: cost of living A+, housing A+, crime A; Watch: schools F, amenities F, commute F.
- Oconee 01 (rural): math 41% / reading 47% proficiency, ranked #27 of 80 in SC (top 34%) — families likely to look elsewhere, expect single-tenant / working-renter base with shorter leases.
- Market conditions: Rents rising fast (+7.7%/yr); 367 active listings in the ZIP; 2 comparable units currently listed for rent nearby; 648 units permitted in Oconee County in 2024 (40 in 5+ unit buildings).
- This rent runs 39% of the median local income ($53k/yr) — at the standard rent-burdened threshold; future hikes will face affordability resistance.
Forward outlook
- Local home prices are declining (-3.0%/yr); year-one equity from $587 of loan paydown is wiped out by about $3k of value loss. Plan a longer hold.
- At projected returns (-3.0% appreciation + 7.7% rent growth), your $24k cash investment doubles in ~3 years — after that, you're playing with house money.
Negotiation context
- It's been on market 78 days — a 6% lower offer ($80k) is reasonable based on typical stale-listing flexibility.
Risks & watch-outs
- Watch-outs: built in 1944 — expect roof / HVAC / electrical / plumbing capex.
- Climate carrying-cost: extreme-heat days projected 7→15/yr by 2055 (HVAC capex compounding) — expect insurance premiums to compound above CPI over the hold.
Questions for the listing agent
- It's been on market 78 days. Have you received any prior offers? Is the seller open to a 6% concession, seller financing, or rate buy-down credit?
- Built in 1944 — when were the roof, HVAC, electrical panel, plumbing, and water heater last replaced?
- Why hasn't it sold? Are there any deal-killer items the seller is aware of (foundation, flood, title, zoning, code violations)?
- Is there a deadline driving the sale (1031 exchange, divorce, estate, relocation)? That informs how much negotiation room exists.
- Schools are F-rated, which usually means shorter tenancies and higher turnover. Who's the typical renter profile here, and what's been the actual vacancy rate?
- What's the average days-on-market for RENTAL listings here right now (not sales)? A rising rental-DOM trend means longer vacancies and softer asking-rent achievability than the comps imply.
- What's the recent tenant-quality profile in this submarket — average credit score on applications, eviction rate, late-payment / NSF rate, and stable-employment percentage? A property-management company in the area should have these aggregated.
- How much new for-sale + rental construction is in the pipeline within 1–3 miles? Heavy new supply typically softens prices + rents 12–24 months out; constrained supply supports both.
Investment metrics
- 1% rule
- 1.99% ✓
- Cap rate
- 17.57%
- Cash-on-cash
- 40.29%
- DSCR
- 2.79
- GRM
- 4.2
CMA / ARV
- ARV (on-the-fly)
- $235,743
- Comps found
- 12
Show comp detail 12 sales within ~0.75 mi
| Address | Dist | Beds/Ba | Sqft | Sold | Price | $/sf | Match |
|---|---|---|---|---|---|---|---|
| 502 Keith Ln | 0.24mi | 3/2.0 (+1) | 1,288 (-2%) | 5mo | $256,000 | $199 | 72 |
| 273 Utica Bend Ct | 0.38mi | 3/2.0 (+1) | 1,321 (+0%) | 2mo | $275,000 | $208 | 72 |
| 42 Sirrine St | 0.24mi | 3/1.0 (+1) | 1,187 (-10%) | 6mo | $185,000 | $156 | 63 |
| 406 Woodland Dr | 0.55mi | 3/2.0 (+1) | 1,316 (-0%) | 4mo | $270,000 | $205 | 62 |
| 405 Keith Ln | 0.27mi | 3/2.0 (+1) | 1,206 (-8%) | 7mo | $201,000 | $167 | 59 |
| 705 Sherwood Dr | 0.64mi | 2/1.0 | 1,218 (-8%) | 2mo | $217,500 | $179 | 56 |
| 111 Jason Dr | 0.59mi | 3/2.0 (+1) | 1,303 (-1%) | 9mo | $250,000 | $192 | 55 |
| 602 S Stribling St | 0.53mi | 3/2.0 (+1) | 1,357 (+3%) | 11mo | $262,500 | $193 | 52 |
| 416 Sherwood Dr | 0.73mi | 3/2.0 (+1) | 1,414 (+7%) | 1mo | $66,000 | $47 | 44 |
| 500 Sherwood Dr | 0.65mi | 3/2.0 (+1) | 1,403 (+6%) | 8mo | $233,000 | $166 | 43 |
| 510 Sherwood Dr | 0.56mi | 3/2.0 (+1) | 1,474 (+12%) | 6mo | $215,000 | $146 | 40 |
| 1316 E South 6th St | 0.53mi | 3/2.0 (+1) | 1,506 (+14%) | 8mo | $215,000 | $143 | 35 |
Match score weights: distance 35% · size 25% · config 20% · recency 20%. Top-matched comps best support the ARV.
Projected returns pro-forma
-3.0% appreciation · 7.71% rent growth · sell at horizon
- IRR
- 41.8%
- Equity multiple
- 2.91×
- Total profit
- $45,466
- Equity at exit
- $12,659
- IRR
- 50.1%
- Equity multiple
- 7.02×
- Total profit
- $143,008
- Equity at exit
- $7,341
Cash invested: $23,772 (down + closing). Projections, not guarantees.
Landlord ↔ Tenant lean methodology
- Overall (STATE)
- 90 Strongly Landlord-Friendly
- State South Carolina
- 90 Strongly Landlord-Friendly · R+6
- County
- — inherits STATE
- City
- — inherits STATE
ZIP-level market 29678
- Home prices YoY
- -32.5%
- Rents YoY
- 7.7%
- Active inventory
- 367
- Price-to-rent
- 4.2×
Monthly cashflow live
- Estimated rent
- $1,691 medium interval (Pro) →
- Mortgage (P&I)
- −$445
- Tax from tax record
- −$57 /mo · $690/yr
- Insurance
- −$35
- HOA
- −$0
- Vacancy / Maint / Mgmt
- −$355
- Net cashflow
- $798
Break-even live
Sensitivity live
| Price | -10% $846 | -5% $822 | +0% $798 | +5% $774 | +10% $750 |
|---|---|---|---|---|---|
| Rent | -10% $664 | -5% $731 | +0% $798 | +5% $865 | +10% $932 |
| Rate | -1.0pp $841 | -0.5pp $820 | base $798 | +0.5pp $776 | +1.0pp $754 |
UW: 25.0% down · 7.5% · 30yr · 1.5% tax · 5.0% vac · 8.0% maint · 8.0% mgmt
Financing live
Cash to close
- Down payment
- $21,225
- Closing costs
- $2,547
- Reserves months
- —
- Total cash needed
- —
Loan-product check · same deal, 3 products live
Conventional
25% down · 7.5% · 30yr
- Down + closing
- —
- Monthly P&I
- —
- Monthly cashflow
- —
- DSCR
- —
- Eligible?
- —
Personal DTI + credit; lowest rate.
DSCR
20% down · 8.5% · 30yr
- Down + closing
- —
- Monthly P&I
- —
- Monthly cashflow
- —
- DSCR
- —
- Eligible?
- —
No personal income docs; deal must DSCR.
Hard money
10% down · 12.0% · 12mo
- Down + closing
- —
- Monthly P&I
- —
- Monthly cashflow
- —
- DSCR
- —
- Eligible?
- —
Short-term bridge; refi at stabilization.
Rent comps 2 comps
| Address | Beds | Baths | Sqft | Rent | $/sqft | DOM | Units | Dist |
|---|---|---|---|---|---|---|---|---|
| 132 Wells Station Rd Seneca, SC | 3.0 | 2.0 | 1300 | $2,150 | $1.65 | 25d | 1 | 0.56mi |
| 131 Eric Dr Seneca, SC | 3.0 | 2.0 | 1611 | $1,700 | $1.06 | 25d | 1 | 0.62mi |
Listing history 18 events
-
2026-06-18days on market $84,900 Active 78 DOM
-
2026-06-17days on market $84,900 Active 77 DOM
-
2026-06-16days on market $84,900 Active 76 DOM
-
2026-06-15days on market $84,900 Active 75 DOM
-
2026-06-13days on market $84,900 Active 73 DOM
-
2026-06-10days on market $84,900 Active 70 DOM
-
2026-06-09days on market $84,900 Active 69 DOM
-
2026-06-08days on market $84,900 Active 68 DOM
-
2026-06-07days on market $84,900 Active 67 DOM
-
2026-06-05days on market $84,900 Active 64 DOM
-
2026-06-03days on market $84,900 Active 63 DOM
-
2026-06-03pricedays on market $84,900 Active 62 DOM
-
2026-06-01days on market $89,900 Active 61 DOM
-
2026-05-31days on market $89,900 Active 60 DOM
-
2026-05-01price $89,900
-
2026-03-31$94,900 Active
-
2026-03-05soldstatus $240,000
-
2023-08-24soldstatus $10,000,000
ⓘ Source: listings_history table (triggers on properties + properties_extension) + one-shot
backfill from property_details.listing_events for pre-trigger history.
Tax reassessment forecast SC · Resets to sale price
- Current annual tax
- $690 · $57/mo
- Projected year-2 tax
- $690 · $57/mo
- Expected delta
- $0/yr ($0/mo · 0.0%)
ⓘ Screening estimate from a state-policy table — verify with the county assessor before closing.
Climate risk First Street
- Flood 1/10 Low FEMA zone X (unshaded) · 0% chance over 30 yrs
- Wildfire 4/10 Moderate
- Heat 5/10 Major 7 d/yr ≥104°F today · 15 d/yr by 30 yrs out
- Wind 2/10 Low 100% chance of damaging wind over 30 yrs
- Air quality 3/10 Moderate 3 unhealthy d/yr today · 3 by 30 yrs out
Nearby sold comps map
Loading sold comps map…
Walkable amenities ~0.75 mi
Loading nearby amenities…
Taxation est. · year 1
- Rental income
- $20,297
- − Mortgage interest
- −$4,756
- − Property taxes
- −$690
- − Insurance
- −$424
- − Repairs & maintenance
- −$1,624
- − Management
- −$1,624
- − Depreciation
- −$2,470
- Taxable income
- $8,709
- Est. tax owed @ 24.0%
- −$2,090
- After-tax cash flow
- $7,487/yr
For passive investors: Depreciation is non-cash, so a rental often shows a tax loss while cash-flowing — sheltering income. Rental losses are passive: they offset passive income freely, and up to $25,000/yr can offset ordinary (W-2) income if you actively participate and your MAGI is under $100k (phasing out to $0 by $150k); unused losses carry forward. On sale, claimed depreciation is recaptured at up to 25%, and gains may owe capital-gains tax (a 1031 exchange can defer both). Figures are a year-1 estimate at your 24.0% rate — not tax advice; consult a CPA.
Schools (NCES district)
- District
- Oconee 01
- NCES district ID
- 4503060
- Math proficiency
- 41% ▼ -7.00%
- Reading proficiency
- 47% ▼ -1.00%
- Median HH income
- $42,074
- Composite
- 37.03/100
- National rank
- #4516
- State rank
- #27 of 80 in SC
Livability — Utica
- Score
- 64/100
- State rank
- #158
- US rank
- #14701
Category grades
Schools grade is shown separately in the Schools card above.
Census & demographics
- Census place
- Utica, SC
- County
- Oconee County · 36,517 people
- Metro
- Seneca, SC
- Population (ZIP)
- 23,767
- Household income
- $52,550
- Rent vs Own
- Severe rent burden
- 822.0
Population outlook (Oconee County) Hauer SSP2
- Today (2025)
- 77,950 people
- By 2030
- 78,551 · +0.8%
- By 2040
- 78,628 · +0.9%
- By 2050
- 77,052 · -1.2%
- By 2075
- 71,098 · -8.8%
- By 2100
- 61,216 · -21.5%
Race, ethnicity, and origin ACS 2023
- Neighborhood character
- Predominantly White (74%)
- Race & ethnicity
- White 74% Black 18% Two or more races 5% Hispanic / Latino 4%
- Common ancestry
- Slovak 2% Lithuanian 2% Italian 2%
- Foreign-born
- 2% · Canada, United Kingdom
- Languages at home
- 97% English-only · Spanish 1% French/Haitian/Cajun 1%
Political lean MEDSL · Oconee
- 2024 margin
- Solid R (+51.5) · D 23.6% · R 75.2% · Other 1.2%
- 2008→2024 swing
- -14.0pp toward R · 2008: -37.5pp · 2024: -51.5pp
- All cycles
- 2024: R+51.5 2020: R+47.4 2016: R+48.1 2012: R+42.6 2008: R+37.5
Not yet ingested
- Civics
- —
Market trends
- HPI YoY
- ▼ -91.37%
- Current HPI
- 189.6751
- Rent YoY
- ▲ 7.71%
- Metro
- Seneca, SC
- State GDP YoY
- ▲ 4.51%
- F500 in state
- 2
Industry mix (Fortune 500 HQ in SC)
| Industry | F500 HQs | Revenue |
|---|---|---|
| Packaging | 1 | $7B |
|
||
Price history
-99.1% since first listed4 events — show timeline
- 2026-05-01 Price Changed $89,900 WUMLS
- 2026-03-31 Listed $94,900 WUMLS
- 2026-03-05 Sold (Public Records) $240,000 Public Records
- 2023-08-24 Sold (Public Records) $10,000,000 Public Records
Property tax history
+15.1%/yrLatest (2025): $690 · +0.0% YoY. Source: county tax records.
Cash-flow waterfall
monthlySold comps — $/sqft
last 12 mo · ≤1 miLoading sold comps…